by Markets4you

Market Analysis

Why Professional Traders Monitor 10 Year Treasury Yields for

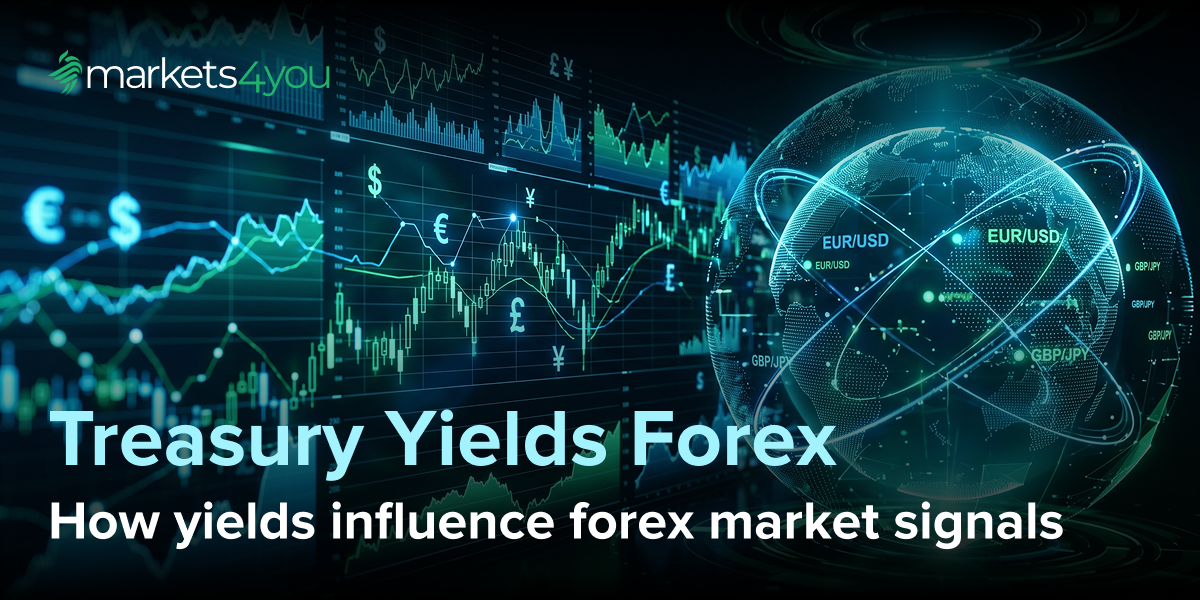
The foreign exchange market does not operate in isolation. Behind every major currency movement lies a deeper layer of capital flows, macro expectations, and institutional positioning. Among all macro indicators, the 10 year yield stands out as one of the most closely monitored by professional traders. The 10 year treasury yield reflects the cost of long-term borrowing in the United States, but more importantly, it serves as a real-time benchmark for global capital allocation. When US Treasury bond yields move, they influence everything from equity valuations to commodity pricing, and most critically, currency direction. For institutional participants, the bond market often leads while forex reacts. This is why traders consistently track tools such as the 10 year yield curve chart, the 10 year yield curve live, and broader US treasury yield curve graph movements to anticipate shifts before they appear in currency pairs. Understanding how yields interact with forex allows traders to interpret Fixed-Income Market Sentiment, detect Macro-Regime Shift, and position ahead of major moves. In this article, we break down the mechanisms that connect yields to currencies and how professional traders turn these insights into actionable strategies.

The Yield-Currency Link Understanding Interest Rate Differentials

At the foundation of forex pricing lies the concept of Interest Rate Differential (IRD). This represents the difference in returns between two currencies and acts as a primary driver of exchange rate movements. When traders evaluate currency pairs, they are not just comparing economic strength. They are comparing expected returns. The 10 year treasury yield plays a critical role in shaping those expectations, particularly in longer-term positioning. If US yields rise relative to other economies:
  • The USD becomes more attractive
  • Capital shifts toward USD-denominated assets
  • Currency demand increases
This process is known as Capital Flow Migration, and it is heavily influenced by Risk-Free Rate Benchmarking. The US 10-year yield is widely considered the global benchmark for “risk-free” returns, meaning it directly competes with yields from other sovereign bonds. Professional traders go beyond nominal comparisons and analyse:
  • Real Yield Spreads between countries
  • Changes in Inflation-Adjusted Returns
  • The sustainability of Nominal Returns
This is especially relevant in G10 Currency Carry Trade strategies, where traders borrow in low-yield currencies and invest in higher-yielding ones. Even small changes in IRD can trigger large-scale repositioning in the forex market. For example:
  • Rising US yields vs Europe → EUR/USD pressure
  • Rising US yields vs Japan → USD/JPY strength
This is why yield movements often precede currency trends rather than follow them. In fact, many institutional strategies rely on cross-market confirmation, similar to how professional traders apply intermarket frameworks when analysing macro signals. Understanding these relationships becomes even more powerful when combined with approaches outlined in using intermarket analysis to confirm high probability price reversals.

The Risk-Free Rate as a Magnet for Global Institutional Capital

The 10 year yield is not just a number. It represents the baseline return that global investors can earn without taking significant credit risk. Because of this, it acts as a magnet for institutional capital. When yields rise:
  • Global funds reallocate toward US assets
  • Demand for Treasuries increases
  • USD demand strengthens
This is driven by Risk-Free Rate Benchmarking, where investors compare all opportunities against US Treasury returns. If US yields become more attractive, other markets must compete or lose capital. This leads to:
  • Safe-Haven Liquidity Influx during uncertainty
  • Reduced appetite for risk assets
  • Pressure on emerging markets
In periods of rising yields, traders often observe:
  • Emerging Market Capital Outflow
  • Weakness in high-beta currencies
  • Strength in USD across multiple pairs
This dynamic becomes even more pronounced when there is expansion in Sovereign Debt Risk Premia, where investors demand higher returns for holding riskier government bonds. In such environments, US Treasuries regain dominance as the preferred safe asset. Professional traders interpret rising yields not just as a rate story, but as a signal of shifting global capital flows. This perspective allows them to anticipate forex moves before they are fully priced in. This dynamic also explains why the US dollar tends to strengthen during periods of global uncertainty. As capital seeks safety and yield, it flows into US assets, reinforcing the dollar’s dominance. This behaviour aligns closely with the broader dynamics explored in why the US dollar remains the ultimate safe haven during global uncertainty.

US10Y vs. USD/JPY The Strongest Correlation in the Forex Market

Among all currency relationships, the correlation between US yields and USD/JPY is one of the most consistent and widely traded. Japan maintains a historically low-yield environment, largely due to prolonged accommodative monetary policy. As a result, the Interest Rate Differential (IRD) between the US and Japan is highly sensitive to changes in the 10 year treasury yield. When US yields rise:
  • The yield gap widens
  • Japanese investors seek higher returns abroad
  • USD demand increases
  • JPY weakens
This creates a strong directional bias in USD/JPY. Professional traders often track:
  • The DXY Correlation Coefficient relative to yields
  • Real-time changes in the 10 year yield curve live
  • Overlay charts combining USD/JPY with yield movements
This relationship is further strengthened by Japan’s exposure to Duration Risk Exposure, where investors are highly sensitive to changes in long-term yields. Even small increases in US yields can trigger significant repositioning. Additionally, USD/JPY reflects broader Monetary Policy Transmission differences:
  • The Federal Reserve reacts to inflation and growth
  • The Bank of Japan maintains yield control
This divergence amplifies the impact of US yield movements on the currency pair. For traders, this makes USD/JPY one of the clearest expressions of yield-driven forex dynamics.

Real Yields vs. Nominal Yields Calculating the True Cost of Carry

While many retail traders focus on headline yields, professional traders go a step further by analysing the difference between Nominal Returns and Inflation-Adjusted Returns. This distinction is critical because not all yield increases translate into real purchasing power gains. The 10 year treasury yield represents nominal yield. However, to understand the true return, traders look at Real Yield Spreads, which are derived using Treasury Inflation-Protected Securities (TIPS). Real Yield = Nominal Yield − Inflation Expectations This calculation provides a clearer picture of actual investment value. When real yields rise:
  • USD typically strengthens
  • Gold and other non-yielding assets weaken
  • Carry trades become more attractive
This is due to the rising Opportunity Cost of Non-Yielding Assets, where holding assets like gold becomes less appealing compared to yield-bearing instruments. Professional traders closely monitor:
  • TIPS pricing
  • Inflation expectations
  • Divergences between nominal and real yields
For example, if nominal yields rise but inflation expectations rise faster, real yields may remain flat or even decline. In such cases:
  • USD strength may be limited
  • Gold may remain supported
This is where Intermarket Divergence Analysis becomes essential. Traders compare bond markets, commodities, and forex to identify inconsistencies that can lead to trading opportunities. Understanding real yields allows traders to move beyond surface-level analysis and align with how institutional capital evaluates returns.

The Yield Curve as a Leading Indicator for Recessionary FX Regimes

The shape of the 10 year yield curve provides valuable insight into economic expectations and future market conditions. Under normal circumstances:
  • Long-term yields are higher than short-term yields
  • The curve is upward sloping
However, when the curve flattens or inverts, it signals rising Yield Curve Inversion Risk. This occurs when short-term yields exceed long-term yields, reflecting expectations of slower growth or recession. Professional traders use the US treasury yield curve graph to monitor:
  • Changes in economic outlook
  • Shifts in Fixed-Income Market Sentiment
  • Early signals of Macro-Regime Shift Detection
An inverted curve often leads to:
  • Defensive positioning
  • Increased volatility
  • Changes in USD behaviour
Interestingly, the USD does not always weaken during recession signals. Instead, it may strengthen due to:
  • Safe-haven demand
  • Global liquidity preference
  • Risk-off positioning
This creates complex trading environments where:
  • Commodity currencies may weaken
  • USD may strengthen against risk assets
  • Correlations shift across markets
Tracking the 10 year yield curve chart allows traders to anticipate these transitions before they fully materialise in price action.

Federal Reserve Guidance and the Bond-Market Front-Run

One of the most important characteristics of the bond market is that it is forward-looking. It does not wait for central bank decisions. Instead, it anticipates them. This behaviour is known as Bond Market Front-Running. Professional traders monitor:
  • CME Fed Watch Data Integration to track rate expectations
  • Changes in Federal Funds Rate Sensitivity
  • Shifts in Forward Guidance Discounting
When markets expect tighter policy:
  • Yields rise ahead of official announcements
  • USD strengthens before rate hikes occur
Conversely, if markets anticipate easing:
  • Yields fall
  • USD weakens
This dynamic reflects the broader process of Monetary Policy Transmission, where expectations drive asset pricing even before policies are implemented. Additionally, factors such as:
  • QT Impact (Quantitative Tightening)
  • Liquidity withdrawal
  • Balance sheet reduction
can accelerate movements in yields through Benchmark Treasury Re-Pricing. Professional traders do not wait for central bank confirmation. Instead, they read the bond market as a real-time indicator of where policy is heading. This is why the 10 year treasury yield often moves first, followed by adjustments in currency markets.

Commodity Currencies and their Sensitivity to US Debt Pricing

Currencies such as AUD, CAD, and NZD are highly sensitive to global yield dynamics, particularly movements in US yields. When the 10 year yield rises:
  • USD becomes more attractive
  • Commodity currencies lose relative yield appeal
  • Capital rotates out of risk-sensitive assets
This effect is amplified by:
  • Capital Flow Migration into US assets
  • Reduced global liquidity
  • Stronger USD funding conditions
In addition, rising yields can influence:
  • Commodity prices
  • Global trade flows
  • Risk sentiment
Professional traders also incorporate advanced metrics such as:
  • Cross-Asset Basis Swaps
  • Volatility Term Structure
  • Changes in Duration Risk Exposure
These tools help identify how different asset classes are reacting to yield movements. Another key factor is Fiscal Dominance Implications, where government borrowing levels influence yield behaviour. Rising deficits can push yields higher, further strengthening USD and pressuring commodity-linked currencies. This interconnected framework allows traders to anticipate how yield changes ripple across markets, not just within forex.

Technical Intersections Trading the Breakout in Yields via Currency Pairs

While macro understanding provides direction, professional traders still require precise entry and exit strategies. This is where technical intersections come into play. Institutional traders often combine:
  • Yield analysis
  • Price action
  • Intermarket signals
A common approach is to monitor 10 year yield curve live movements alongside key currency pairs. When yields approach or break significant levels, traders look for confirmation in forex charts. For example:
  • If the 10 year treasury yield breaks above resistance
  • And USD pairs have not yet reacted
  • This creates a potential lag opportunity
This concept is rooted in Intermarket Divergence Analysis, where one market moves ahead of another. Since bond markets often lead, forex traders can use yield breakouts as early signals. Professional setups typically include:
  • Yield breakout confirmation
  • Alignment with macro bias
  • Technical structure on currency charts
For instance:
  • Rising yields + bullish USD structure → buy USD dips
  • Falling yields + bearish USD structure → sell USD rallies
Advanced traders also monitor:
  • Volatility Term Structure to gauge market expectations
  • Liquidity conditions across sessions
  • Institutional positioning flows
To refine execution further, traders often integrate insights from how institutional participants approach liquidity. Understanding how liquidity zones are formed and targeted can improve timing when trading yield-driven moves. Similarly, recognising why execution timing matters can significantly improve trade precision, especially during periods of high volatility. This becomes particularly relevant when aligning macro signals with execution windows, as explained in why time-of-day is more critical than price levels for execution. By combining macro signals with technical execution, traders create a more complete framework that mirrors institutional decision-making.

Summary

The 10 year yield is one of the most powerful macro indicators in the financial markets. It acts as a bridge between fixed-income markets and forex, providing insight into capital flows, policy expectations, and global risk sentiment. Professional traders monitor the 10 year treasury yield because it reveals:
  • Changes in Interest Rate Differential (IRD)
  • Shifts in Capital Flow Migration
  • Movements in Real Yield Spreads
  • Signals of Macro-Regime Shift Detection
Through tools like the 10 year yield curve chart, 10 year yield curve live, and US treasury yield curve graph, traders gain forward-looking insights that are often not yet visible in price charts. More importantly, yields allow traders to think beyond individual currency pairs and understand the broader financial system. This includes:
  • How central bank expectations are priced
  • How institutional capital reallocates
  • How global liquidity conditions evolve
By integrating yield analysis into your trading approach, you align yourself with how professional traders interpret the market. Instead of reacting to price, you begin anticipating it.

FAQs

  1. Why does the USD/JPY rise whenever the US 10-Year Treasury yield spikes?
USD/JPY is highly sensitive to Interest Rate Differential (IRD) between the US and Japan. When the 10 year treasury yield rises, the gap between US and Japanese yields widens. This encourages capital to flow into USD assets, weakening the yen and pushing USD/JPY higher.
  1. What happens to the EUR/USD if the 10-Year Yield falls while the 2-Year Yield rises?
This scenario reflects a flattening yield curve and increasing Yield Curve Inversion Risk. It signals uncertainty about long-term growth while short-term rates remain elevated. In such cases, EUR/USD may experience mixed movements depending on broader Monetary Policy Transmission and market expectations.
  1. How do Real Yields impact the price of Gold and the USD?
Real yields, derived from Treasury Inflation-Protected Securities (TIPS), reflect Inflation-Adjusted Returns. When real yields rise, the Opportunity Cost of Non-Yielding Assets increases. This typically strengthens the USD while putting downward pressure on gold prices.
  1. Can the 10-Year Treasury yield predict a breakout in the DXY?
Yes. The relationship between yields and the dollar index can be measured using the DXY Correlation Coefficient. When yields break key levels, they often signal upcoming moves in the DXY, especially during strong macro trends or policy shifts.
  1. What is Term Premium and why should Forex traders care about it?
Term Premium Expansion refers to the additional return investors demand for holding long-term bonds. It reflects uncertainty around inflation, policy, and risk. Changes in term premium influence long-term yields and can signal shifts in market sentiment, making it highly relevant for forex positioning.
  1. How does the 10 year yield influence emerging market currencies?
Rising US yields increase the attractiveness of USD assets, leading to Emerging Market Capital Outflow. This weakens emerging market currencies as investors reallocate funds toward higher-yielding, lower-risk US instruments.
  1. Why do professional traders monitor the 10 year yield instead of shorter-term yields?
The 10-year yield reflects long-term economic expectations, inflation outlook, and policy direction. It captures broader Fixed-Income Market Sentiment and is less influenced by short-term volatility compared to shorter maturities.

Ready to Get Started?

It's time to step into the market: Sign up today and navigate the world of trading with confidence!

Start Trading Now