MOU Collapses as Iran Attacks Tankers, Warsh at Sintra Wednesday, NFP Thursday

Market Sentiment Overview
The week of June 29 to July 3 opens with the fragile ceasefire that markets had priced in following the June 15 MOU collapsing in real time. On Thursday June 26, Iran attacked the commercial vessel M/V EverLovely as it transited the Strait of Hormuz via a route Tehran had previously warned shipping companies not to use. President Trump declared the attack a ceasefire violation and ordered retaliatory strikes on Iranian positions along the Strait on Friday June 26. Iran then struck the M/T Kiku tanker on Saturday morning, destroying it and its cargo of over two million barrels of crude oil. US Central Command responded with a second round of strikes on Saturday June 27, targeting Iranian military surveillance facilities, communication systems, air defense sites, drone storage, and mine-laying capabilities. The war, which markets had begun to treat as functionally over, is actively re-escalating. Against this backdrop, the prior week’s data calendar delivered key readings. US PCE inflation for May came in at 4.1% YoY with core PCE at 3.4% (both in line with expectations). May NFP showed a third consecutive month of strong job gains at 172,000. The final Q1 GDP revision was upgraded to 2.1% from 1.6%. Outside the US, UK Prime Minister Keir Starmer resigned (with Andy Burnham widely expected to succeed him), adding political uncertainty to an already fragile Sterling. The ECB Forum in Sintra, Portugal begins June 29 and runs through July 1, with Lagarde, Warsh, Bailey, and Bank of Canada Governor Macklem all scheduled to speak together on Wednesday July 2 (that panel will be the central event of the week). The DXY extended its gains for a second consecutive week, peaking near 102 (its highest level since May 2025). EUR/USD hit a fresh one-year low of 1.1324. GBP/USD posted its worst monthly performance since July 2025. Gold extended its losing streak to a fourth consecutive week, briefly dropping below 4,000. Bitcoin hit a 20-month low of 58,115. The S&P 500 fell 1.67% on the week as tech stocks sold off heavily, with the Nasdaq losing over 4%. This is a holiday-shortened week (US markets close early Thursday, NFP released Thursday July 3, US markets closed Friday July 4). Month-end, quarter-end, and half-year rebalancing flows add directional uncertainty throughout.
Currencies
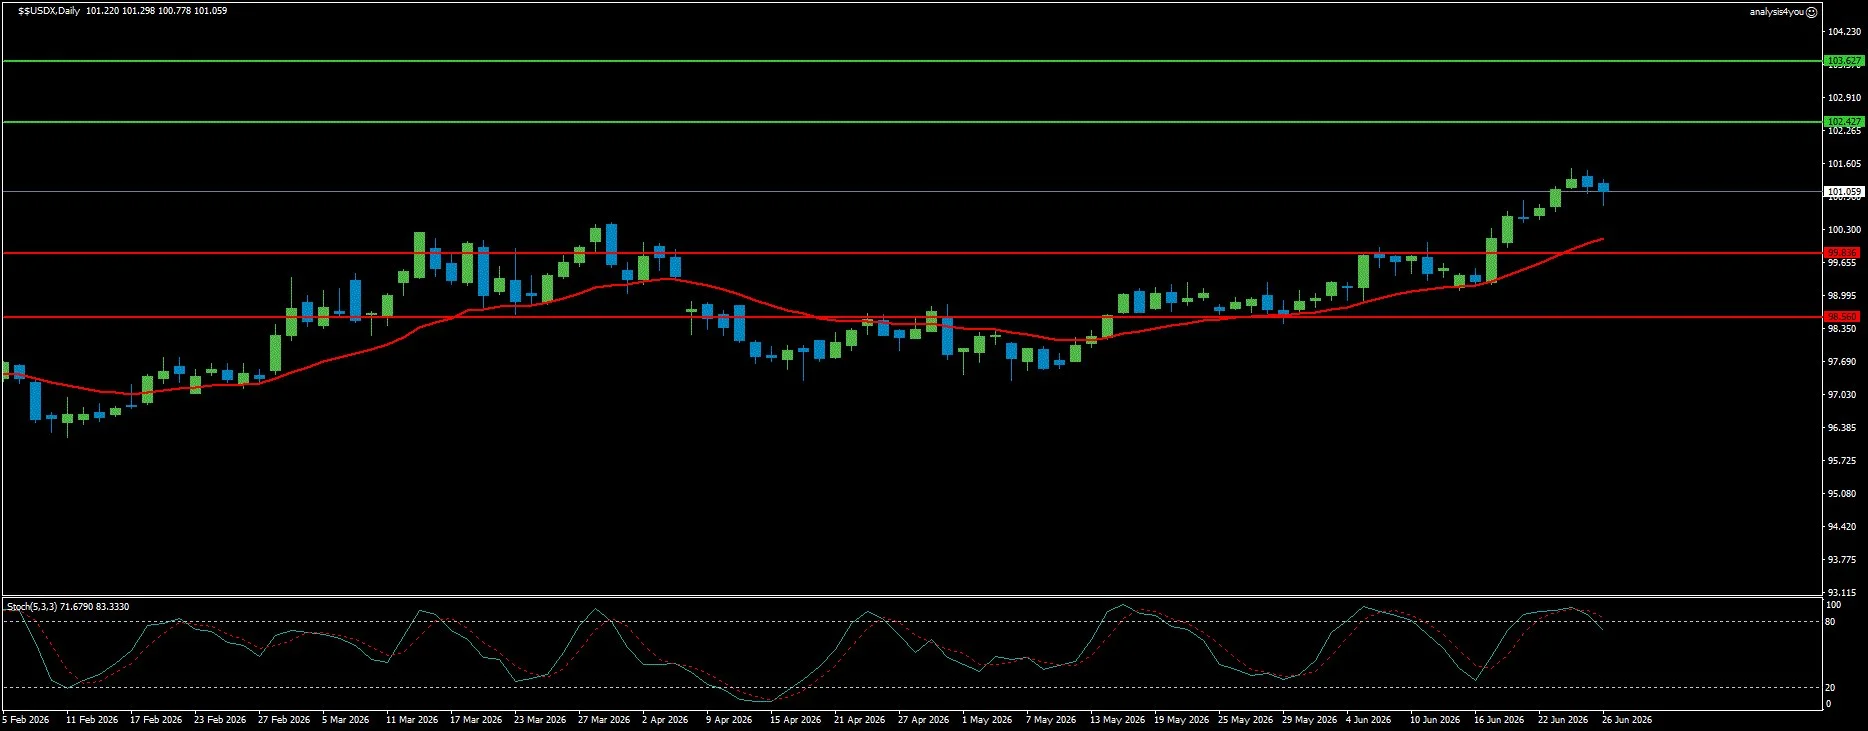
USD Index: Second Consecutive Week of Gains, Sintra and NFP Are Next Tests (101.06)
Current Trend: Bullish
Resistance: 102.43 | 103.63
Support: 99.84 | 98.56
The Dollar Index extended its gains for a second consecutive week, peaking near 102 before closing at 101.06. This represents the best two-week performance for the DXY since mid-March, at the height of the initial Iran war escalation. The driver was a continuation of the Warsh hawkish repricing, reinforced by Fed speakers Goolsbee and Williams both pushing back against any notion of near-term easing. CFTC data showed net long positions in the Dollar rose to 13,200 contracts (the most bullish speculative positioning since March 2025). Importantly, positioning is only at the 57th percentile of its five-year range, meaning there is room for further Dollar accumulation before the trade becomes crowded. Technically, DXY is above all three MAs, with the MA curling sharply higher. The current bar is at the upper Bollinger Band and is a bearish close (indicating a short-term pause in the rally). Stochastic is turning down from overbought territory (characteristic of a momentum consolidation rather than a trend reversal).
For Week 17, the Dollar faces two competing forces. The Warsh Sintra panel on Wednesday could extend the rally if he doubles down on the hawkish message, or cause a brief pullback if he attempts to soften market expectations around September. NFP on Thursday is the bigger wildcard: a strong print takes DXY toward 102.43 resistance and potentially 103.63. A weak print would be the first credible threat to the two-week rally, with 99.84 the initial support target. The re-escalation in the Strait also introduces safe-haven demand for Dollars, which could provide a floor even on softer data. Resistance at 102.43 / 103.63. Support at 99.84 / 98.56.
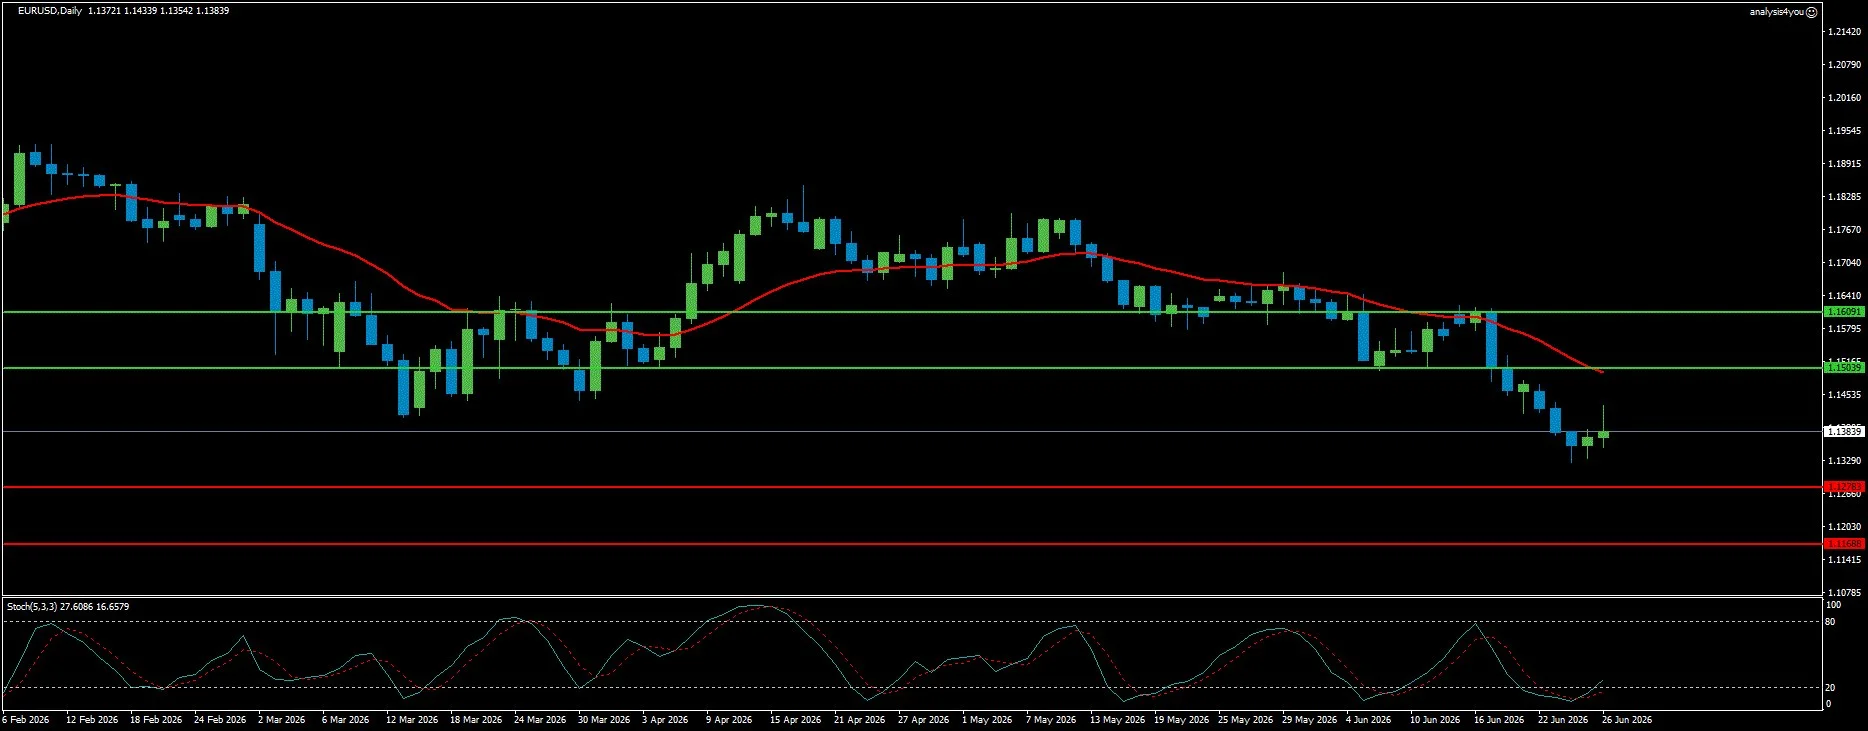
EUR/USD: One-Year Low, Oversold Bounce Possible, Lagarde-Warsh at Sintra Wednesday (1.1384)
Current Trend: Bearish
Resistance: 1.1504 | 1.1609
Support: 1.1278 | 1.1169
EUR/USD recorded its worst monthly performance since July 2025, falling to a fresh one-year low of 1.1324 before recovering modestly to close around 1.1384. The pair has fallen roughly 3% in two consecutive weeks since the Warsh Fed meeting. The fundamental case against the Euro is clear: the ECB hiked once but the rate differential with the US remains unfavorable, Eurozone growth is sluggish (June Composite PMI at 49.5, still in contraction), and services inflation at 3.6% creates a stagflationary trap that limits the ECB’s political room to hike aggressively. ECB board member Schnabel argued that further hikes will likely be needed, while Lagarde struck a more cautious tone (the internal division within the ECB is itself a negative for the Euro). The DK_FinMa chart shows EUR/USD below all three moving averages in a clear downtrend, pressing against the lower Bollinger Band. The current bar is a bullish recovery candle, with stochastic turning up from deeply oversold territory. The key resistance on any recovery is 1.1504 (where the MA cluster converges). Below, 1.1278 is the next level to watch, followed by the 100-week SMA near 1.1291.
Week 17 presents two potential catalysts. First, the preliminary Eurozone June CPI on Wednesday (if inflation undershoots expectations significantly due to the oil price collapse, it reduces ECB hike pressure). Second, the ECB Forum panel with Lagarde and Warsh speaking together creates headline risk in both directions. Resistance at 1.1504 / 1.1609. Support at 1.1278 / 1.1169.
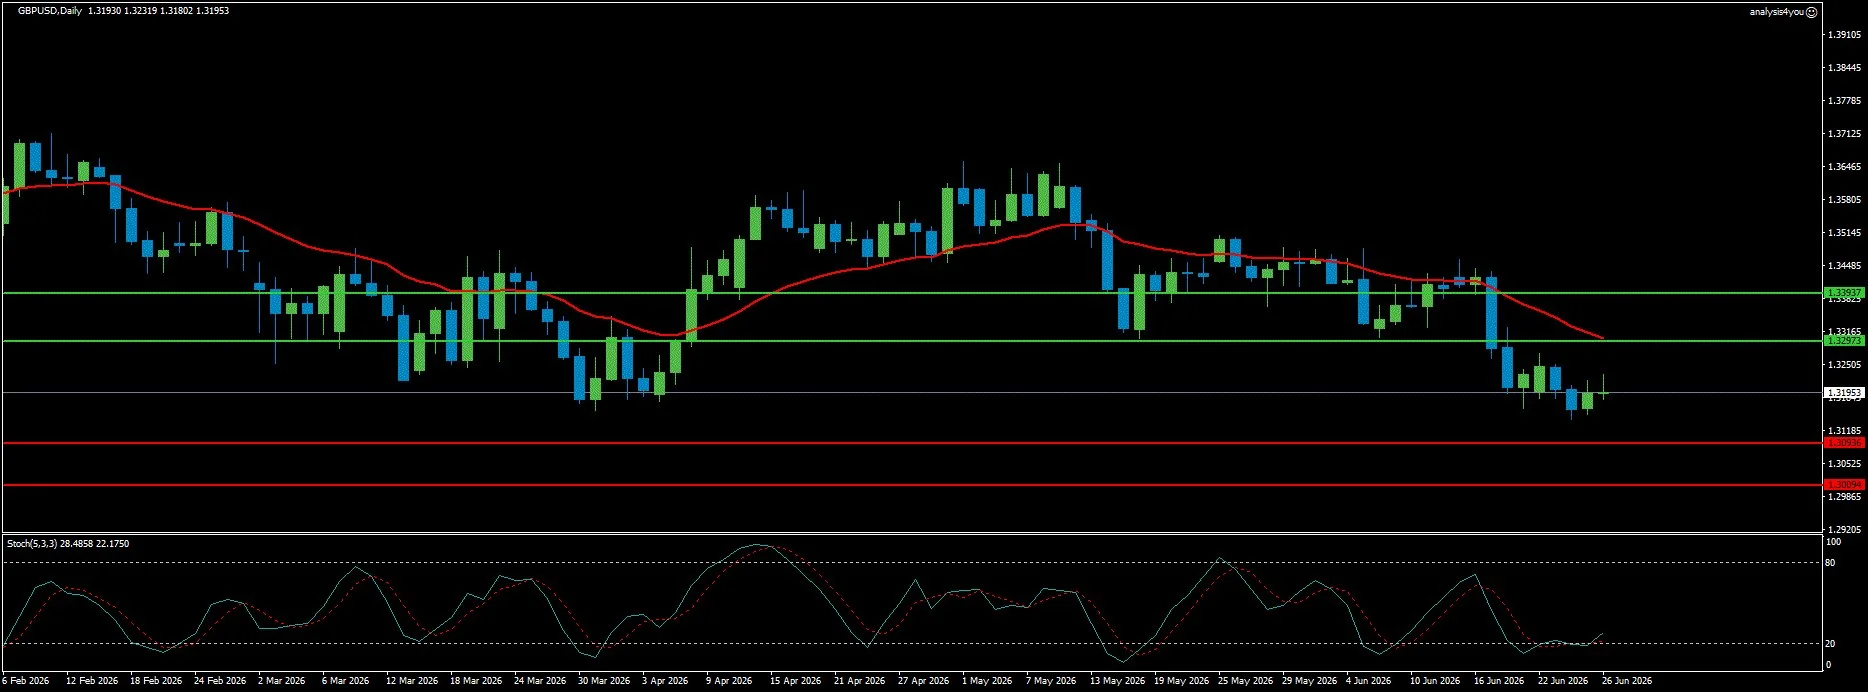
GBP/USD: Worst Month Since July 2025, Starmer Resigns, Burnham Premium Weighs (1.3195)
Current Trend: Bearish
Resistance: 1.3297 | 1.3394
Support: 1.3094 | 1.3009
Sterling closed the week near 1.3195, posting its worst monthly performance since July 2025 with a loss of approximately 2.2% in June alone. Current levels are the lowest since November 2025. The pair is being hit by a double burden: external USD strength from the Warsh hawkish repricing, and domestic political uncertainty following the resignation of Prime Minister Keir Starmer. Andy Burnham is the frontrunner to succeed Starmer (expected to take office in mid-July). Markets are concerned about his fiscal agenda (potential nationalizations, higher public spending, and tax increases). Lower oil prices following the MOU signing initially reduced the probability of aggressive BoE hikes, with markets now pricing only one rate increase before year-end versus two priced just weeks ago. However, UK inflation expectations remain at their highest since 2009. BoE Governor Bailey speaks at the ECB Forum on Wednesday, and his tone will be closely watched alongside Warsh.
The DK_FinMa chart mirrors EUR/USD. Price is below all three MAs, at the lower Bollinger Band, with a bullish recovery candle on the current bar and stochastic turning up from oversold. The 1.3297 resistance is the first test on any recovery. Below, 1.3094 is the immediate support, with 1.3009 the more significant structural level. A break below 1.3009 would open the pathway toward 1.2900. Resistance at 1.3297 / 1.3394. Support at 1.3094 / 1.3009.
Stocks
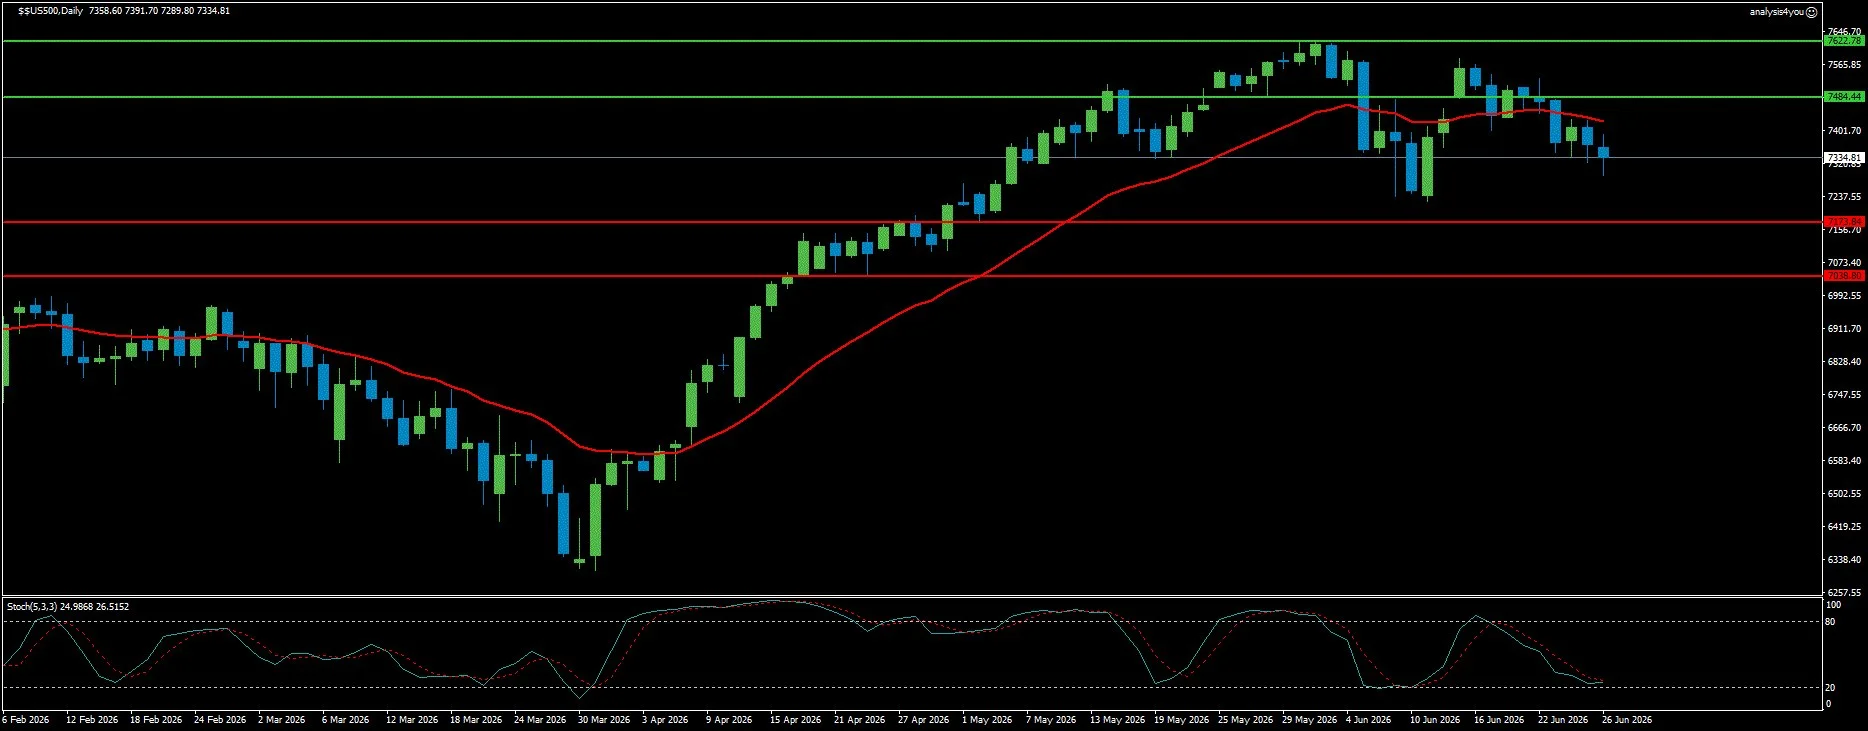
S&P 500: Breaks Below MA20 for First Time Since April, NFP and Iran Define Week (7,335)
Current Trend: Bearish Short-Term
Resistance: 7,484 | 7,623
Support: 7,174 | 7,039
The S&P 500 snapped its two-week winning streak with a loss of 1.67%, closing at 7,334.81. The Nasdaq dropped over 4% on the week as semiconductor stocks experienced sharp volatility. The Philadelphia Semiconductor Index (which had surged 85% from its late-March lows) pulled back sharply as investors reassessed whether AI-driven valuations can be sustained in a higher-for-longer rate environment. The health care sector was the standout performer, outperforming the S&P 500 by the largest margin on record in a single week (9.92 percentage points) as defensive rotation accelerated. JPMorgan raised its 2026 S&P 500 target from 7,200 to 7,800 during the week (implying approximately 6% upside from Friday’s close). The DK_FinMa chart shows the S&P 500 has broken below its MA20 for the first time since the April recovery began, though it remains above the MA50 and MA200.
The current bar is at the lower Bollinger Band and is bearish. Stochastic is turning up from oversold (suggesting the immediate selling pressure is moderating). The 7,174 support is the critical level below current prices (a break there would signal the beginning of a more serious correction). The broader uptrend from the April lows near 6,300 remains structurally intact as long as the MA50 holds. Week 17 presents a complex picture. The holiday-shortened week with lower liquidity amplifies volatility in both directions. NFP on Thursday is the pivotal event (a strong print that cements September hike expectations would be negative for equities, particularly growth and tech stocks). The Iran re-escalation introduces a second risk layer. Resistance at 7,484 / 7,623. Support at 7,174 / 7,039.
Commodities
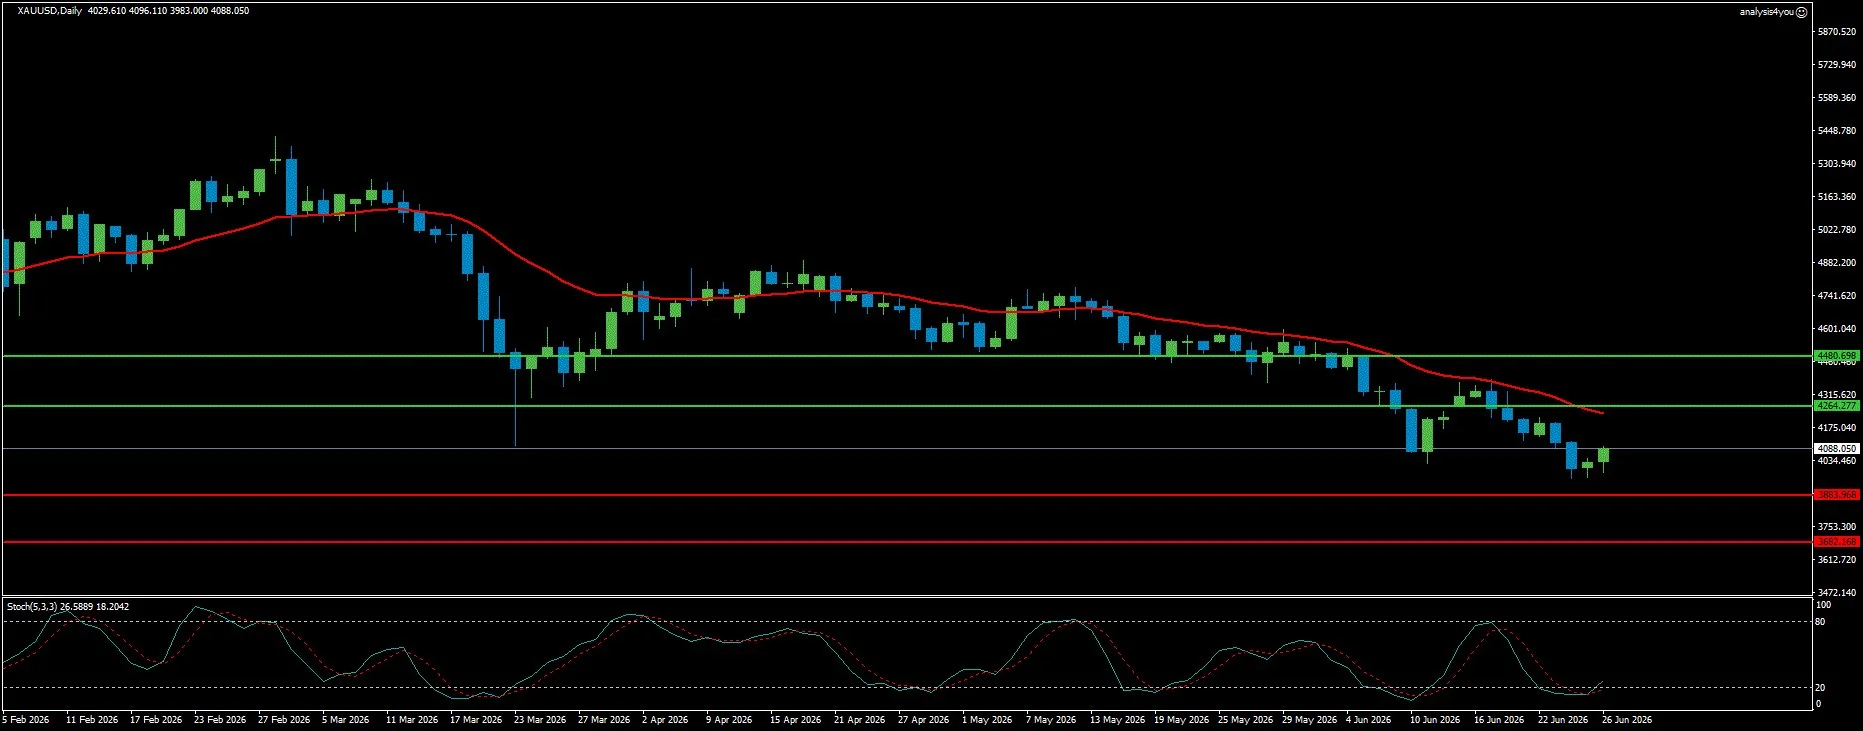
Gold: Fourth Consecutive Weekly Loss, $4,000 Floor Being Tested, Dual Catalysts (4,088)
Current Trend: Volatile/Bearish
Resistance: 4,264 | 4,481
Support: 3,884 | 3,682
Gold extended its losing streak to a fourth consecutive week, with the most dramatic development being an intraday drop below 4,000 (a level not seen since November 2025). The metal recovered from those lows to close near 4,088, with the long wick on the weekly candle suggesting that buyers are defending the 4,000 level aggressively. Wall Street analysts are divided: JPMorgan cut its Q3 gold target by 600 dollars to 5,300 while still seeing upside from current levels; Goldman turned tactically cautious, citing no Fed cuts this year; State Street argues that the central bank debasement trade and reserve diversification trend remains intact and that 4,000 will hold. The complication for Week 17 is the Iran re-escalation. Gold typically benefits from safe-haven flows during geopolitical stress, but during this conflict it has repeatedly failed to sustain rallies because Dollar safe-haven demand has dominated.
If the Strait situation deteriorates further, there is a scenario where both the Dollar and Gold rise simultaneously (as occurred in the early weeks of the war in March). The DK_FinMa chart confirms the bearish trend (price is below all three MAs in a steep downtrend from January highs). The current bar is a bullish recovery candle at the lower Bollinger Band with stochastic turning up. For Week 17, NFP is the primary scheduled catalyst. A weak employment print is the cleanest bullish trigger for Gold (it would push out September hike expectations, soften the Dollar, and give Gold room to recover toward the 4,264 resistance). A strong NFP extends the bearish trend. Resistance at 4,264 / 4,481. Support at 3,884 / 3,682.
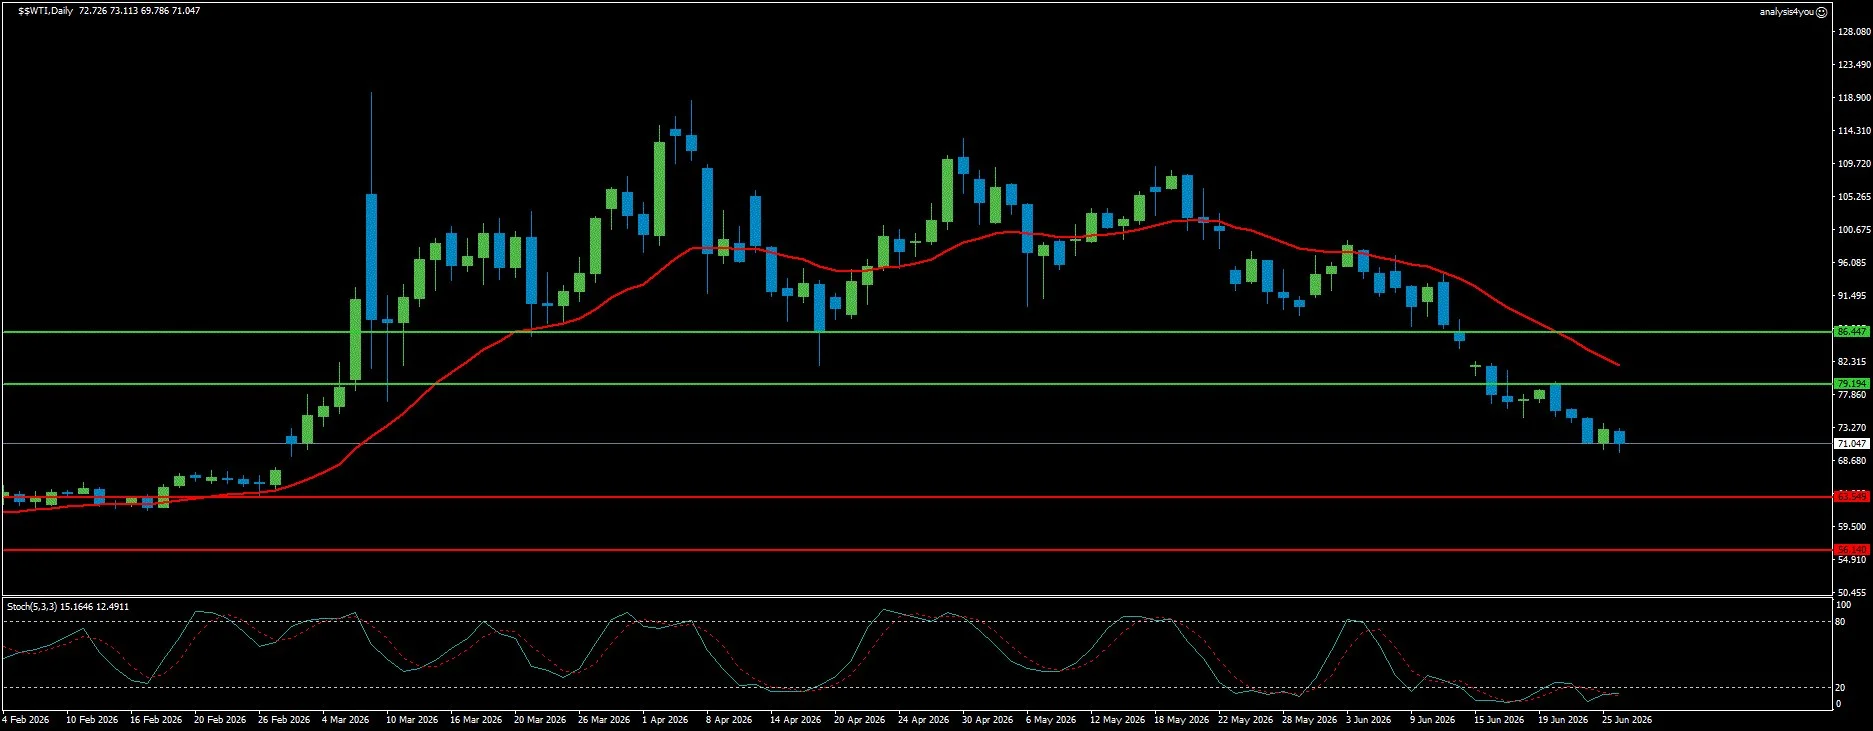
WTI Crude Oil: Third Consecutive Weekly Loss, Weekend Tanker Attacks Create Binary Setup (71.05)
Current Trend: Highly Volatile
Resistance: 79.19 | 86.45
Support: 63.55 | 56.14
WTI Crude Oil had its third consecutive week of losses, closing near 71 dollars per barrel (representing an extraordinary round trip from pre-war levels near 65 to 70, all the way to above 115 at the war’s peak, and back again). Oil has now lost more than 20% month-to-date in June, with the market pricing in full normalization of Hormuz supply flows following the MOU. That assumption was shattered over the June 26 to 27 weekend. Iran’s attack on the EverLovely, the US retaliatory strikes, Iran’s destruction of the Kiu tanker with over two million barrels of crude aboard, and the second round of US strikes on Saturday have fundamentally changed the supply risk calculus. Transit volumes through the Strait (which had recovered to 12.5 million barrels per day from the pre-closure level of 21 million) are now at risk of deteriorating again. Commerzbank warned that the market was overly optimistic about supply normalization, and that if transit volumes do not increase significantly, oil could rebound sharply. Citi has a medium-term target of 60 to 65 dollars per barrel by Q1 2027 (but that thesis assumed a functioning MOU).
For Week 17, WTI is the most event-driven instrument in the portfolio. The Monday open will be the first test of how markets price the weekend escalation. A significant spike higher (back toward 79 resistance) is plausible if tanker traffic data shows disruption. If Washington successfully contains the narrative and transit resumes, the downtrend can extend toward 63.55 support. Resistance at 79.19 / 86.45. Support at 63.55 / 56.14.
Crypto
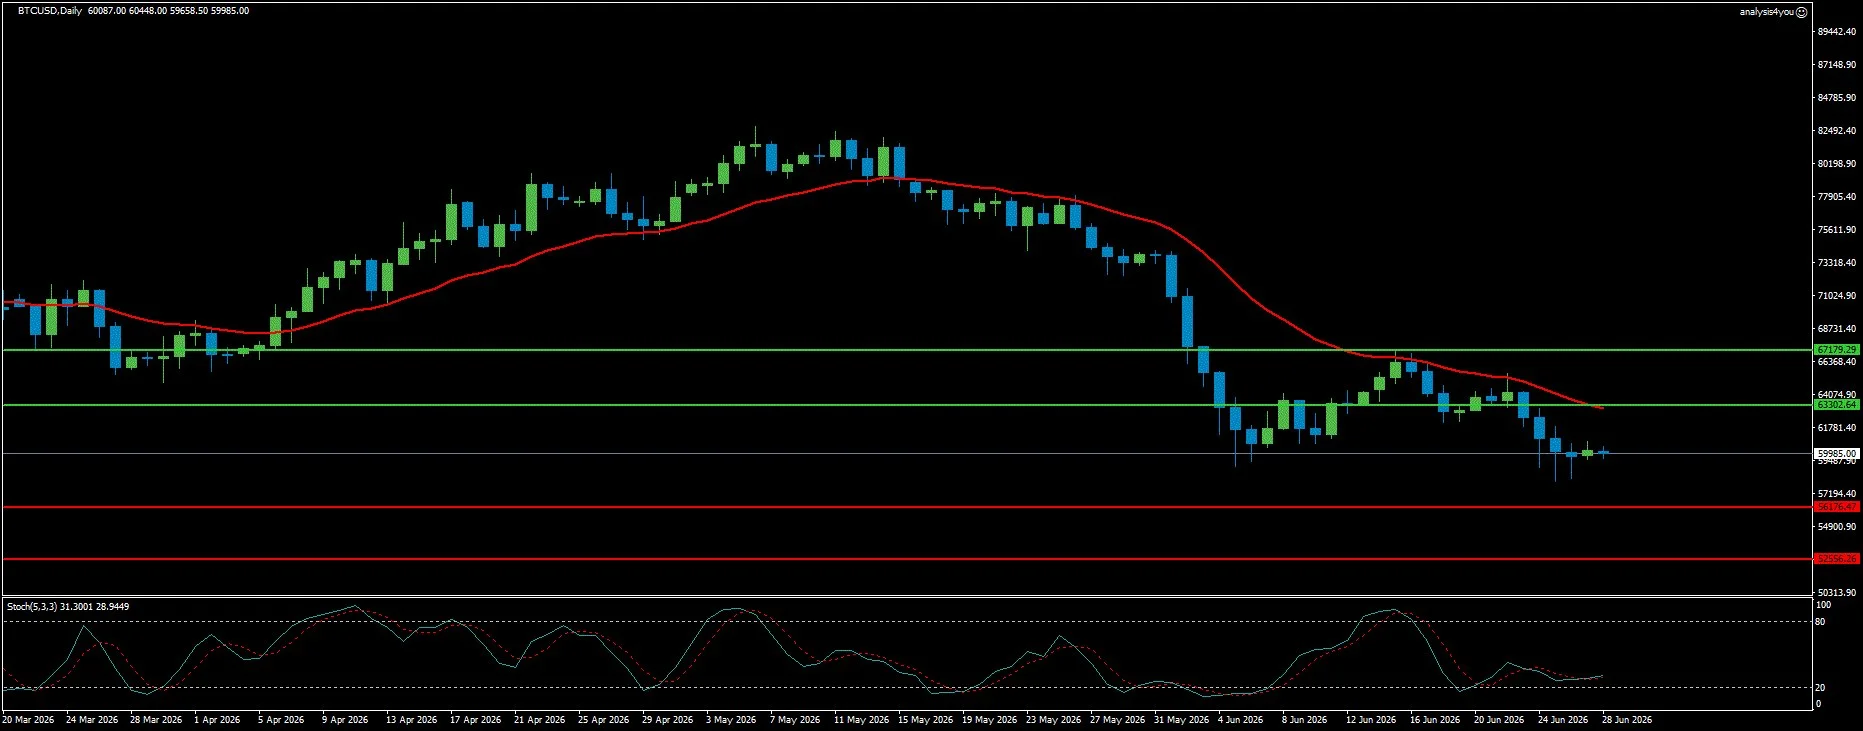
Bitcoin: 20-Month Low at 58,115, Seventh Consecutive Week of ETF Outflows (59,985)
Current Trend: Bearish
Resistance: 63,302 | 67,179
Support: 56,176 | 52,556
Bitcoin hit a 20-month low of 58,115 during the week before recovering slightly to close near 59,985 (still below the psychologically critical 60,000 level). This is the seventh consecutive week of spot ETF outflows, with net withdrawals of 1.35 billion dollars recorded through Thursday. June is on track to be the worst month for Bitcoin ETF flows since the products launched in early 2024, with over 4 billion dollars in net redemptions for the month. The macroeconomic headwinds are identical to those weighing on all risk assets (the Warsh hawkish repricing, elevated Treasury yields, and a strong Dollar all reduce appetite for non-yielding speculative assets). The week added geopolitical pressure to the macro pressure: IRGC attacks on commercial vessels reignited Middle East uncertainty, which historically weighs on risk-sensitive assets including crypto. The broader tech sell-off also dragged Bitcoin lower.
On-chain, the weekly chart now shows price action resembling the late 2021 to 2022 bear market. If the current correction mirrors the 2021 to 2022 pattern from the October 2025 high of 126,199, a 77% correction would imply a trough near 28,300 before the next cycle begins. The DK_FinMa chart confirms the bearish structure. Bitcoin is below all three MAs, which are declining steeply. The current bar is at the lower Bollinger Band and is bearish. Stochastic is turning up from oversold (a weak bounce is possible but lacks fundamental backing). The 63,302 resistance is the first ceiling. Below, 56,176 is the key support, with 52,556 the deeper structural level. Resistance at 63,302 / 67,179. Support at 56,176 / 52,556.
Key Events (June 29 – July 3, 2026)
Monday, June 29: Markets open processing the weekend tanker attack escalation. WTI direction Monday is the leading indicator for everything else. ECB Forum in Sintra begins.
Tuesday, June 30: JOLTS Job Openings. Conference Board Consumer Confidence Index for June. Month-end and quarter-end rebalancing flows add directional uncertainty.
Wednesday, July 1: ECB Forum Sintra panel with Warsh, Lagarde, Bailey, and Macklem (THE WEEK’S MOST CONSEQUENTIAL SCHEDULED EVENT). Eurozone preliminary June CPI (expected to slow to around 3.0% YoY from 3.2%). ISM Manufacturing PMI with critical Prices Paid subindex. ADP Employment.
Thursday, July 2: US June Nonfarm Payrolls (THE WEEK’S DEFINING DATA RELEASE). Released at 8:30 AM ET. Three-month NFP average stands at 188,000. Market consensus expects June payrolls around 130,000. US markets close early for Independence Day Eve.
Friday, July 3: US markets closed (Independence Day).
Week Ahead Outlook
Week 17 is a data tsunami compressed into four trading days with holiday-shortened sessions, month-end and quarter-end rebalancing flows, and a geopolitical situation in active flux.
Base Case (approximately 40%): Elevated volatility with no clear directional conviction until Thursday’s NFP. The Dollar consolidates near 101, supported by both the rate-hike narrative and geopolitical safe-haven demand. EUR/USD and GBP/USD attempt shallow recovery bounces from oversold conditions but remain capped below their respective resistance levels. Gold stabilizes near 4,000 to 4,100 in a tug-of-war between safe-haven demand from the Middle East and Dollar strength. WTI opens sharply higher Monday but struggles to sustain gains above 79 as Washington works to keep the narrative contained. The S&P 500 consolidates in the 7,174 to 7,484 range. Bitcoin remains under 63,302.
Bull Case for Risk Assets (approximately 25%): A materially weak NFP print on Thursday (below 100,000) is the most powerful available catalyst for a broad risk-asset recovery. September hike expectations are pushed back sharply. The Dollar sells off. EUR/USD and GBP/USD recover toward their upper resistance levels. Gold stages a meaningful bounce toward 4,264. Equities rebound toward 7,484. A soft Eurozone CPI reading on Wednesday could set up this scenario.
Bear Case: Hormuz Closure Confirmed (approximately 35%): If Iran formally closes the Strait of Hormuz and tanker transit is confirmed disrupted, the geopolitical risk premium returns with force. WTI spikes toward 86 and potentially higher, reviving the stagflation narrative. Equities sell off sharply. Gold rises on safe-haven demand. The Dollar strengthens on both safe-haven and rate-hawkishness grounds simultaneously. EUR/USD and GBP/USD break below their current support levels. Bitcoin sells off further on broad risk-off flows.
Bottom Line: Seventeen weeks into the Iran war, the market faces its most volatile weekly setup since early March. The MOU that markets had treated as a resolution has been shattered by Iranian tanker attacks over the weekend. The Warsh Fed has reset rate expectations firmly higher. The Sintra panel on Wednesday (where Warsh speaks alongside Lagarde and Bailey simultaneously) is the most consequential scheduled event of the week and could reset the entire directional bias in a single session. NFP Thursday is the week’s defining data point. Traders should size positions conservatively and treat stops as non-negotiable in a week where geopolitical headlines can move oil 5% in a single session.

