Fed, ECB, BoE Decisions Collide: Powell’s Final Press Conference, Mag 7 Earnings
Market Sentiment Overview
The week of April 27 to May 1 is without question the most consequential single week of the entire two-month Iran war. Markets face a collision of macro forces: the Federal Reserve’s April 28-29 monetary policy decision (Powell’s final press conference as FOMC Chair), the ECB’s April 30 decision, the BoE’s April 30 decision, US Q1 GDP, March PCE, US ISM Manufacturing PMI, the Magnificent Seven earnings cluster (Alphabet, Microsoft, Meta, Amazon and Apple all reporting), and the ongoing geopolitical binary from weekend Pakistan talks. The diplomatic picture deteriorated sharply during the prior week. Tehran declared the ceasefire broken mid-week after continued US naval blockade operations. Iran planted mines in the Strait of Hormuz while US forces attacked Iranian oil vessels. The Strait remains effectively frozen to normal commercial traffic. Brent crude recovered to approximately $105 per barrel by the weekend (a 17% weekly gain). WTI closed at $97.61, approaching the psychological $100 level. On Friday, Pakistan announced a serious potential breakthrough ahead of the weekend. US envoys Witkoff and Kushner and Iran’s Foreign Minister Araghchi were both heading to Islamabad for discussions.
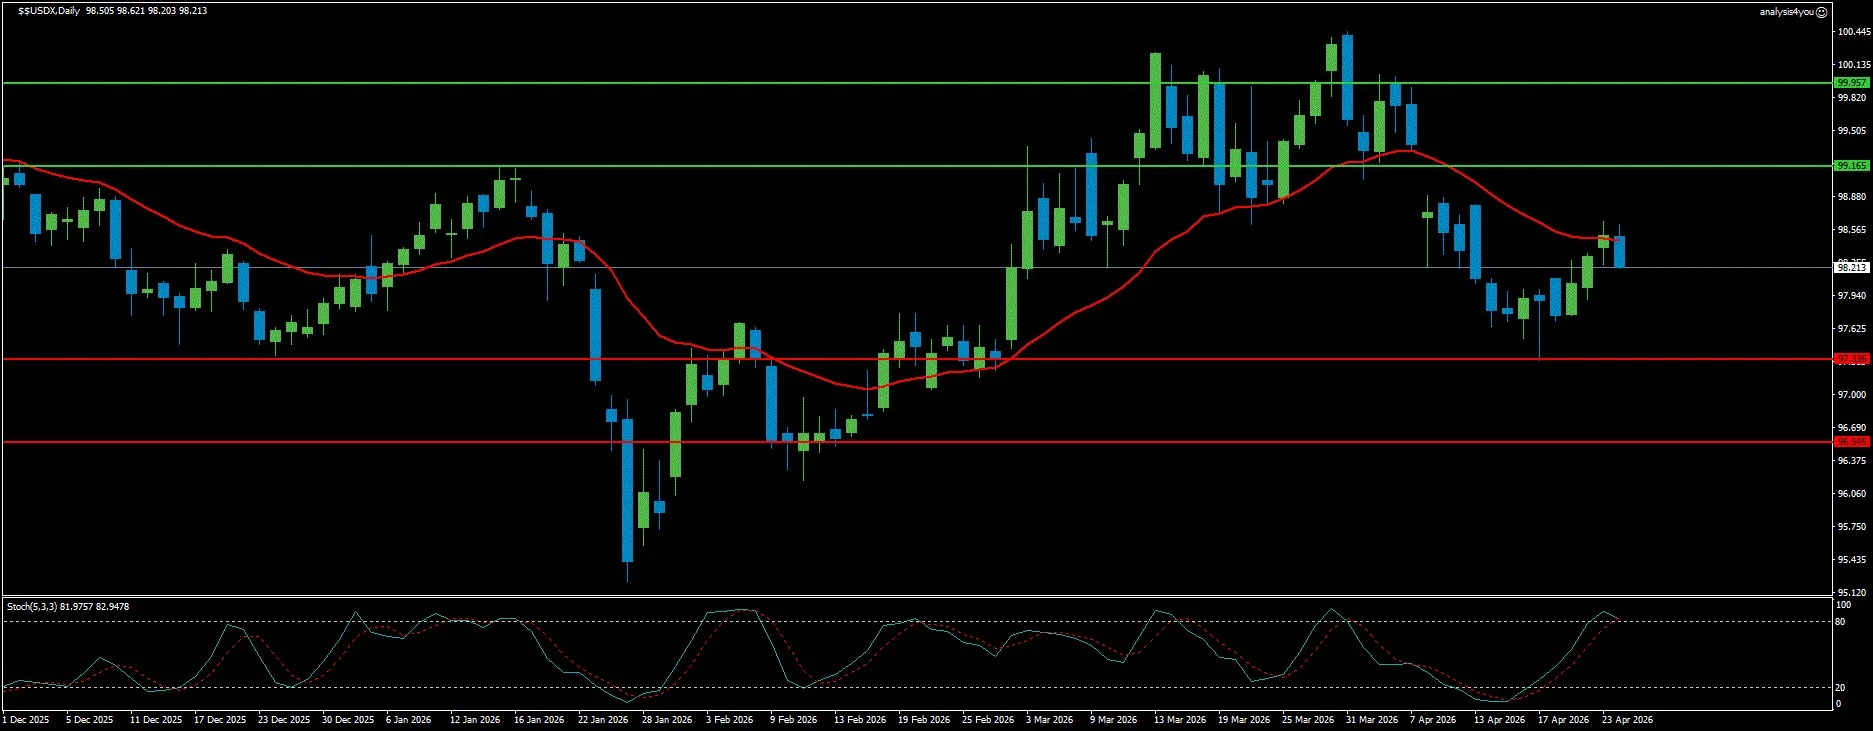
USD Index: Dead-Cat Bounce Within a Bearish Structure (98.21)
Current Trend: Bearish
Resistance: 99.17 | 99.96
Support: 97.34 | 96.54
The US Dollar staged a modest recovery, bouncing from 97.04 to 98.21. The recovery came from USD safe-haven demand on Iran re-escalation and the Warsh Senate hearing that introduced fresh uncertainty around monetary policy leadership. But the technical structure reveals this as a bounce within a downtrend (USDX remains below all three major moving averages). Warsh defended Fed independence while suggesting a smaller balance sheet would allow lower rates. Trump’s public statement that he expects Warsh to cut rates right away added political pressure. Markets are treating this as an institutional risk, paralleling the 1970s framework: when a Fed chair loyal to the White House eased during an oil shock, the result was sharper price rises, entrenched inflation, and a collapsing Dollar. The week ahead is defined by Powell’s final press conference on Wednesday. The Fed is universally expected to hold at 3.5% to 3.75%. US Q1 GDP on Wednesday and March PCE on Thursday provide critical data. Technically, USDX bounced to 98.21 but remains below converging 100/200-day SMAs at approximately 98.50. The Stochastic at 81.97/82.95 is overbought while in a downtrend (classic dead-cat bounce). Resistance at 99.17 is the immediate ceiling. On the downside, 97.34 is the first support, with 96.54 the deeper floor.
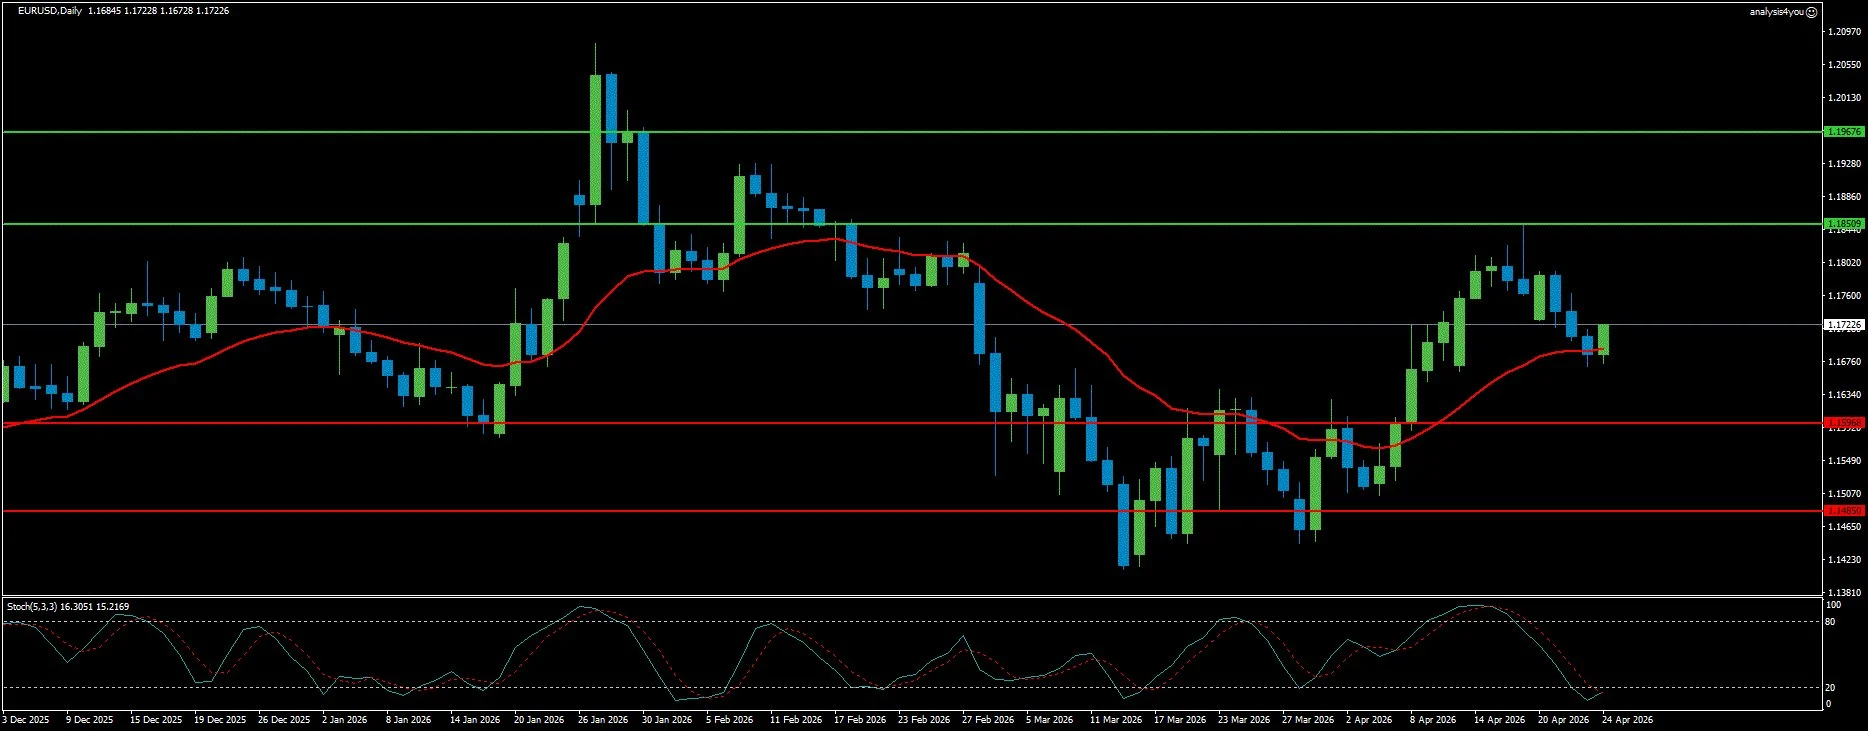
EUR/USD: Oversold Reset Provides Strongest Bullish Setup (1.1723)
Current Trend: Bullish
Resistance: 1.1851 | 1.1968
Support: 1.1597 | 1.1485
EUR/USD ended its three-week winning streak and settled below 1.1700 (pulled back by USD recovery on Warsh uncertainty and oil re-escalation). But the pullback has reset the Stochastic to its most oversold reading across all seven instruments (16.31/15.22) while price remains above all three major moving averages. This combination (deeply oversold momentum within a structurally bullish MA configuration) is the strongest technical setup for bullish continuation of all seven instruments this week. The Eurozone Composite PMI declined to 48.6 from 50.7 (the first contraction reading). Germany’s IFO Current Assessment declined to 85.4 from 86.7. Danske forecasts the preliminary April HICP at 2.8% YoY headline (released Thursday just hours before the ECB decision). ECB officials are broadly aligned on the need to act if inflation continues to escalate. Lagarde is expected to lean hawkish. The week’s EUR catalysts: Eurozone Q1 GDP on Wednesday, April HICP preliminary on Thursday, and ECB decision on Thursday. Technically, EUR/USD pulls back to 1.1723, resting on the 100-day SMA at 1.1708 and 200-day SMA at 1.1677. The Stochastic at 16.31/15.22 is at its most oversold reading across all instruments, with Stochastic in an uptrend. Resistance at 1.1851 is the first meaningful ceiling. On the downside, converging SMA support at 1.1670 to 1.1708 is the critical floor.
Stocks
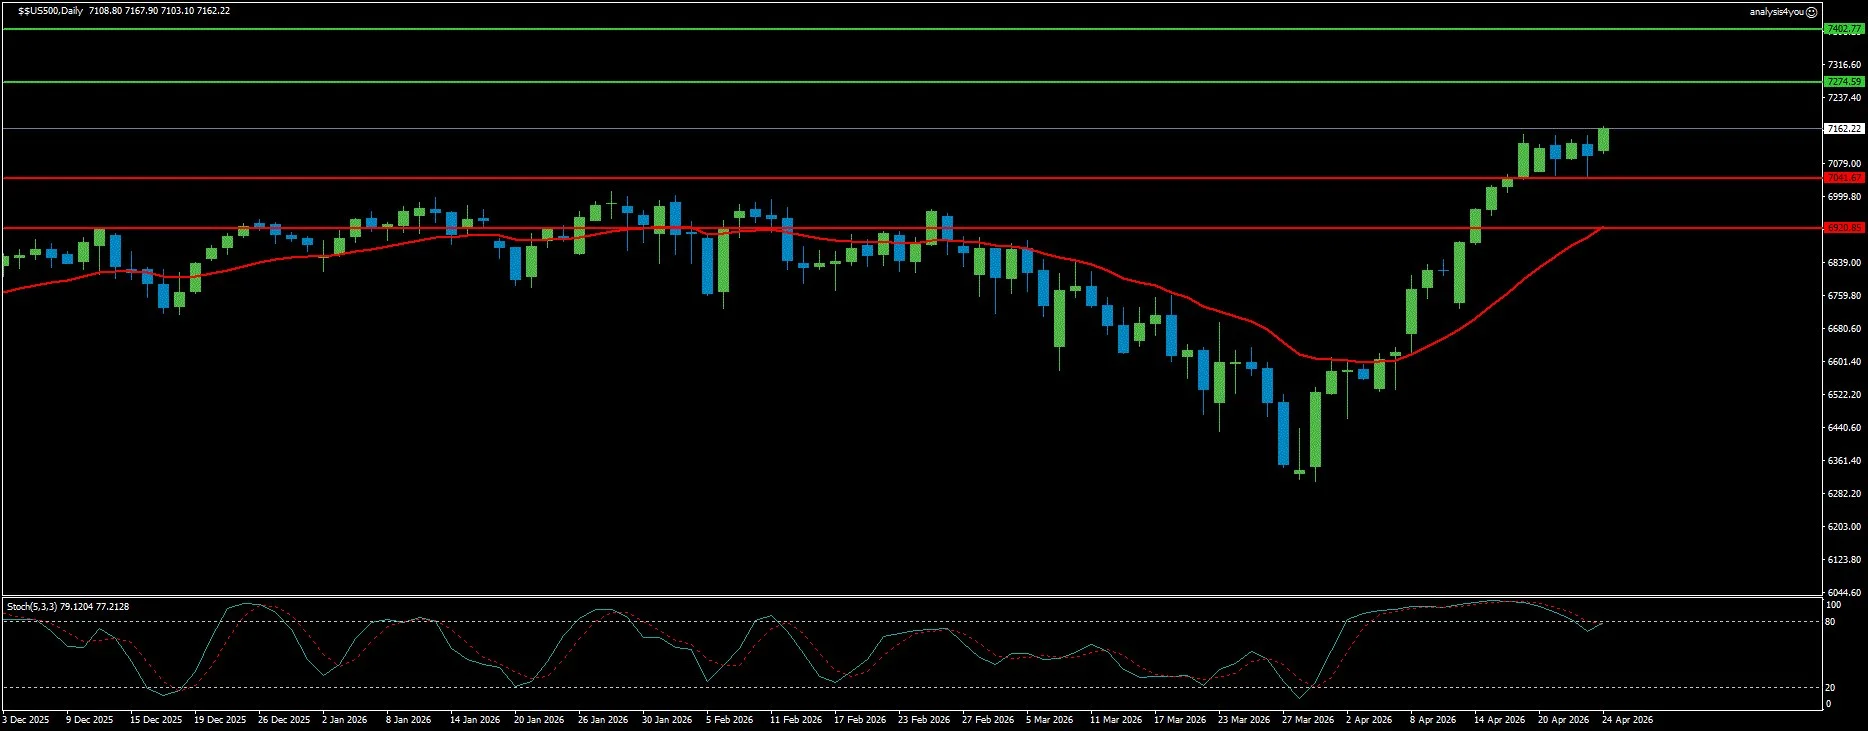
S&P 500: ATH Holds, Magnificent Seven Is the Defining Test (7,162)
Current Trend: Bullish
Resistance: 7,275 | 7,403
Support: 7,042 | 6,921
The S&P 500 posted its fourth consecutive week of gains and extended its all-time high, closing at 7,162. The Stochastic has decompressed from the extreme 96/97 readings of two weeks ago to a more measured 79.12/77.21 (still overbought but with momentum moderating while price holds near highs). Nearly 25% of S&P 500 companies have reported Q1 2026 results, with approximately 80% beating estimates. Blended earnings growth stands at 12.9% YoY. But the real test arrives this week. Over 200 S&P 500 companies (approximately 42% of the index) report, including five of the seven Magnificent Seven: Alphabet and Microsoft Tuesday, Meta on Wednesday, Amazon and Apple Thursday. The macro overlay adds complexity. US Q1 GDP Wednesday could show meaningful growth deterioration. March PCE Thursday provides the Fed’s preferred inflation read. ISM Manufacturing Friday captures April activity with full war overlap. Technically, the S&P 500 is at 7,162, consolidating above the January ATH zone. The Stochastic at 79.12/77.21 is overbought with an uptrend. The Stochastic decompression from 96/97 to 79 while price held near highs is a positive divergence suggesting momentum has been absorbed without price damage. Resistance at 7,275 is the immediate target. On the downside, 7,042 (just above psychological 7,000) is the critical floor.
Commodities
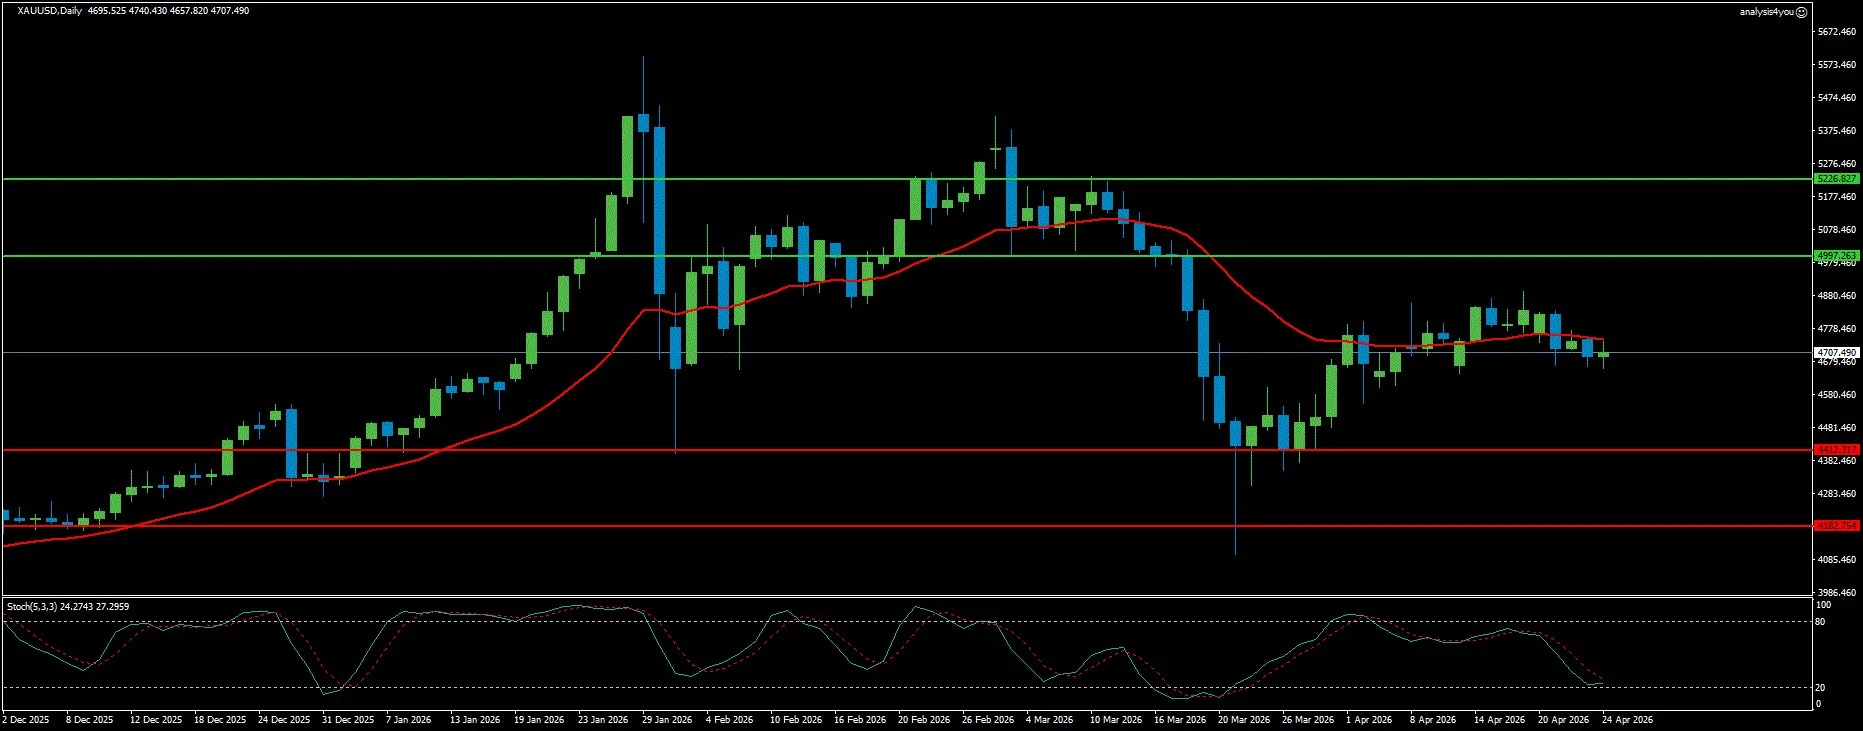
Gold: Oversold Below Key Resistance, Medium-Term Outlook Intact (4,707)
Current Trend: Neutral to Cautiously Bullish
Resistance: 4,997 | 5,227
Support: 4,412 | 4,183
Gold ended the prior week in negative territory, pulling back from $4,832 to $4,707 (confirming that the $4,900 level is a hard resistance cap). Current global circumstances should be highly favorable for Gold, but the war’s mechanism is working against it through rising real bond yields. The oil spike triggered an inflation surge, which triggered higher rate expectations, which drove real yields higher, which raised the opportunity cost of holding non-yielding Gold. The medium-to-long-term outlook remains constructive. Diminishing Fed rate hike bets have led to a revival in rate cut expectations at 45% to 50% probability by year-end. A potential end of hostilities would lower oil prices and ease inflation concerns. The Stochastic reset to deeply oversold (24.27/27.96) while Gold remains above the 200-day SMA provides the technical setup for a bounce this week. PCE Thursday is the primary Gold catalyst. Technically, Gold is at $4,707, below the 20-day SMA and 50-day SMA, but above the 200-day SMA. The Stochastic at 24.27/27.96 is deeply oversold with Stochastic in an uptrend (the second-strongest bounce setup across all instruments after EUR/USD). The $4,900 level remains the primary resistance cap. A decisive break above $4,900 opens $4,997 and then $5,000.
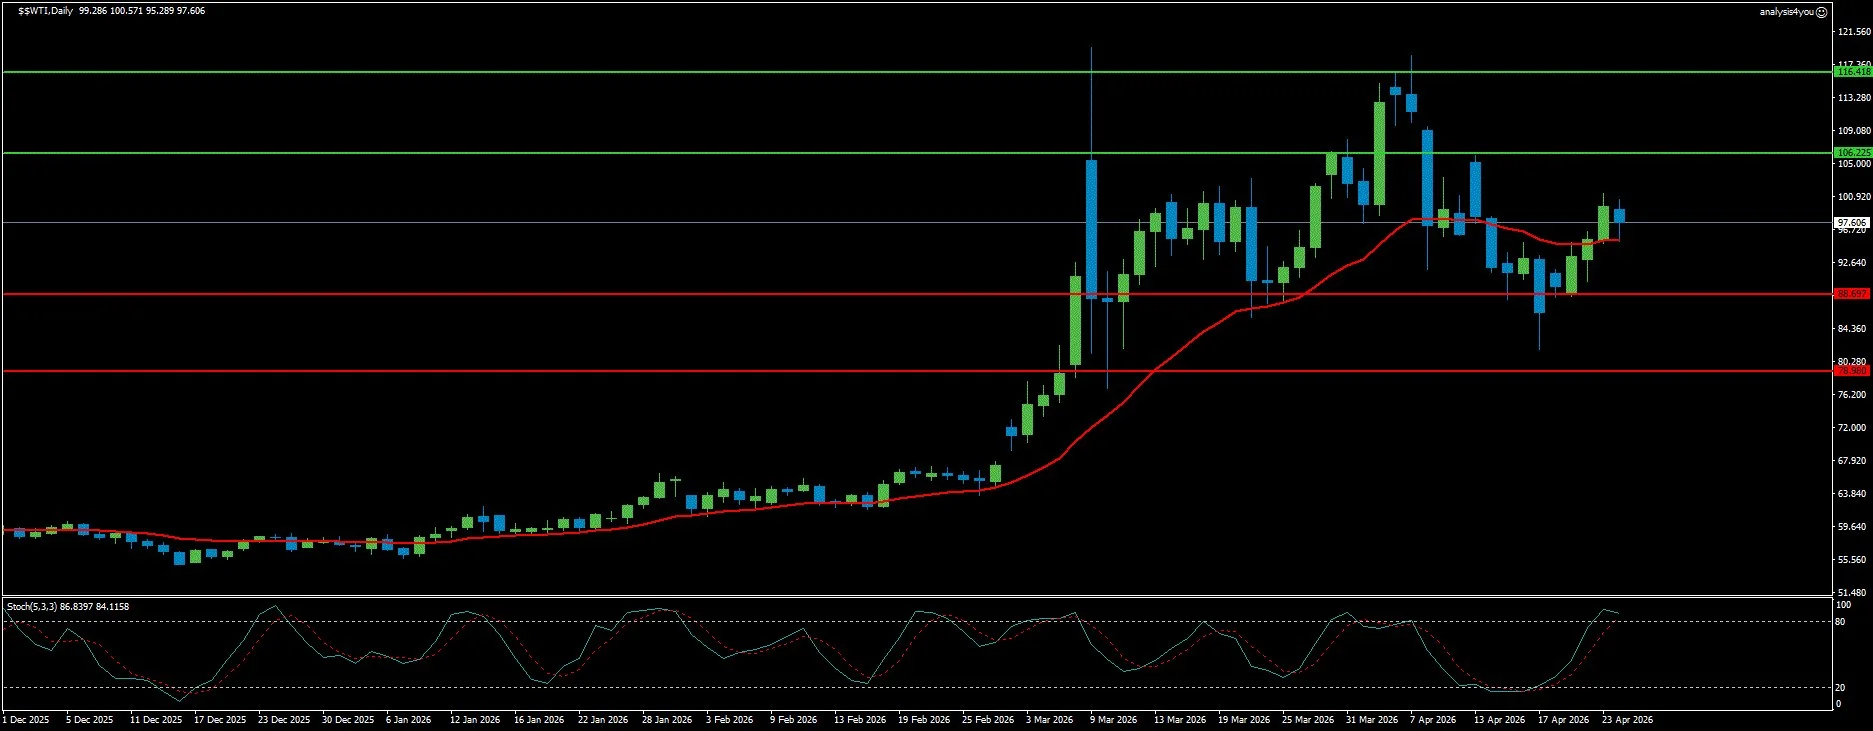
WTI Crude Oil: Re-escalation Bounce Fading at Overbought Extremes (97.61)
Current Trend: Neutral
Resistance: 106.22 | 116.42
Support: 88.70 | 78.98
WTI crude oil staged a dramatic reversal, recovering from $86.46 Hormuz-crash lows back to $97.61 (a gain of over 51%) as Iran’s re-escalation reversed the supply relief pricing. The Strait of Hormuz remains effectively frozen. Iran is planting mines. US forces are attacking Iranian oil vessels. Tehran declared the ceasefire broken. Brent recovered to approximately $105 per barrel for a 17% weekly gain. WTI is operating within a rotational regime under logistical pressure, with the $99.00 area acting as the operational pivot. The Stochastic at 86.84/84.12 is overbought while in a downtrend (the same bearish divergence as USDX). The re-escalation bounce from $86 to $97 has brought WTI back to the upper end of the rotational range near $99.00. Pakistan’s report of a potential breakthrough is the diplomatic signal that could cap oil’s upside. Technically, WTI is at $97.61. The Stochastic at 86.84/84.12 is overbought while in a downtrend. Current price sits right at the boundary between neutral and pressure zones. Resistance at $106.22 is the immediate ceiling. On the downside, $88.70 is the first meaningful support (a break below suggests de-escalation is being priced again).
Crypto
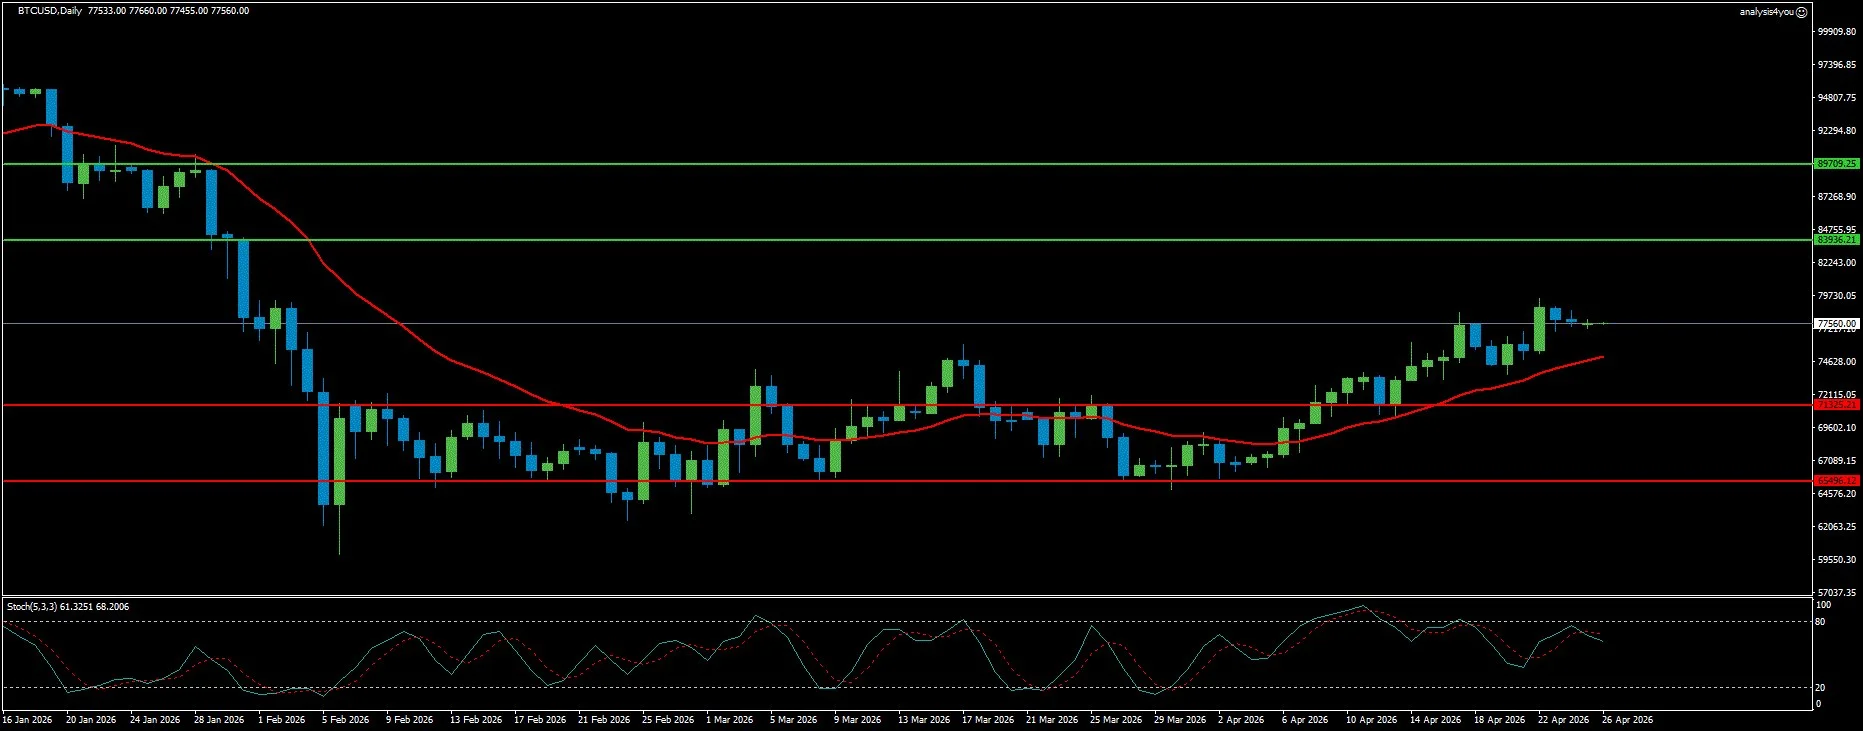
Bitcoin: Market Structure Bullish, $80,000 Is the Defining Battle (77,560)
Current Trend: Bullish
Resistance: 83,936 | 89,709
Support: 71,325 | 65,496
Bitcoin extended its advance for a fourth consecutive week, rising from $75,325 to $77,560 (bringing the weekly high to $79,472, the highest level since early February). BTC’s move back above the True Market Mean marks an important shift in market structure. The institutional demand picture was the strongest of the entire war period. Spot Bitcoin ETFs recorded $809.25 million in net inflows through Thursday (the fourth consecutive week of positive flows and the largest single-week inflow since the war began). Strategy purchased another 34,164 BTC for $2.54 billion (the most aggressive single purchase of the war period), bringing total holdings to 815,061 BTC. The $80,000 psychological level is the week’s defining technical battle. A sustained push through $80,000 depends on continued spot absorption and consistent ETF demand; failure to hold current levels could see downside moves accelerate given relatively thin liquidity. Technically, BTC is at $77,560, well above the 50-day EMA at approximately $72,790. The Stochastic at 61.33/68.00 is in the overbought zone while in a downtrend. Critical resistance zone: $79,472 to $80,000. Immediate resistance at $83,936 (200-day EMA zone), then $89,709. On the downside, $75,680 is the first support, with $71,325 the deeper floor.
Key Events (April 27 – May 1, 2026)
Weekend (April 26-27): US-Iran talks in Pakistan. Pakistan described a serious potential breakthrough.
Monday, April 27: Markets digest weekend Pakistan talks. Germany April CPI.
Tuesday, April 28: Alphabet and Microsoft Q1 earnings. US CB Consumer Confidence. BoJ rate decision.
Wednesday, April 29: FOMC rate decision (hold at 3.5% to 3.75% expected). Powell’s final press conference. US Q1 GDP. Meta Q1 earnings. BoC rate decision. Eurozone Q1 GDP.
Thursday, April 30: ECB rate decision (hold expected with hawkish message). Preliminary Eurozone April HICP. March PCE. Amazon and Apple Q1 earnings. BoE rate decision. US Initial Jobless Claims.
Friday, May 1: US ISM Manufacturing PMI April. Canada GDP.
Week Ahead Outlook
The week of April 27 to May 1 is the most information dense week of the entire war period. Five central bank decisions, Magnificent Seven earnings, Q1 GDP, PCE, ISM Manufacturing, and potential diplomatic developments all collide in five trading days.
Scenario 1: Diplomatic Progress + Strong Earnings + Dovish-Enough Central Banks (approximately 30%): Pakistan talks produce a framework. Oil eases toward $90. Mag 7 earnings beat. Q1 GDP at 1.0% to 1.5%. PCE at 2.8% to 3.0%. USDX resumes decline toward 97.34. EUR/USD breaks 1.1851 targeting 1.1968. GBP/USD breaks 1.3600 targeting 1.3695. S&P 500 breaks 7,275 targeting 7,403. Gold bounces toward $4,865 to $4,900. WTI falls toward $88 to $91. BTC breaks $80,000 targeting $83,936.
Scenario 2: Diplomatic Stalemate + Mixed Earnings + Cautious Central Banks (approximately 45%): Pakistan talks produce no breakthrough but no breakdown. WTI holds $92 to $100. Mag 7 earnings mixed. Q1 GDP at 0.5% to 1.0%. PCE hot at 3.2%+. Fed holds firmly hawkish. USDX consolidates 97.34 to 99.17. EUR/USD holds 1.1597 to 1.1851 range. GBP/USD holds 1.3349 to 1.3600. S&P 500 consolidates 7,042 to 7,275. Gold holds $4,412 to $4,900 range. WTI $92 to $100. BTC $75,680 to $80,000.
Scenario 3: Re-escalation + Earnings Shock + Hawkish Surprise (approximately 25%): Pakistan talks collapse. WTI spikes above $106. Mag 7 delivers major guidance miss. Q1 GDP surprises below 0%. PCE hot above 3.5%. USDX spikes toward 99.17 and 99.96. EUR/USD crashes below 1.1597. GBP/USD falls below 1.3349. S&P 500 breaks below 7,042. BTC flash-crashes below $75,680.
Bottom line: Two months into the Iran war, the market arrives at its most information-dense week yet. The two instruments with the strongest technical setups are EUR/USD (oversold Stochastic 16/15 above all three MAs) and Gold (oversold Stochastic 24/27). The two instruments with the most caution-warning signals are WTI (overbought in a downtrend) and BTC (overbought in a downtrend approaching $80,000). The S&P 500’s Stochastic decompression from 96 to 79 while holding ATH suggests the market has digested recent gains rather than exhausted them.

