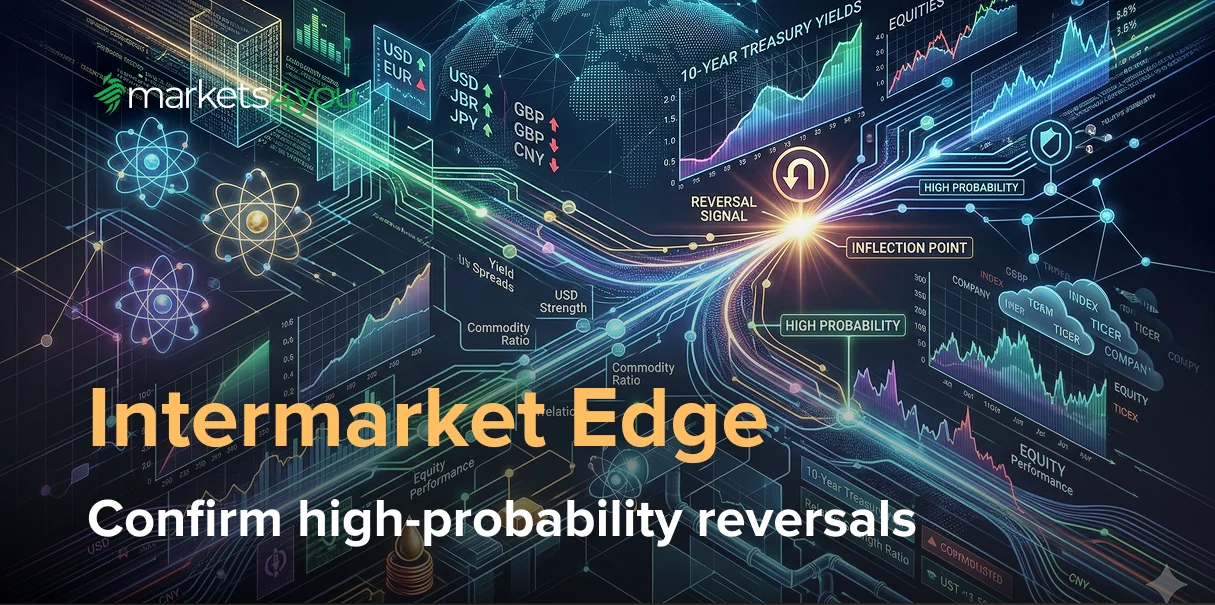
Using Intermarket Analysis to Confirm High Probability Price Reversals
Markets rarely move in isolation. A reversal in one asset class often reflects broader capital reallocation across bonds, equities, commodities, and currencies. Traders relying solely on price structure frequently encounter failed breakouts and premature entries because market behaviour is interpreted without macro confirmation.
This limitation explains why intermarket analysis has become essential for modern traders. By tracking capital flows across interconnected markets, traders can distinguish between price action supported by macro forces and moves driven primarily by positioning or short-term sentiment.
Understanding what is intermarket analysis means recognising that market turning points are typically multi-asset events. Liquidity tightening, policy expectations, inflation repricing, and shifts in global risk appetite propagate across asset classes in identifiable sequences, creating leading and lagging relationships useful for reversal confirmation.
For traders engaged in currency trading and intermarket analysis, this perspective is especially valuable. Exchange rates respond directly to interest rate differentials, commodity exposure, and cross-border capital flows. As a result, forex intermarket analysis often reveals trend exhaustion earlier than price-based FX indicators alone.
This article demonstrates how trading intermarket analysis can confirm high-probability price reversals through bond yields, commodity behaviour, equity breadth, and structural macro relationships.
The Core Mechanics of Intermarket Confluence and Asset Correlations
Financial markets function as a global liquidity network where capital rotates between asset classes based on growth expectations, policy direction, and investor risk appetite, reinforcing principles outlined in basics of portfolio diversification. These interactions form the foundation of intermarket analysis and investing, as price movements in one market frequently reflect positioning decisions made elsewhere.
An Asset Class Correlation Matrix provides a useful starting point for mapping relationships across equities, bonds, commodities, and currencies. However, correlations are dynamic. Cross-asset relationships evolve due to covariance drift, policy regime changes, and structural macro transitions, requiring interpretation within prevailing liquidity cycles.
The Risk-On/Risk-Off (RORO) framework helps contextualise these cycles. Expansionary environments typically support equities and growth-sensitive commodities, while tightening cycles encourage rotation into bonds and defensive currencies.
Reversal opportunities often emerge during intermarket divergence, when price action in one asset class fails to align with broader risk conditions. Equities may continue rising even as credit spreads widen or bond volatility increases, signalling price action exhaustion and rising reversal probability.
Another critical concept is order flow sequencing, describing how macro information propagates across markets. Policy expectations frequently appear first in rate futures and bond markets, followed by FX adjustments and equity repricing. This creates a measurable leading indicator lag that traders can use to anticipate turning points.
In practice, intermarket technical analysis acts as a filter. Reversal setups gain credibility when supported by cross-asset confirmation, while conflicting signals justify reduced exposure or delayed execution.
Decoding Bond Yields as a Leading Indicator for Equity Reversals
Bond markets provide early macro insight due to their sensitivity to inflation expectations and policy shifts. Movements in sovereign yields frequently precede equity reversals, making them central to forex trading using intermarket analysis.
The behaviour of 10-Year Treasury Yields reflects long-term growth expectations and the discount rate applied to risk assets. Rising yields driven by inflation or tightening policy can compress equity valuations, while declining yields may signal deteriorating growth conditions.
A widely monitored signal is yield curve inversion, where short-term rates exceed long-term yields. Historically associated with tightening financial conditions and recession risk, inversions often precede heightened equity volatility and reversal risk.
Inflation-adjusted measures derived from TIPS provide deeper insight. Analysing Real Interest Rate Spreads reveals the true policy stance and its implications for asset valuations. Rising real rates can pressure growth equities, whereas declining real rates may support risk appetite.
Bond signals gain further relevance when combined with equity-risk premium and liquidity cycle analysis, which capture relative asset attractiveness. Divergence between yield behaviour and equity price action often represents an early warning signal rather than a contradiction.
For FX markets, yield differentials drive currency flows. Changes in real yield spreads frequently reshape FX trends before broader sentiment shifts, reinforcing the importance of bond market analysis within currency trading intermarket analysis frameworks.
Commodity Price Action as a Catalyst for Currency Trend Exhaustion
Commodity markets play a central role in intermarket frameworks because they reflect real economic demand, inflation pressure, and supply constraints. Unlike equities, which can be heavily influenced by liquidity and sentiment, commodities are closely tied to production and consumption cycles. This makes them valuable leading indicators for identifying macro turning points and confirming reversal risk across asset classes.
Broad commodity behaviour can be monitored through the CRB Commodity Index, which provides a diversified view of global demand conditions. A sustained decline in the index while equities remain elevated often signals weakening growth expectations beneath the surface, increasing the probability of reversal in risk assets.
Targeted commodity relationships offer more actionable insight. One widely observed example is the WTI Crude-CAD correlation. As a major oil exporter, Canada’s currency frequently responds to oil price dynamics through trade balance expectations and growth outlook. When CAD strengthens despite declining oil prices, the divergence often signals trend exhaustion and potential currency reversal.
Another important proxy is the Copper-Gold Ratio, where copper reflects industrial demand while gold represents defensive positioning. A declining ratio may indicate deteriorating growth expectations even when equity indices remain stable. This divergence can precede equity and currency reversals as macro sentiment gradually shifts.
Commodity signals help identify price action exhaustion masked by momentum. A currency trend unsupported by its underlying commodity driver often becomes vulnerable to reversal, making commodities essential for currency trading intermarket analysis.
Commodity behaviour also interacts with broader macro frameworks such as liquidity cycle analysis and inflation expectations. Rising commodity prices can tighten financial conditions through inflation transmission, while commodity weakness may reflect slowing demand and declining growth momentum, often foreshadowing broader risk-off transitions.
Identifying Divergences Between Small Cap Indices and Large Cap Benchmarks
Equity reversals rarely begin with abrupt index declines. Instead, they typically emerge through deterioration in market breadth, where a narrow group of large-cap stocks sustains index performance while broader participation weakens.
A widely used breadth indicator is the comparison between S&P 500 vs Russell 2000. Analysing a Relative Strength Ratio between these indices helps determine whether capital is rotating toward defensive mega-cap exposure or risk-sensitive small-cap equities.
Persistent large-cap outperformance alongside small-cap weakness often signals tightening liquidity and declining risk appetite. Institutional investors may gradually reduce exposure to higher-beta segments while maintaining index-level positioning, creating an illusion of strength that precedes broader market reversal.
Breadth divergence becomes more meaningful when combined with widening high-yield credit spreads, which reflect rising default risk perception and tightening financial conditions. Together, these indicators signal defensive positioning beneath stable headline indices.
Another factor influencing breadth dynamics is demand for negative skewness protection, where institutional investors hedge against tail risks. This behaviour can suppress volatility temporarily while masking fragility, increasing the likelihood of sharper reversals once liquidity conditions deteriorate.
For traders applying intermarket analysis and investing, breadth divergence bridges equity technical signals and macro risk sentiment. When small-cap weakness aligns with credit stress and commodity softness, the probability of coordinated multi-asset reversal increases.
The Dollar Smile and Its Role in Predicting Global Market Inflection Points
Currency markets often provide early signals of global liquidity stress due to their sensitivity to capital flows, rate expectations, and funding dynamics. The Dollar Smile Framework explains how USD strength can emerge during both strong growth and stress environments.
During expansionary phases, USD appreciation reflects yield differentials and capital inflows into US assets. During stress episodes, USD strength signals safe-haven demand and tightening global liquidity. In both scenarios, sustained dollar appreciation can pressure risk assets and increase reversal probability.
A key catalyst is the USD/JPY carry trade unwind, where leveraged positions funded in low-yield currencies are rapidly reduced as volatility rises, a dynamic closely linked to risks discussed in basics of margin trading. This sequence typically involves JPY appreciation, equity weakness, and rising volatility, reinforcing cross-asset reversal risk.
USD movements also reflect monetary policy divergence, where differences in central bank trajectories reshape capital allocation. Because FX markets often react first, USD positioning provides insight into leading indicator lag across asset classes.
For traders applying trading with intermarket analysis, USD strength combined with weakening commodities, breadth deterioration, and tightening credit conditions forms a powerful confluence signalling elevated reversal risk.
Using Real Interest Rate Spreads to Confirm Long Term Structural Pivots
While short-term reversals often emerge from positioning and sentiment shifts, structural pivots are typically driven by changes in policy regimes and real funding conditions. This is why Real Interest Rate Spreads represent a critical element of advanced intermarket analysis.
Real rates capture inflation-adjusted borrowing costs and therefore reflect the true stance of monetary policy. Persistent shifts in real rate differentials between economies reshape capital allocation, currency valuation, and risk asset pricing over extended periods, often preceding structural trend reversals in equities and FX markets.
A structural pivot becomes more credible when several factors align:
- sustained changes in real rate spreads rather than temporary spikes
- confirmation through monetary policy divergence between central banks
- corresponding adjustments in FX valuation and commodity behaviour
For example, rising real rates in one economy relative to peers may attract capital inflows, strengthening its currency while tightening financial conditions globally. This tightening can weigh on equities and commodities, increasing the probability of multi-asset reversal. Conversely, declining real rates may support liquidity expansion and risk appetite across asset classes.
Real rate dynamics also interact with equity-risk premium behaviour. When real rates rise while equity risk premia compress, valuations become increasingly vulnerable to macro shocks, often preceding corrections or consolidation phases.
Real rate dynamics also interact with equity-risk premium behaviour. When real rates rise while equity risk premia compress, valuations become increasingly vulnerable to macro shocks, often preceding corrections or consolidation phases.
From the perspective of intermarket analysis profiting from global market relationships, monitoring real rate spreads helps identify when short-term momentum conflicts with structural macro forces, creating reversal environments characterised by volatility expansion and correlation convergence.
Quantitative Tools for Measuring Intermarket Correlation Strength
While discretionary interpretation of cross-asset relationships is valuable, quantitative tools enhance precision by measuring correlation stability and identifying statistically significant divergence, complementing indicator-based approaches explained in how to use Bollinger Bands for trading.
Rolling correlation matrices provide a foundational approach, helping detect covariance drift and highlighting when traditional relationships weaken. Breakouts occurring during correlation instability often have lower reliability, whereas reversals supported by strengthening correlations tend to exhibit higher probability.
Several quantitative indicators complement intermarket frameworks:
Mean Reversion Z-Score
Identifies statistically stretched relationships likely to revert, helping detect reversal zones across correlated markets.
Anchored VWAP Confluence
Represents institutional average entry levels from significant events. Simultaneous VWAP confluence across assets can increase coordinated reversal probability.
Volume Profile Distribution
Reveals price acceptance and rejection zones. Reversal signals near high-volume nodes across correlated markets often show stronger follow-through.
Delta Divergence
Captures discrepancies between price movement and aggressive order flow, signalling potential exhaustion.
Fractal Reversal Patterns
Recurring structural formations across timeframes can confirm reversal potential when observed across correlated assets.
Together, these tools strengthen trading intermarket analysis by converting qualitative observations into measurable confirmation signals. Many traders compile these indicators into an intermarket analysis cheat sheet for consistent monitoring of cross-asset drivers.
Summary
Financial markets operate as interconnected ecosystems shaped by liquidity flows, policy expectations, and positioning dynamics. Reversals rarely occur in isolation but emerge through coordinated adjustments across asset classes reflecting macro change.
Bond yields frequently act as leading indicators by signalling shifts in growth expectations and monetary policy. Commodity behaviour reveals demand conditions and inflation pressure, while currency markets reflect funding dynamics and capital flows. Equity breadth and credit spreads provide insight into underlying risk appetite beyond headline indices.
By integrating these signals, intermarket analysis transforms reversal trading from reactive chart interpretation into contextual decision-making. While uncertainty remains inherent to markets, this framework improves trade selection by filtering false signals and strengthening setups supported by cross-asset confirmation.
For traders applying forex trading using intermarket analysis or broader multi-asset strategies, the approach offers a repeatable method for identifying high-probability reversal environments and managing risk more effectively.
FAQs
1. How do regime shifts impact the reliability of bond-equity correlation?
Regime shifts change dominant macro drivers. Monitoring real rates and liquidity conditions helps contextualise correlation changes.
2. What is the lead-lag duration between copper prices and industrial production pivots?
Copper often turns months before industrial production data confirms macro shifts due to forward-looking demand expectations.
3. How should a rolling correlation matrix filter false technical breakouts?
Breakouts during correlation instability carry higher failure risk, while those supported by strengthening relationships exhibit greater reliability.
4. Why does the eurodollar futures curve front-run FX reversals?
Interest rate futures embed forward policy expectations that influence currency valuation ahead of realised policy changes.
5. How do carry trade unwinds trigger flash equity reversals?
Leverage reduction forces rapid risk exposure cuts, increasing volatility and equity selling pressure.
6. Can AI sentiment aggregators proxy retail exhaustion?
They can complement intermarket indicators by identifying positioning extremes when aligned with macro signals such as credit spreads and yield movements.

