Powell’s Final Week: Fed/ECB/BoE Hold Hawkish, Mag 7 Earnings 27.8%, Brent Hits $126

Market Sentiment Overview
The week of May 4 to 8 opens with markets processing the most consequential week in global finance since the Iran war began on February 28. The prior week delivered a torrent of macro events that have fundamentally reset the framework for every major asset class: Powell’s final press conference as FOMC Chair, the ECB and BoE both holding with hawkish forward guidance, Japan’s first FX intervention in nearly two years sending USD/JPY crashing from above 160.70, Brent crude hitting a four-year high of $126.41 before retreating, the S&P 500 posting its sixth consecutive weekly advance to new all-time highs, Bitcoin approaching the $80,000 psychological barrier, and Magnificent Seven earnings delivering a stunning 27.8% Q1 earnings growth rate (the highest since Q4 2021). The macro picture that emerges is one of stark divergence. The US economy grew at 2.0% annualized in Q1 2026 (better than feared after the 0.5% prior quarter) but the Eurozone grew only 0.1% in Q1 (the weakest reading since the early pandemic). Eurozone April HICP surged to 3.0% YoY (the highest since September 2023). All three major central banks held rates but delivered hawkish forward guidance. The ECB is now expected to hike in June if Brent holds above $100. The BoE held 8-1 with Chief Economist Huw Pill dissenting for a hike. Powell stated the committee is well positioned to move in either direction, with three members voting against the easing bias language for the first time since October 1992. Markets are now pricing only 10% probability of a Fed cut by end-2026 and more than 50% probability of a hike by April 2027. The Strait of Hormuz has effectively shut down (energy analytics firm Kpler recorded only 12 westward crossings per day). Brent hit $126.41 on Thursday after reports that Trump was being briefed on plans for fresh military strikes on Iran. Oil then retreated after Iran submitted a new peace proposal to Pakistani mediators. WTI closed at $101.94.
Currencies
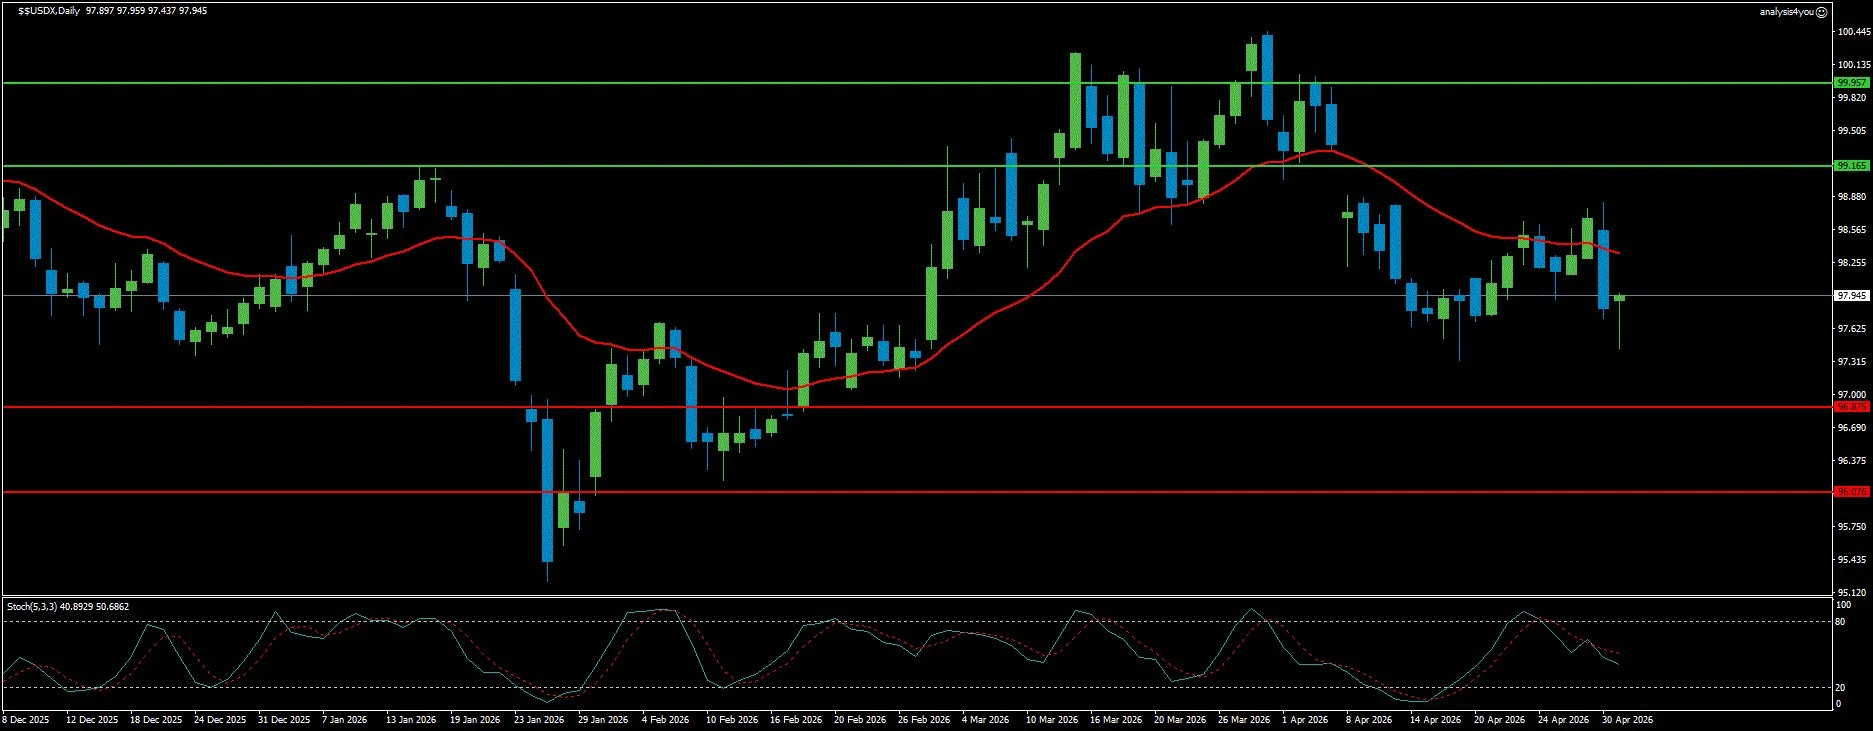
USD Index: Dead-Cat Bounce Stalls, Bearish Structure Intact (97.95)
Current Trend: Bearish
Resistance: 99.17 | 99.96
Support: 96.88 | 96.08
The US Dollar’s dead-cat bounce from 97.04 support has stalled. DXY at 97.95 is essentially unchanged from last week’s 98.21 (unable to push meaningfully higher despite a hawkish Fed hold, three FOMC members voting against the easing bias, Japan’s intervention sending USD/JPY surging above 160 before collapsing, and continued Iran war safe-haven demand). The inability to break above the declining MA cluster near 98.50 to 99.00 (despite this battery of hawkish catalysts) is the most bearish signal the Dollar chart can provide. Bulls had their best week of catalysts in months and still failed to reclaim resistance. The FOMC decision revealed a genuinely divided committee. One member (Miran) voted for a cut, while three members (Hammack, Kashkari, Logan) voted against including an easing bias. Powell adopted a relatively neutral tone. His unexpected announcement that he will stay on as a Fed Governor until 2028 removes one source of institutional uncertainty. The Senate Banking Committee approved Warsh’s nomination. The week ahead brings ISM Services PMI Tuesday (Prices Paid component is the key inflation signal), ADP Wednesday, and April NFP Friday. A strong NFP above 150K with accelerating wage growth would be the most USD-supportive outcome. A weak NFP below 100K would revive rate cut speculation and pressure DXY toward 96.88. Technically, DXY is at 97.95, consolidating below the declining MA cluster. Price is below MA 20, MA 50, and MA 200 (all three MAs stacked bearishly above). The Stochastic at 40.89/50.69 is mid-range while in a downtrend with a bearish signal. Resistance at 99.17 is the immediate ceiling. On the downside, 96.88 is first support, with 96.08 the deeper floor.
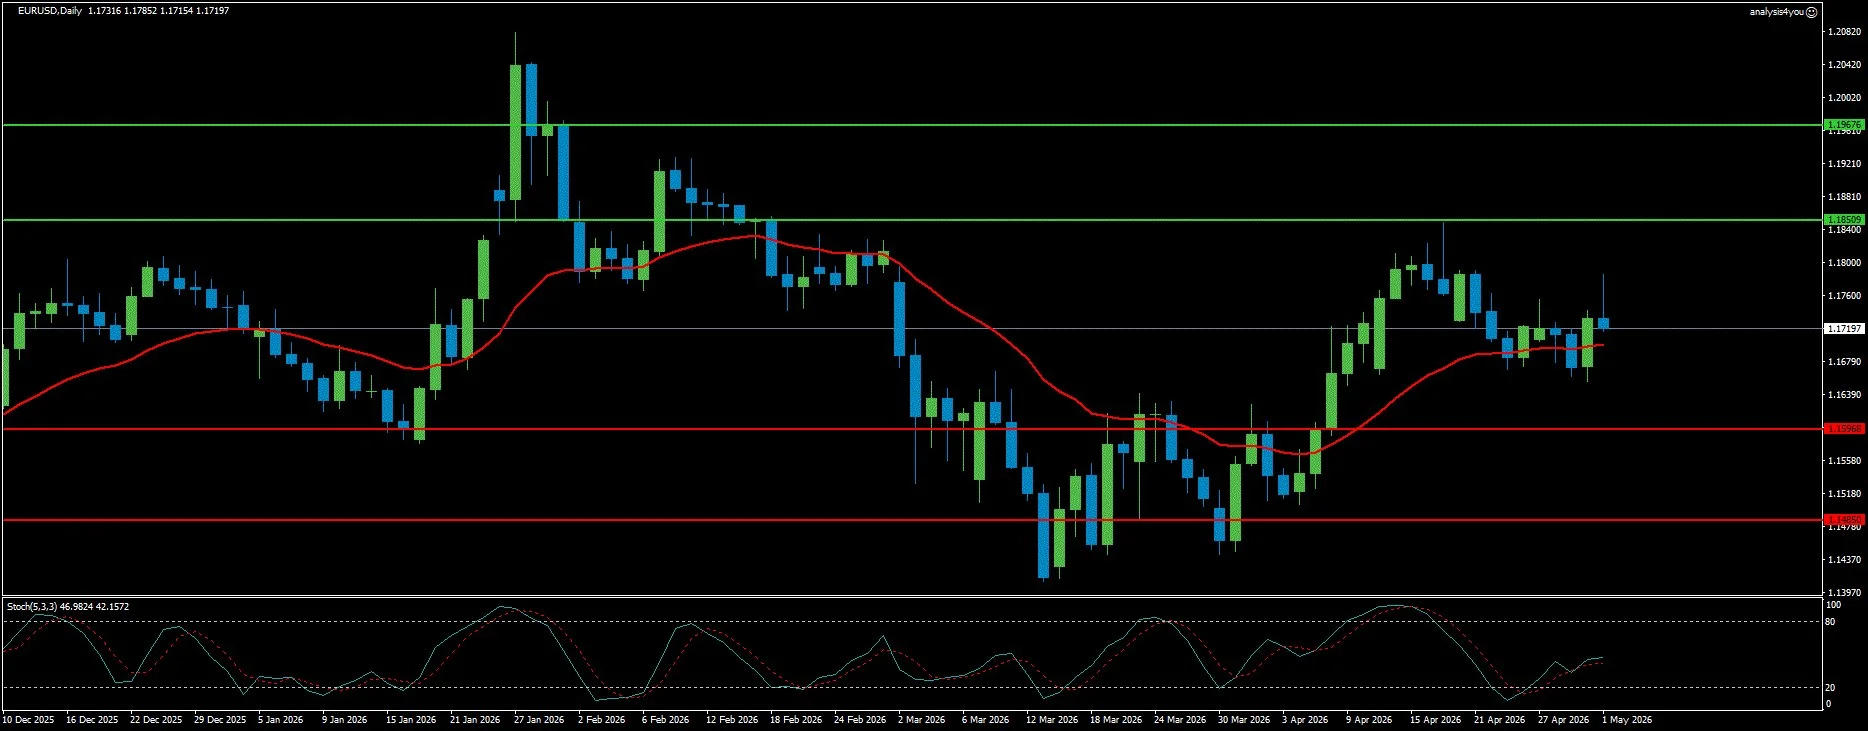
EUR/USD: Resilient Above All MAs, Bullish Stochastic Setup (1.1720)
Current Trend: Bullish
Resistance: 1.1851 | 1.1968
Support: 1.1597 | 1.1485
EUR/USD demonstrated remarkable resilience during the prior week. Despite a hawkish Fed, USD/JPY volatility, renewed Iran re-escalation pushing oil back above $100, and the Eurozone’s shockingly weak Q1 GDP of just 0.1% annualized (the pair held above all three major moving averages and closed virtually unchanged at 1.1720). The structural bullish case remains intact: price above the 20-day, 100-day and 200-day SMAs, and the Stochastic has reset from deeply oversold (16/15 two weeks ago) to a mid-range bullish uptrend (46.98/42.16 with a bullish signal). The ECB decision was the week’s most important EUR catalyst. The hold was unanimous but a rate hike had been actively debated. Lagarde acknowledged that risks to inflation are tilted to the upside. ECB’s Nagel explicitly cautioned that the bank might need to tighten as early as June. Reuters reported the ECB is expected to raise rates in June if Brent oil prices hold above $100. Money markets anticipate approximately 75bp of ECB hikes by year-end. Eurozone April HICP rose to 3.0% YoY (the highest since September 2023). The Eurozone growth picture is more concerning. Q1 GDP grew only 0.1% (far below the 0.4% expected). For EUR/USD, the net effect is moderately positive (ECB rate hike expectations provide structural EUR support even as the growth differential versus the US widens). Technically, EUR/USD is at 1.1720, holding above the 20-day SMA (approximately 1.1671), 100-day SMA (approximately 1.1704), and 200-day SMA (approximately 1.1677). The Stochastic at 46.98/42.16 is in mid-range with an uptrend and bullish signal. Resistance at 1.1851 is the primary target. On the downside, converging SMA support at 1.1597 is the first meaningful floor.
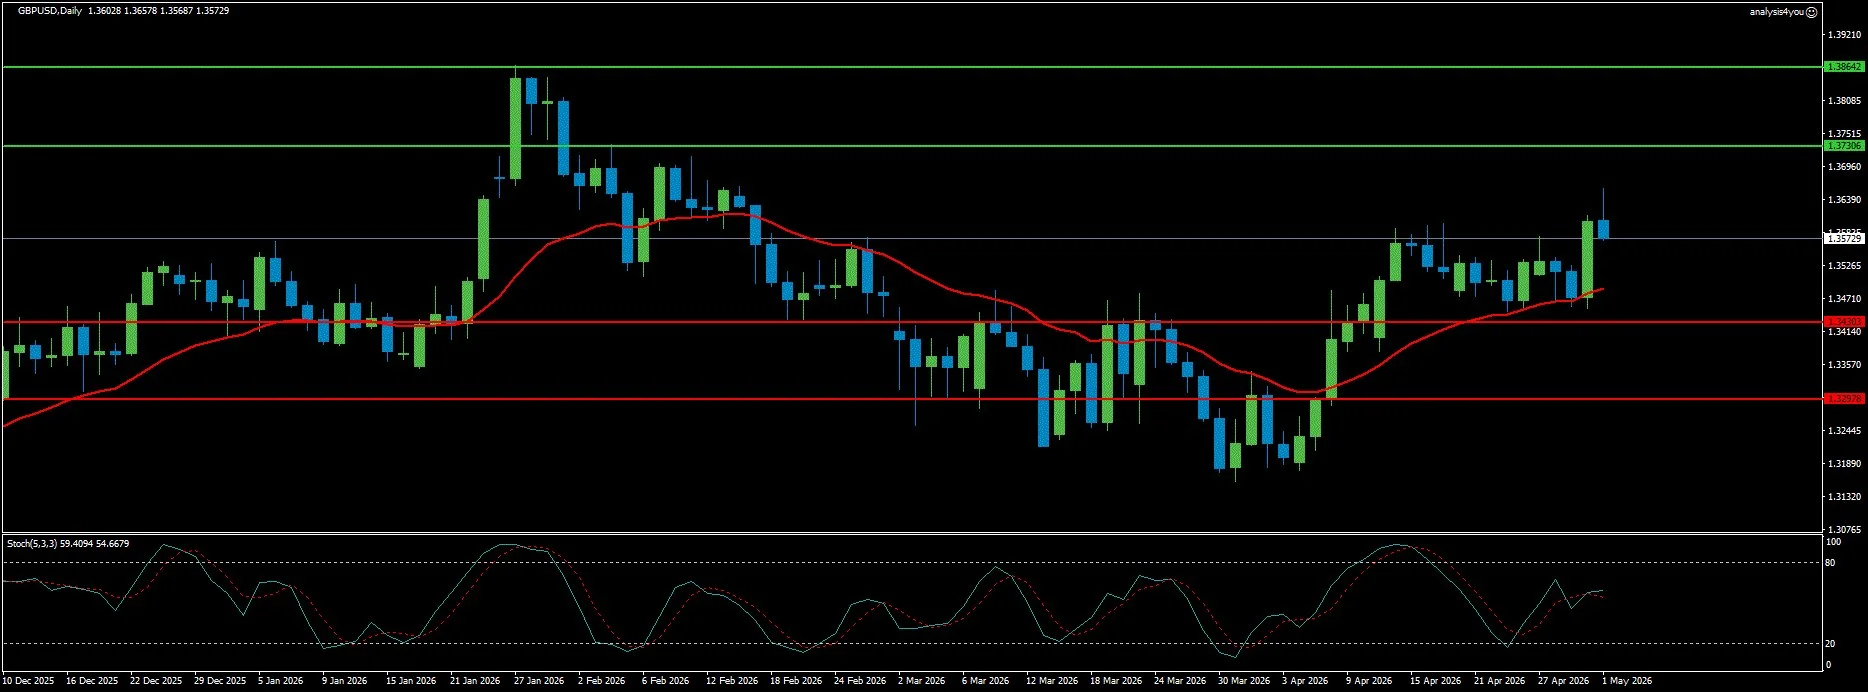
GBP/USD: Best Currency Setup, BoE Hawkish Shift (1.3573)
Current Trend: Bullish
Resistance: 1.3731 | 1.3864
Support: 1.3430 | 1.3298
GBP/USD has the cleanest technical and fundamental setup of the three currency pairs. The pair advanced from 1.3532 to 1.3573 (approaching the 1.3600 zone that had been a triple top resistance). Resistance levels have been upgraded to 1.3731 and 1.3864 (significantly above the prior triple top), signaling that the technical framework has shifted to pricing a breakout. The BoE decision confirmed the structural shift: held 8-1 with Chief Economist Huw Pill dissenting for a 25bp rate hike. Bailey explicitly stated it would be a mistake to wait for second-round effects before taking policy action. The market is pricing approximately 60bp of BoE tightening by year-end, creating a significant divergence from the Fed’s one potential 25bp cut. UK data from the prior week was the most supportive set in months. UK Q1 GDP expanded 2.0% annualized (better than the 1.7% estimate and dramatically better than the Eurozone’s 0.1%). UK inflation (March CPI at 3.3%) beat expectations. The combination of stronger growth, hotter inflation, hawkish BoE communication, and favorable policy divergence versus the Fed provides a robust fundamental case. Technically, GBP/USD is at 1.3573, above the MA which is curling upward. Above MA 20, MA 50, and MA 200 (all three MAs stacked bullishly below price). The Stochastic at 59.41/54.67 is in the upper mid-range with an uptrend and neutral signal (not overbought, not oversold, with genuine directional room). Resistance at 1.3731 is the immediate target above the prior triple top at 1.3600. On the downside, 1.3430 is the first meaningful support.
Stocks
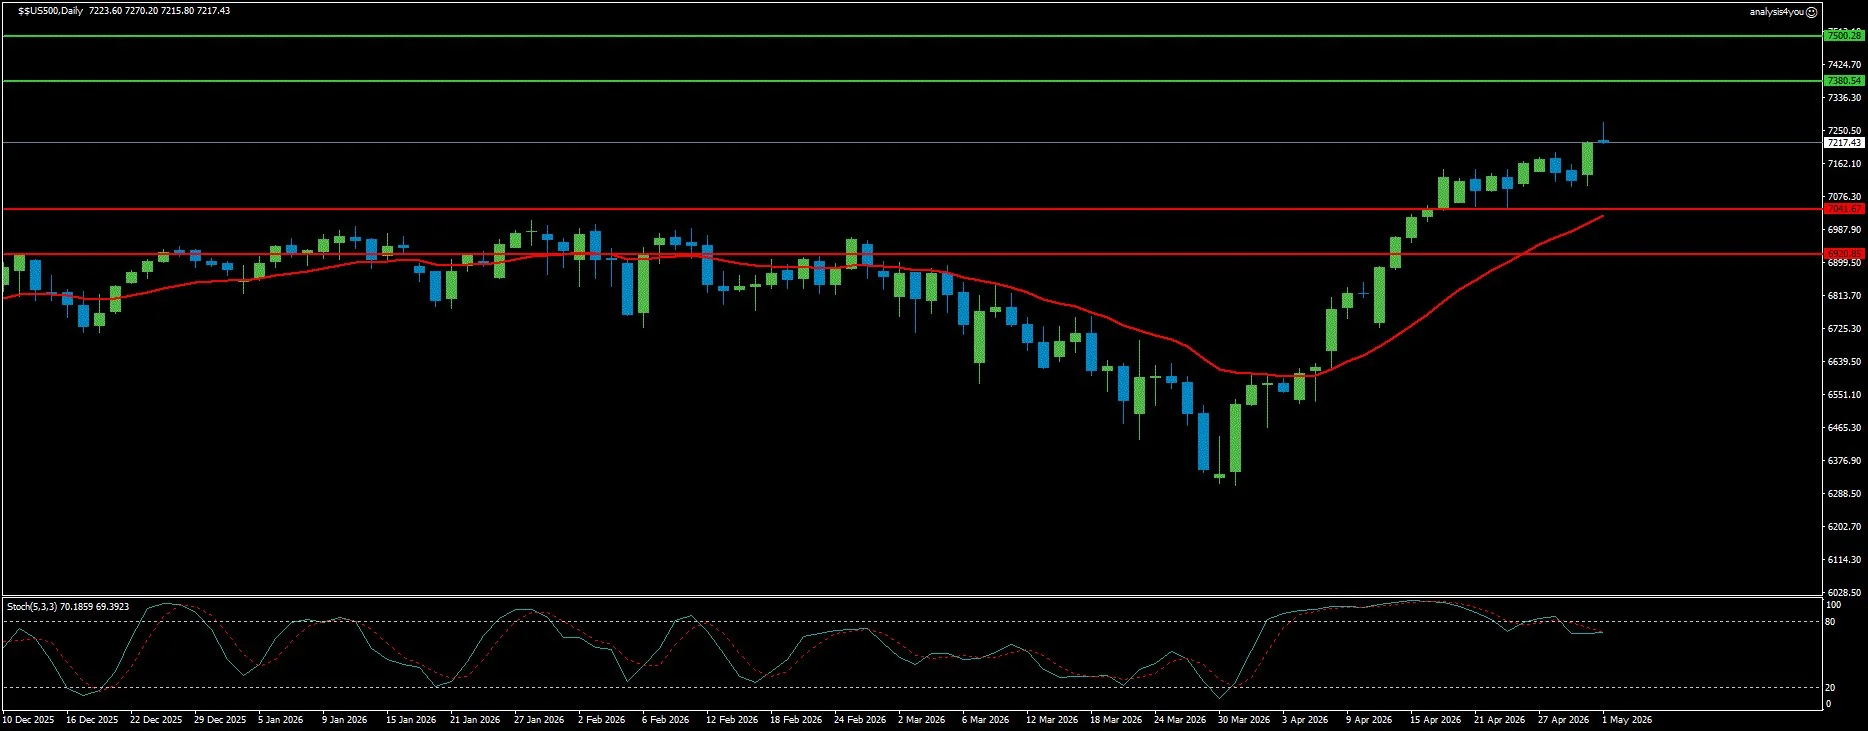
S&P 500: Sixth Consecutive Weekly Gain, Earnings Momentum Carries ATH (7,217)
Current Trend: Bullish
Resistance: 7,381 | 7,500
Support: 7,042 | 6,921
The S&P 500 closed at a record high of 7,230 on Friday, notching its sixth consecutive weekly advance (the longest streak since October 2024). The Magnificent Seven earnings were the decisive catalyst. Analysts now see Q1 2026 aggregate earnings growth of 27.8% year-on-year (the highest since Q4 2021 and an 11.7 percentage point upgrade from just one week prior). Of the 314 companies that reported, 83% beat earnings estimates and 78% beat revenue estimates. Apple advanced 3.3% on a solid iPhone 17 and MacBook Neo sales forecast. Atlassian surged 29.6% on a raised annual forecast. The earnings season has definitively answered the bear case’s most important question: corporate profits can grow strongly even in a war environment. US Q1 GDP at 2.0% annualized (though below the 2.3% estimate) is dramatically better than the 0.5% Q4 2025 reading. The Stochastic at 70.19/69.39 continues to decompress from the 96/97 extreme of three weeks ago while price holds at ATH (the most positive technical signal the chart can generate in an overbought environment). The week ahead for the S&P 500 is determined by NFP Friday and the Iran proposal’s fate. Technically, the S&P 500 is at 7,217, above all three moving averages with the MA curling strongly upward. The Stochastic at 70.19/69.39 is in the overbought zone with an uptrend and neutral signal. The continued decompression from 96/97 to 79 to 70 (while price holds at ATH) is the most constructive technical development. Resistance at 7,381 is the immediate target. On the downside, 7,042 remains the critical floor.
Commodities
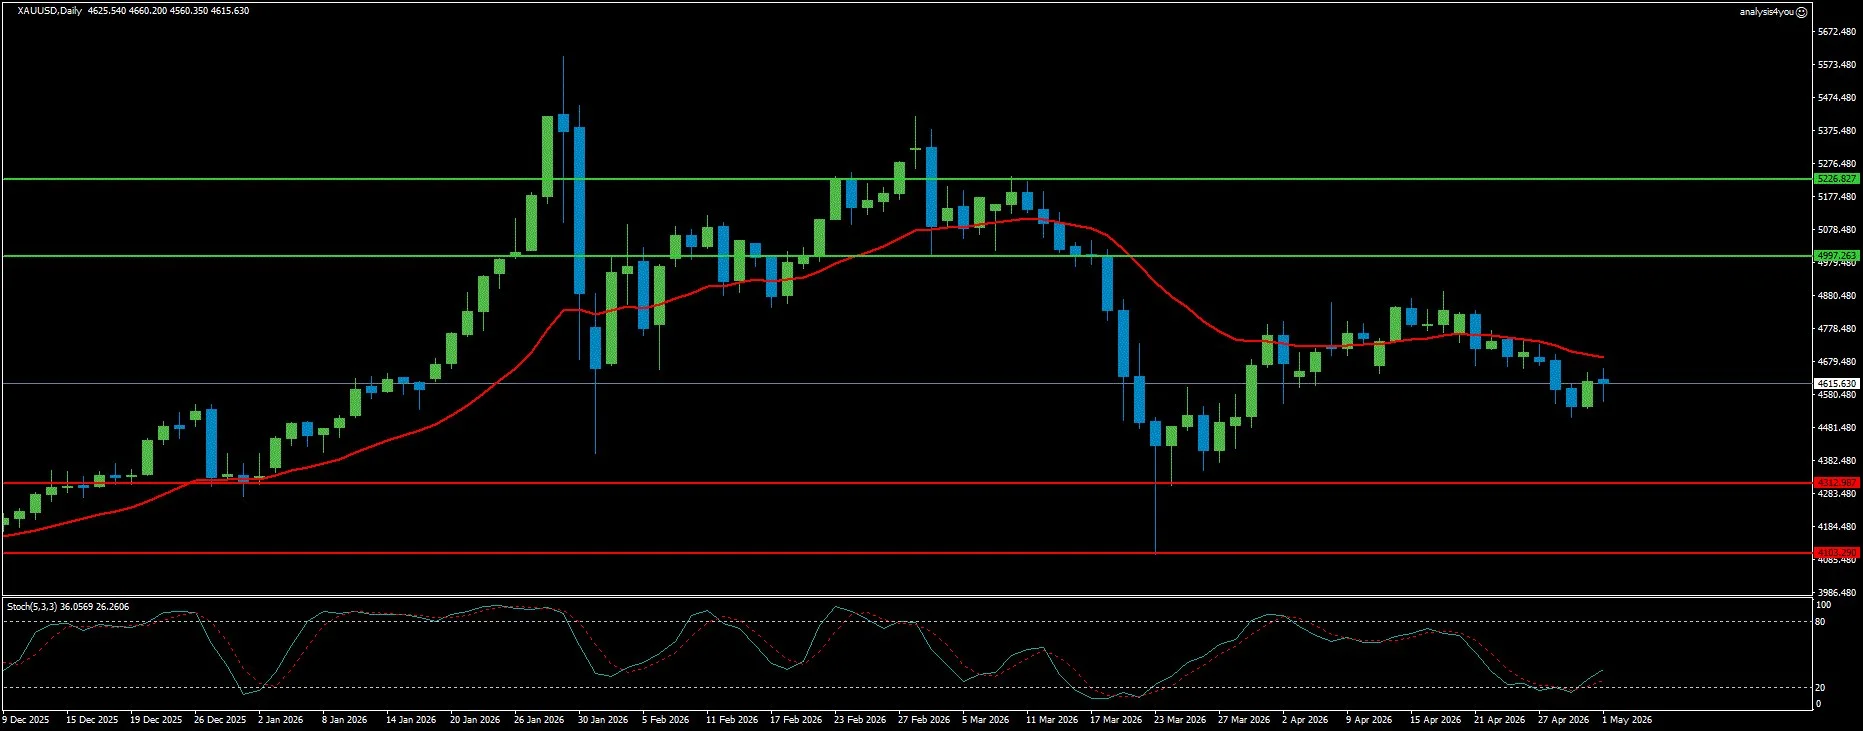
Gold: Second Weekly Loss, Hawkish Central Banks the Primary Headwind (4,616)
Current Trend: Bearish
Resistance: 4,997 | 5,227
Support: 4,313 | 4,103
Gold registered its second consecutive weekly loss, declining from $4,707 to $4,616 (having touched a fresh April low near $4,500 intraw eek before recovering above $4,600 on Iran’s new peace proposal submission). The XAU/EUR and XAU/GBP pairs both lost over 3% for the week (highlighting that the selling pressure is not simply a Dollar story but reflects genuine capital outflows from Gold into currencies that are repricing central bank hawkishness). All three major central banks delivered hawkish guidance simultaneously (inflation risks are elevated, rate hikes are more likely than cuts, and the opportunity cost of holding non-yielding Gold is rising). The Fed’s divided vote (with three members opposing the easing bias language) pushed CME FedWatch to price only 10% probability of a cut by end-2026 and more than 50% probability of a hike by April 2027. The ECB is expected to hike in June if Brent holds above $100. This simultaneous hawkish pivot is the most hostile environment for non-yielding Gold since the inflation shock of 2022. The war’s mechanism works against Gold through rising real bond yields (oil spike triggers inflation surge, which triggers higher rate expectations, which drives real yields higher). The technical picture has deteriorated. Gold registered consecutive daily closes below the 20-day and 100-day SMAs. The $4,500 Fibonacci 61.8% support was tested intraw eek and held (for now). A sustained daily close below $4,500 would be a decisive bearish signal opening the path toward $4,400, then $4,280 to $4,245. Technically, Gold is at $4,616, below the 20-day SMA and 50-day SMA, but still above the 200-day SMA at approximately $4,100. The Stochastic at 36.06/26.26 is approaching oversold while in an uptrend with a bullish signal (a divergence between Stochastic momentum and price action). The $4,500 Fibonacci 61.8% support is the critical near-term floor. On the upside, first resistance at $4,685, then $4,760.
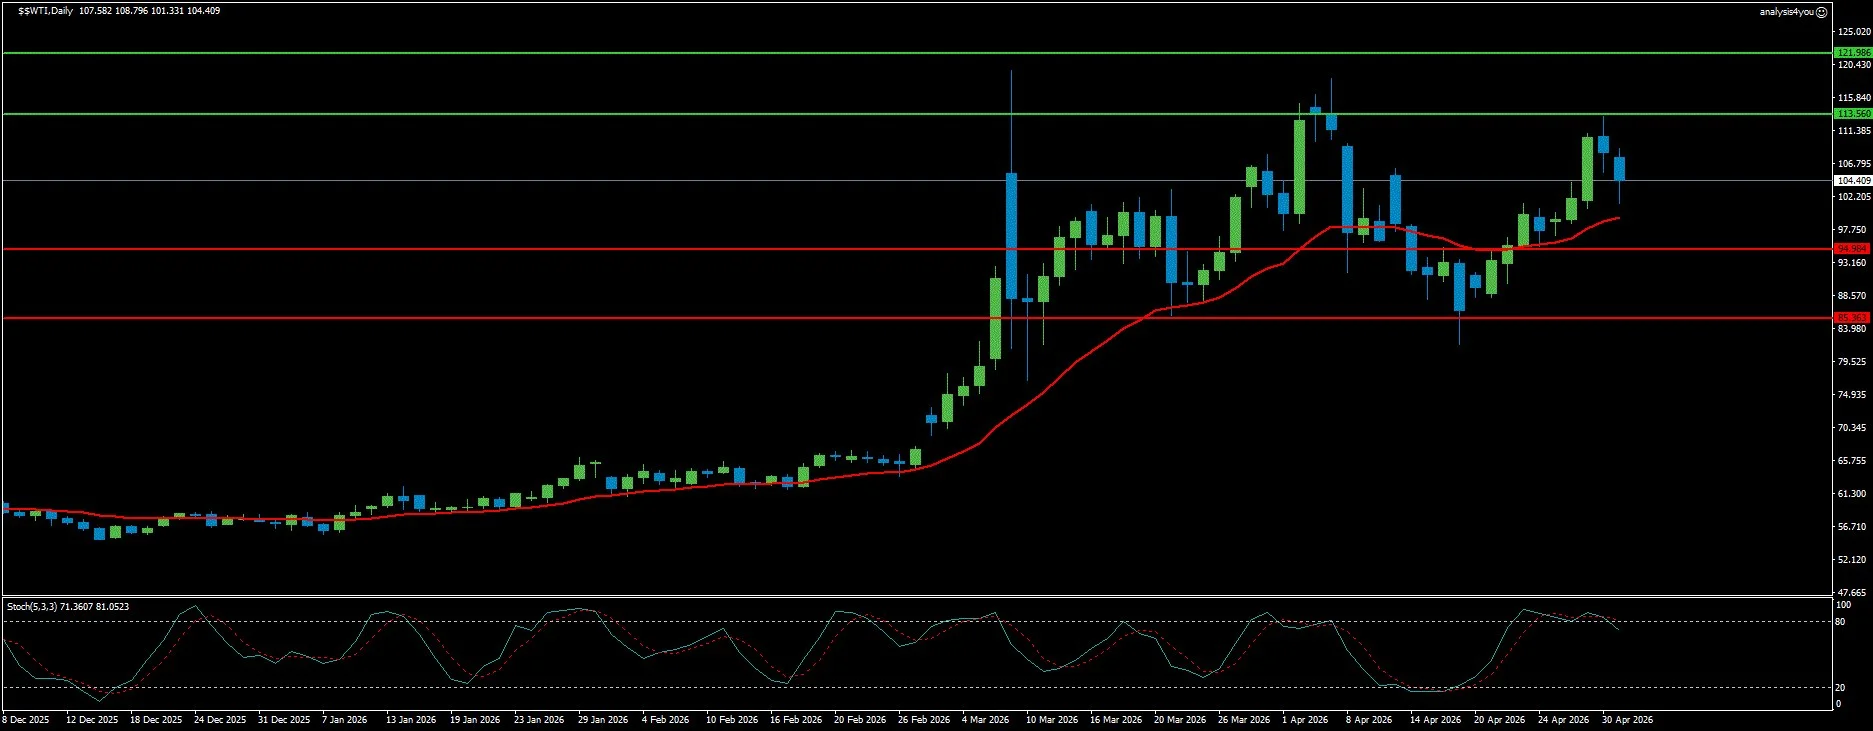
WTI Crude Oil: Re-escalation Confirmed, Brent Hit Four-Year High (104.41)
Current Trend: Bullish
Resistance: 113.56 | 121.99
Support: 94.98 | 85.36
WTI crude oil has firmly re-established itself in the $100+ zone, closing at approximately $101.94 with the chart showing $104.41 (reflecting the volatile intraweek action that saw Brent hit a four-year high of $126.41 on Thursday before retreating sharply on Iran’s peace proposal Friday). WTI gained approximately 7% for the week and Brent approximately 9%. The fundamental driver is unchanged: the Strait of Hormuz recorded only 12 westward crossings per day per Kpler (a near-total shutdown of one of the world’s most critical energy chokepoints). On Thursday, reports that Trump was being briefed on plans for fresh military strikes on Iran (potentially including hypersonic missiles) sent Brent to $126.41. Iran’s Supreme Leader Khamenei simultaneously announced a new legal framework for Hormuz management (effectively asserting permanent Iranian control over the waterway). UAE announced its exit from OPEC effective May 1. Reuters confirmed the supply disruption has begun to translate into real physical market tightness. ISM Manufacturing Prices Paid hit a four-year high, confirming the energy cost passthrough. The Iran peace proposal submitted to Pakistani on Thursday is the most credible diplomatic signal in two weeks. Whether Washington responds positively is the week’s defining geopolitical question. Technically, WTI is at $104.41, well above the steeply rising MA. The Stochastic at 71.36/81.05 is in the overbought zone while in a downtrend (the same bearish divergence pattern that has preceded each temporary pullback during the war). Resistance at $113.56 is the next major ceiling. Support at $94.98 / $85.36. The Iran peace proposal is the binary event that determines whether $113 or $85 is tested first.
Crypto
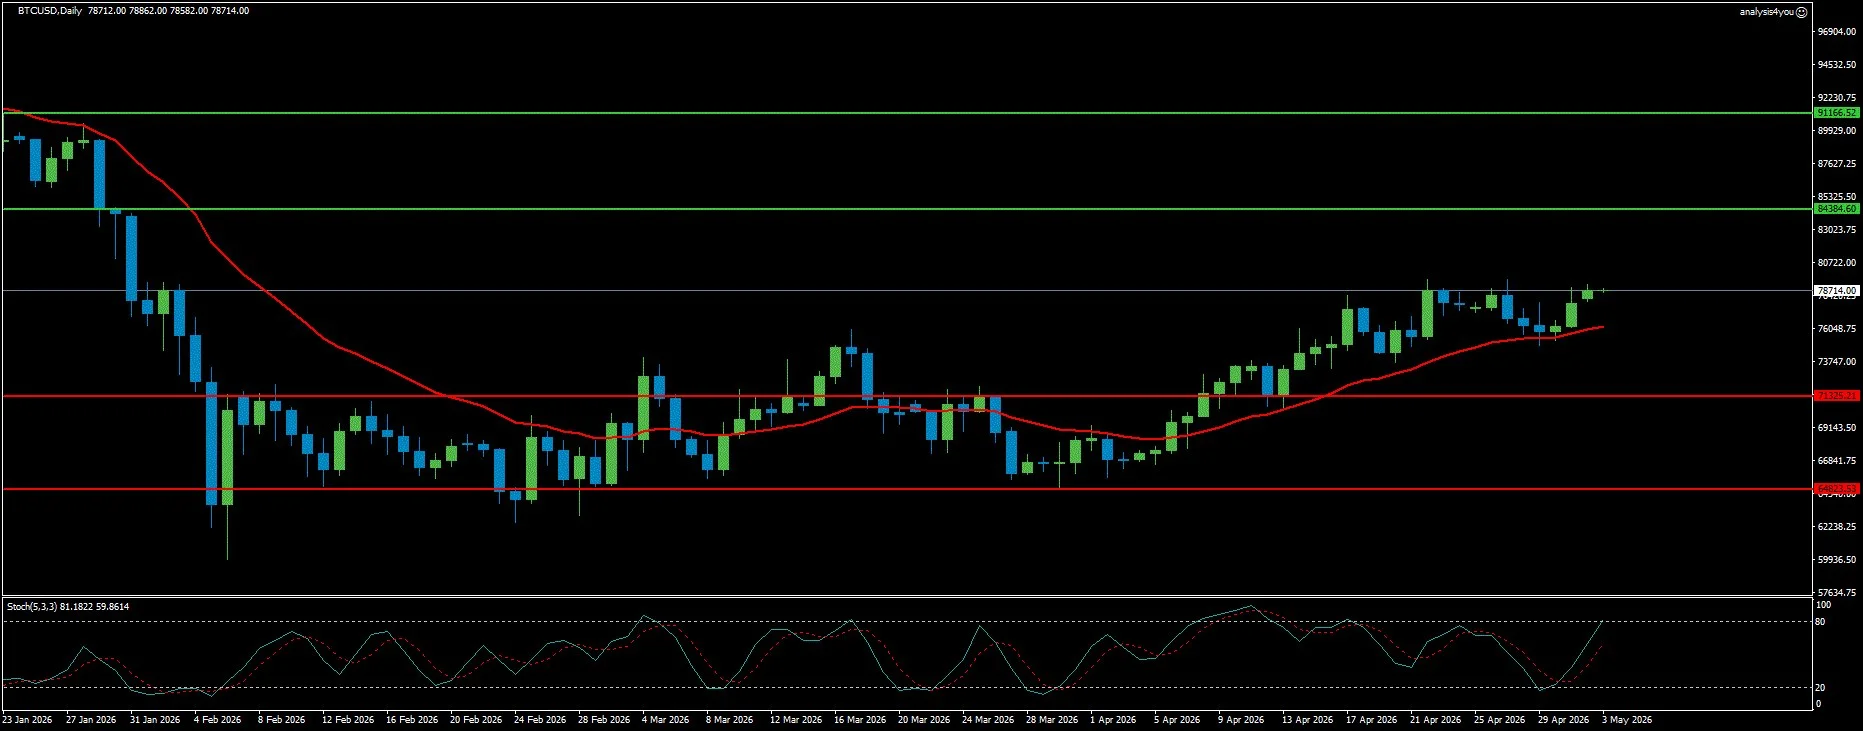
Bitcoin: Strongest Signal Across All Instruments, $80,000 Battle Defines Week (78,714)
Current Trend: Bullish
Resistance: 84,384 | 91,166
Support: 71,325 | 64,823
Bitcoin enters the week with the strongest overall technical signal across all seven instruments (a combination of Stochastic overbought in an uptrend with a bullish confirmation that no other instrument matches). BTC advanced from $77,560 to $78,714, reaching a high of $78,862 and approaching the defining $80,000 psychological barrier. The weekly low of $74,937 on Wednesday (when the Fed’s hawkish hold and Powell’s final press conference dampened risk appetite) and the subsequent recovery above $77,000 by Friday confirmed that BTC’s dip-buyers are active and institutional demand is absorbing selling pressure. Bitcoin has historically followed a four-year cyclical pattern marked by halvings. The current drawdown from $126,000 to $63,000 in February was approximately 50% (significantly shallower than the historical 80% average). Over the past two months, US spot BTC ETFs posted net inflows of $3.75 billion while Strategy acquired more than 100,000 BTC since the start of the year. The $80,000 level concentrates multiple critical resistance frameworks. It is the psychological round number. It aligns with the 200-day EMA. It is approximately where the Traders’ Realized Price sits. The week ahead for Bitcoin is primarily driven by risk sentiment from the Iran proposal outcome and NFP Friday. Technically, BTC is at $78,714, well above the 50-day EMA at approximately $72,790 and the 100-day EMA at $75,498. The Stochastic at 81.18/59.86 is in the overbought zone while in an uptrend with a bullish signal (the strongest Stochastic configuration of all seven instruments). The critical resistance zone is $80,000. A decisive daily close above $80,000 would trigger the short-squeeze (46 consecutive days of negative funding rates). On the downside, $75,680 is the first support.
Key Events (May 4-8, 2026)
Weekend (May 2-3): Iran peace proposal submitted to Pakistani mediators awaits Washington’s response.
Monday, May 5: Markets digest weekend Iran proposal news. RBA meets in Australia.
Tuesday, May 6: ISM Services PMI April (US). Prices Paid component is the key inflation signal. JOLTS Job Openings March. Multiple Fed and ECB speakers emerging from blackout.
Wednesday, May 7: ADP Employment Change April (the NFP preview). Additional Fed and ECB speakers.
Thursday, May 8: US Initial Jobless Claims. Further Fed and ECB speakers.
Friday, May 8: US April Nonfarm Payrolls (the week’s headline event). After March’s 178K beat, the risk is to the upside. A strong print above 150K with accelerating wage growth reinforces no-cut narrative, supports USD, pressures Gold. A weak print below 100K revives rate cut expectations. Canada employment report releases simultaneously.
Week Ahead Outlook
The week of May 4 to 8 is the first week of the new post-Powell era at the Federal Reserve. The markets are repricing the entire monetary policy landscape in real time: from the mid-April pricing of 52% chance of a Fed hold by year-end, to now pricing only 10% probability of a cut and more than 50% chance of a hike by April 2027. NFP Friday will either validate or challenge that repricing.
Scenario 1: Iran Talks Resume + Weak NFP (approximately 25%): Washington responds positively to Iran’s peace proposal. WTI crashes below $100 toward $94.98. Risk-on surge: S&P 500 extends gains toward 7,381. DXY extends decline toward 96.88. EUR/USD breaks 1.1851 targeting 1.1968. GBP/USD breaks 1.3600 targeting 1.3731. Gold bounces toward $4,760. BTC breaks $80,000 targeting $84,384. Weak NFP below 100K amplifies all of the above.
Scenario 2: Diplomatic Stalemate + Mixed NFP (approximately 50%): Iran proposal receives no clear response. WTI holds $95 to $105 range. NFP comes in near 130K to 160K. DXY consolidates 96.88 to 99.17. EUR/USD holds 1.1597 to 1.1851. GBP/USD holds 1.3430 to 1.3731. S&P 500 consolidates 7,042 to 7,381. Gold holds $4,500 to $4,760 range. BTC consolidates $75,680 to $80,000. This is the base case.
Scenario 3: Re-escalation + Hot NFP (approximately 25%): Trump rejects Iran proposal and announces fresh strikes. WTI spikes toward $113.56. DXY bounces toward 99.17. EUR/USD falls below 1.1597. GBP/USD breaks below 1.3430. S&P 500 pulls back below 7,042. Gold tests $4,500 again. BTC flash-crashes below $75,680. Hot NFP above 200K adds hawkish repricing.
Bottom line: Ten weeks into the Iran war, the market has settled into a new equilibrium: equities at all-time highs on earnings strength, oil above $100 on supply disruption, Gold under pressure from hawkish central banks, currencies repricing Fed-ECB-BoE divergence, and Bitcoin decoupling from the traditional risk-on/risk-off binary. The week’s two defining events (the Iran proposal outcome and NFP Friday) will determine whether that equilibrium holds or breaks. BTC’s Stochastic configuration is the most bullish of all seven instruments. DXY’s Stochastic configuration is the most bearish.

