NFP 172K Demolishes Rate Cut Narrative, BTC Crashes Below $60K, ECB Hikes Thursday
Market Sentiment Overview
The week of June 8 to 12 opens in the wake of the most powerful single-week market reset since the Iran war began on February 28. The May Nonfarm Payrolls print of 172K (beating the 85K consensus by a margin not seen since the early months of the energy shock) did not merely shift rate expectations. It demolished the dominant market narrative of the prior six weeks. For six weeks, markets had priced the Iran MOU as a path toward oil price normalisation, inflation deceleration, and eventually a pivot away from the Fed’s tightening bias. The 172K NFP and its April revision from 115K to 179K confirmed that the US labour market is not cooperating with that thesis. The market reaction was swift, severe, and broadly symmetrical. The S&P 500 fell 2.64% on June 5 (its worst single-day decline since October, ending the nine-consecutive-week winning streak). The Nasdaq fell 4.18% (its worst session since April 2025). Nvidia and AMD saw steep drops erasing hundreds of billions in market value. Bitcoin briefly fell below $60,000 (its most psychologically significant breach since the war began) with liquidations of approximately $2.45 billion. Gold crashed below $4,350 (decisively breaking below the 200-day SMA and the descending triangle base that had held for six weeks). The DXY surged toward the psychological 100.00 barrier (two-month highs). EUR/USD fell below the 1.1470 long-term static support that had been identified as the line in the sand. GBP/USD dropped back below all three major moving averages. The Iran situation adds a critical second dimension. Iran’s Foreign Minister Araghchi stated on Thursday that no tangible progress has been made in negotiations. The MOU appears to have stalled completely. CENTCOM continued strikes on Iranian targets throughout the week. Iran retaliated with drone attacks on US forces in Kuwait. The Strait of Hormuz remains restricted. WTI rebounded over 6% as the re-escalation narrative reasserted itself. The week of June 8 to 12 is the most policy-dense week of the entire war period. Thursday June 11 brings the ECB’s monetary policy decision (the first ECB rate hike in years). Wednesday June 11 brings May US CPI (forecast at 4.2% YoY, which would effectively double the Fed’s 2% target). The Fed is in its blackout period. The June 16 to 17 FOMC is the meeting where Warsh chairs his first session and where the market is watching for whether the easing bias is formally dropped.
Currencies
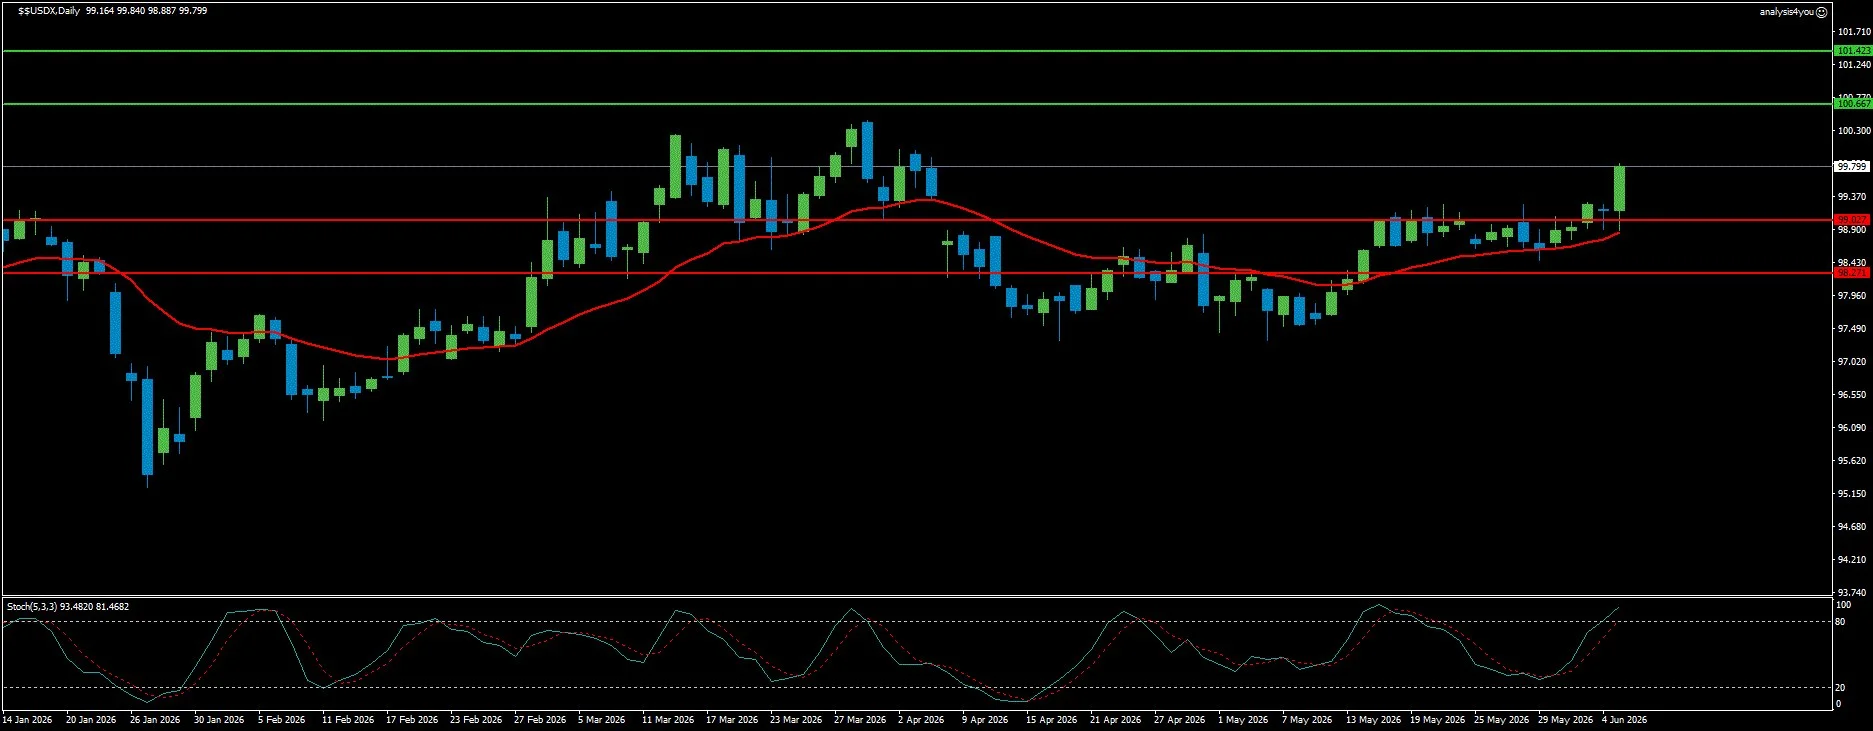
USD Index: Above All Three MAs, NFP Catapults Dollar to Two-Month Highs(99.80)
Current Trend: Bullish
Resistance: 100.67 | 101.42
Support: 99.03 | 98.27
The US Dollar has achieved what the CPI/PPI shock three weeks ago only partially delivered: a complete, sustained breakout above all three major moving averages simultaneously, with price above upper Bollinger Bands for two consecutive sessions. At 99.80, DXY is at its highest level since early April (just 20 points below the psychological 100.00 barrier). The fundamental case for continued Dollar strength has never been stronger during the war period. NFP 172K beat the 85K consensus by an extraordinary margin. April NFP was revised upward from 115K to 179K. JOLTS Job Openings rose to 7.618 million in April (the highest level since May 2024). ISM Manufacturing PMI came in at 54.0 in May and ISM Services at 54.5. Both manufacturing and services are expanding simultaneously while inflation remains at 3.8% YoY (PCE). The combination of an expanding economy, a resilient labor market, and persistently elevated inflation has moved the CME FedWatch probability of at least one 25bp Fed rate hike by year-end to approximately 60 to 70%, with a September hike probability around 60%. The debate is shifting from when to cut to whether policy is restrictive enough. The week’s primary USD catalyst is Wednesday’s May CPI (the last critical inflation data before the June 16 to 17 FOMC). May CPI is forecast at 4.2% YoY. A hot May CPI above 4.2% would push DXY above the psychological 100.00 barrier toward 100.67. A soft May CPI below 4.0% would be the week’s only meaningful Dollar headwind. Technically, DXY at 99.80 is above all three major MAs with price above upper Bollinger Bands for two consecutive sessions. The Stochastic at 93.48/81.47 is deeply overbought in an uptrend with a bullish signal. Resistance at 100.67 / 101.42. Support at 99.03 / 98.27.
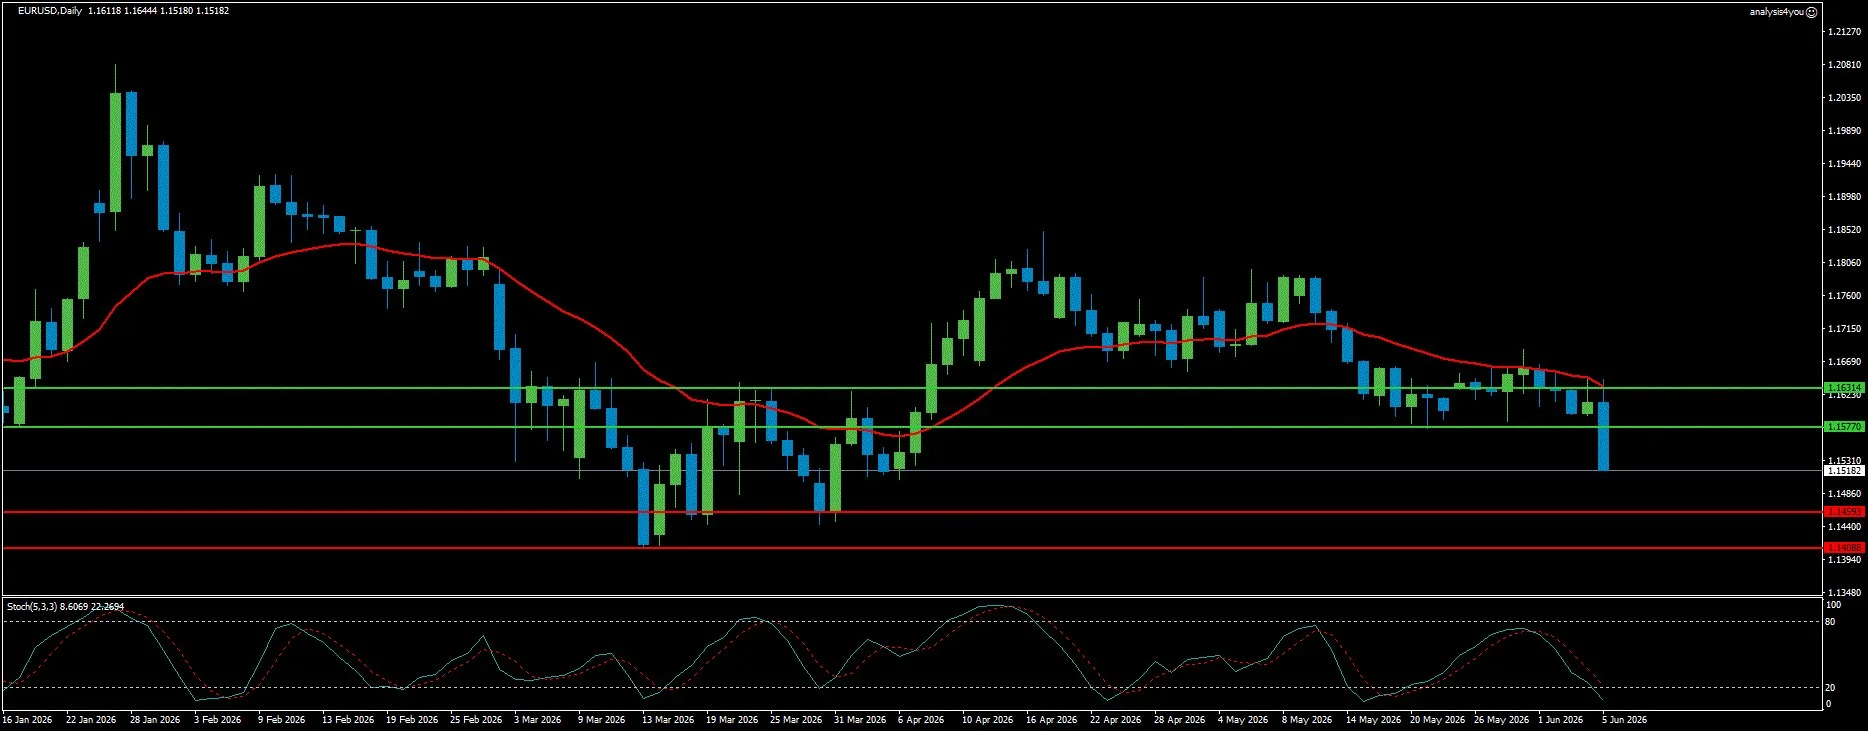
EUR/USD: Broke Critical 1.1470 Support, ECB Hikes Into Stagflation (1.1518)
Current Trend: Bearish
Resistance: 1.1577 | 1.1631
Support: 1.1459 | 1.1409
EUR/USD has broken below the critical 1.1470 long-term static support that had been repeatedly identified as the line in the sand since the inflation shock began. At 1.1518, the pair is below MA 20, MA 50, and MA 200 simultaneously, below lower Bollinger Bands, with a deeply oversold Stochastic at 8.61/22.27 in a downtrend. The warning has been triggered: a clear break below 1.1470 hints at a steady and sustained decline ahead, with an initial target at 1.1200. The fundamental picture this week is one of the most challenging of the entire war. The ECB is expected to hike rates on Thursday June 11 for the first time in years (a structural EUR-positive through the rate differential channel). But the ECB is hiking into an economy already in contraction: Q1 GDP at -0.2% QoQ, Eurozone Composite PMI at 48.5. The EU HICP for May came in at 3.2% YoY (up from 3.0%) and EU PPI surged to 4.9% YoY (stagflation is not a risk for the Eurozone, it is the current reality). The ECB rate hike is widely expected and already priced into EUR/USD (meaning the reaction will be determined by the guidance language, not the hike itself). If the ECB signals a one-and-done hike (July is not live), EUR may sell on the news. Technically, EUR/USD is at 1.1518, with the current bar below lower Bollinger Bands. The Stochastic at 8.61/22.27 is deeply oversold in a downtrend with a bearish signal. Resistance at 1.1577 / 1.1631. Support at 1.1459 / 1.1409.
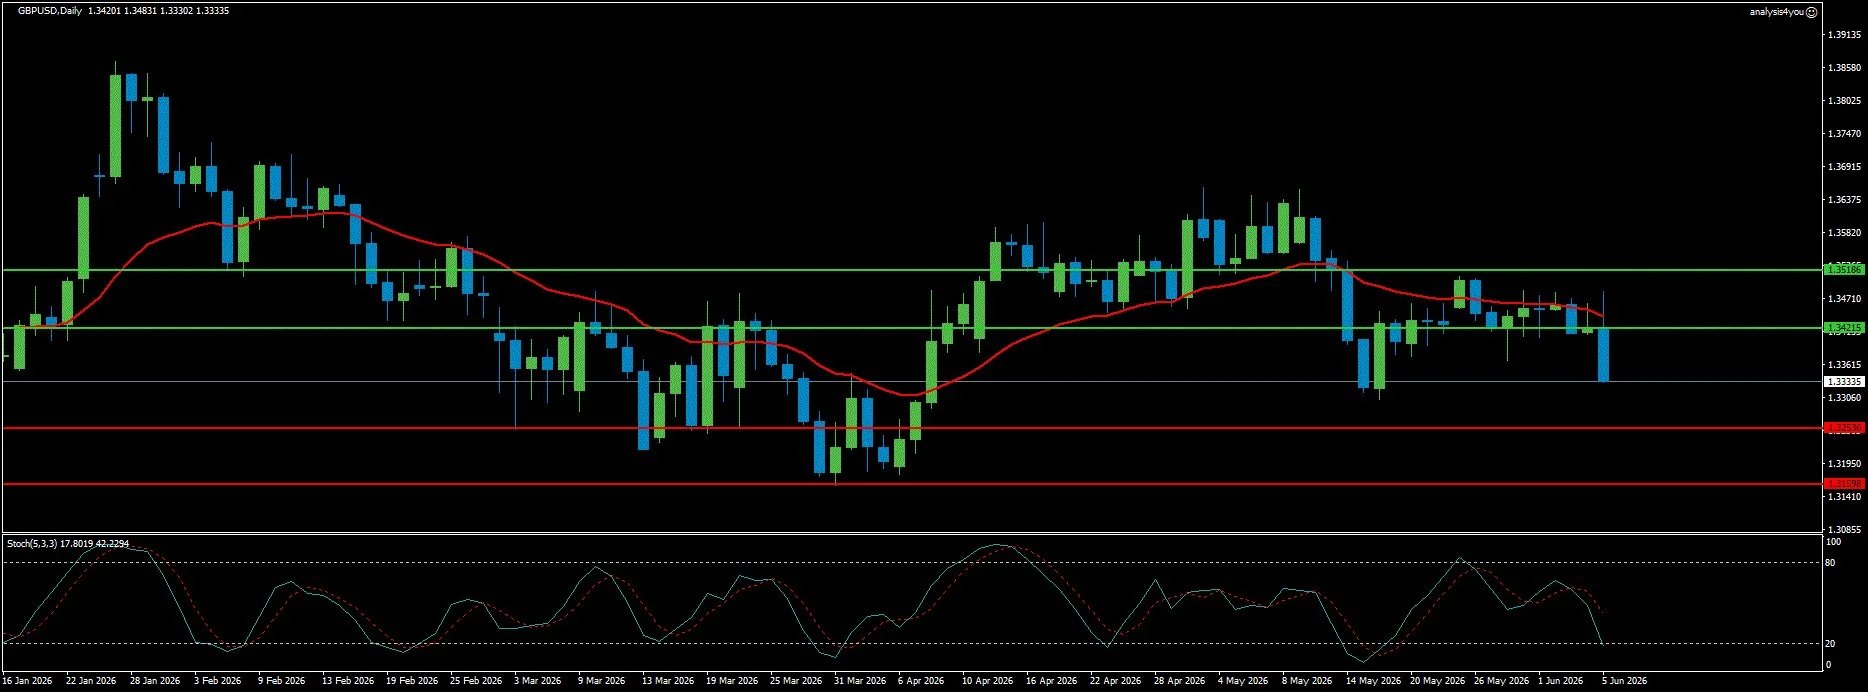
GBP/USD: Back Below All Three MAs, UK PMIs in Contraction (1.3334)
Current Trend: Bearish
Resistance: 1.3421 | 1.3519
Support: 1.3254 | 1.3160
GBP/USD has fallen back below all three major moving averages for the second time in three weeks (crashing from the 1.3455 recovery to 1.3334, the lowest level since early April). The UK fundamental picture deteriorated sharply. The S&P Global UK Services PMI fell into contraction territory for the first time in more than a year. The Composite PMI also slipped below the 50 threshold. Persistent input cost pressures add to concerns that inflation may remain sticky despite slowing activity (a stagflation signal for the UK that mirrors the Eurozone’s own dilemma). The political dimension remains the structural GBP discount. The June 18 UK by-election (where Andy Burnham could challenge Keir Starmer for the Labour leadership) is now just ten days away. UK 30-year Gilt yields remain elevated. The BoE meeting is also on June 18. Bailey has warned against waiting for second-round effects. The BoE is projecting UK inflation to breach 5% this year. With UK Services PMI now in contraction, the BoE faces the same stagflation dilemma as the ECB. Technically, GBP/USD is at 1.3334, below MA 20, MA 50, and MA 200. At lower Bollinger Bands. The Stochastic at 17.80/42.23 is deeply oversold in a downtrend with a bearish signal. Resistance at 1.3421. Support at 1.3254 / 1.3160.
Stocks
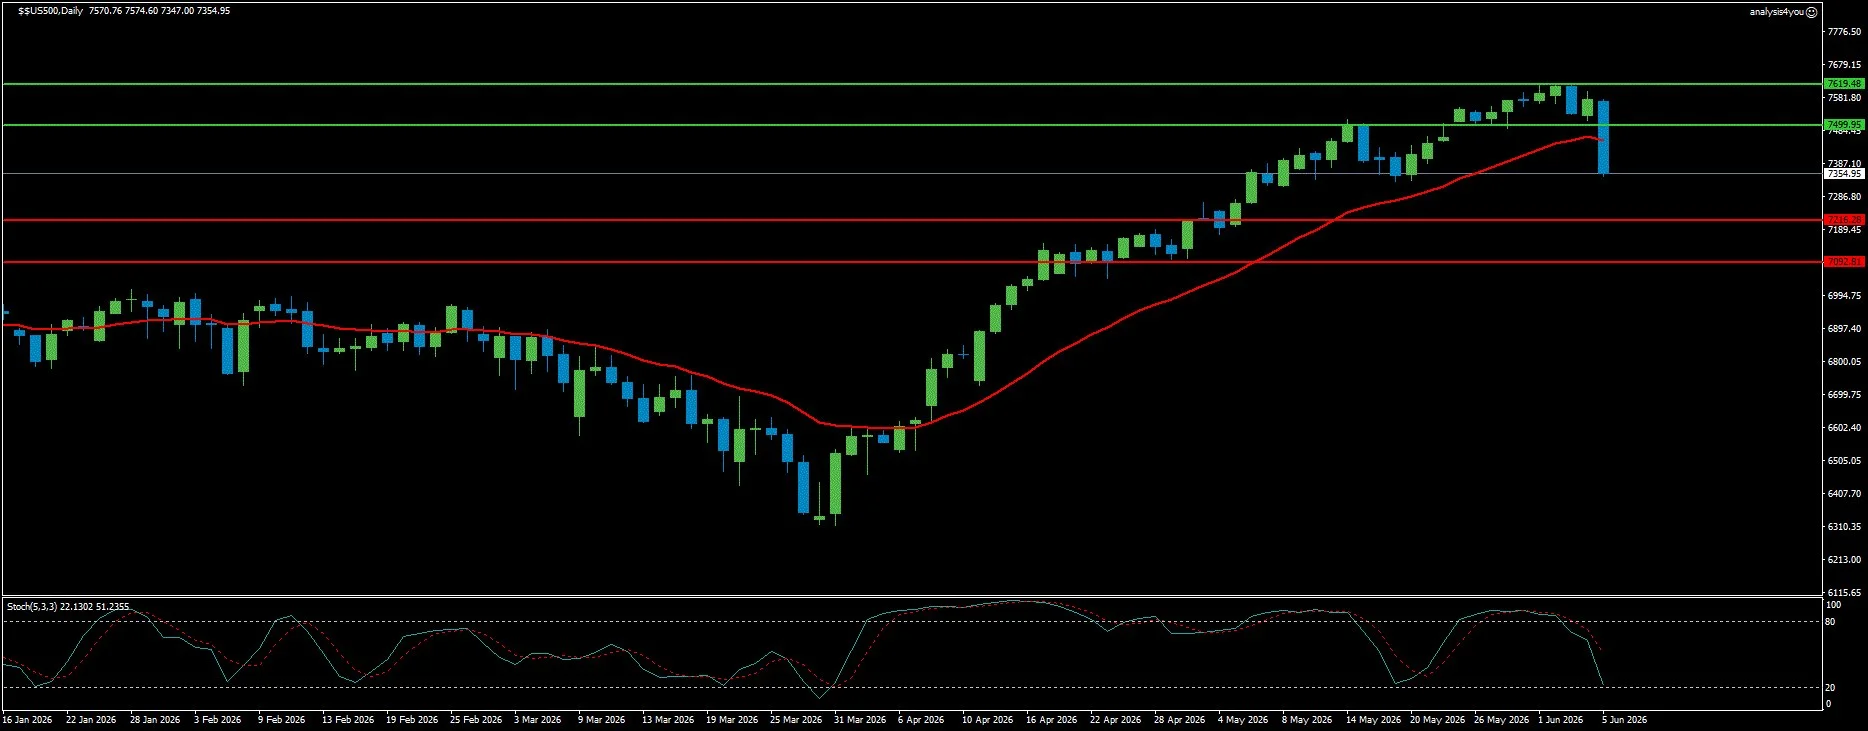
S&P 500: Nine-Week Streak Ended, NFP-Driven Crash, AI Trade Unwind (7,355)
Current Trend: Neutral to Bearish
Resistance: 7,500 | 7,619
Support: 7,216 | 7,093
The S&P 500’s nine-consecutive-week winning streak ended with its most brutal single-day performance since October. On June 5, the index fell 2.64% (the Nasdaq lost 4.18% in its worst session since April 2025). The catalyst: May NFP of 172K, more than double the 85K forecast, cemented market expectations for a Fed rate hike later in 2026 and drove two-year Treasury yields up 12 basis points to 4.16%. Higher risk-free rates delivered a cold shower to growth stocks (particularly the AI-related semiconductor names that had driven the nine-week rally). Despite the single-day crash, the US economy continues to display remarkable resilience: 100 days into the oil shock. ISM Manufacturing PMI at 54 and ISM Services at 54.5 both point to continued growth. The crash is a repricing of the rate environment, not evidence of fundamental economic deterioration. The S&P 500 is still above all three major moving averages (the MA has been sharply rising and provides dynamic support well below current price levels). The week ahead’s primary equity catalysts: Wednesday May CPI (determines whether the rate hike narrative intensifies or moderates) and Thursday ECB decision. Technically, the S&P 500 is at approximately 7,355, having crashed from the 7,580 ATH area with one of the largest single-day candles of the war period. Still above MA 20, MA 50, and MA 200. Resistance at 7,500 / 7,619. Support at 7,216 / 7,093.
Commodities
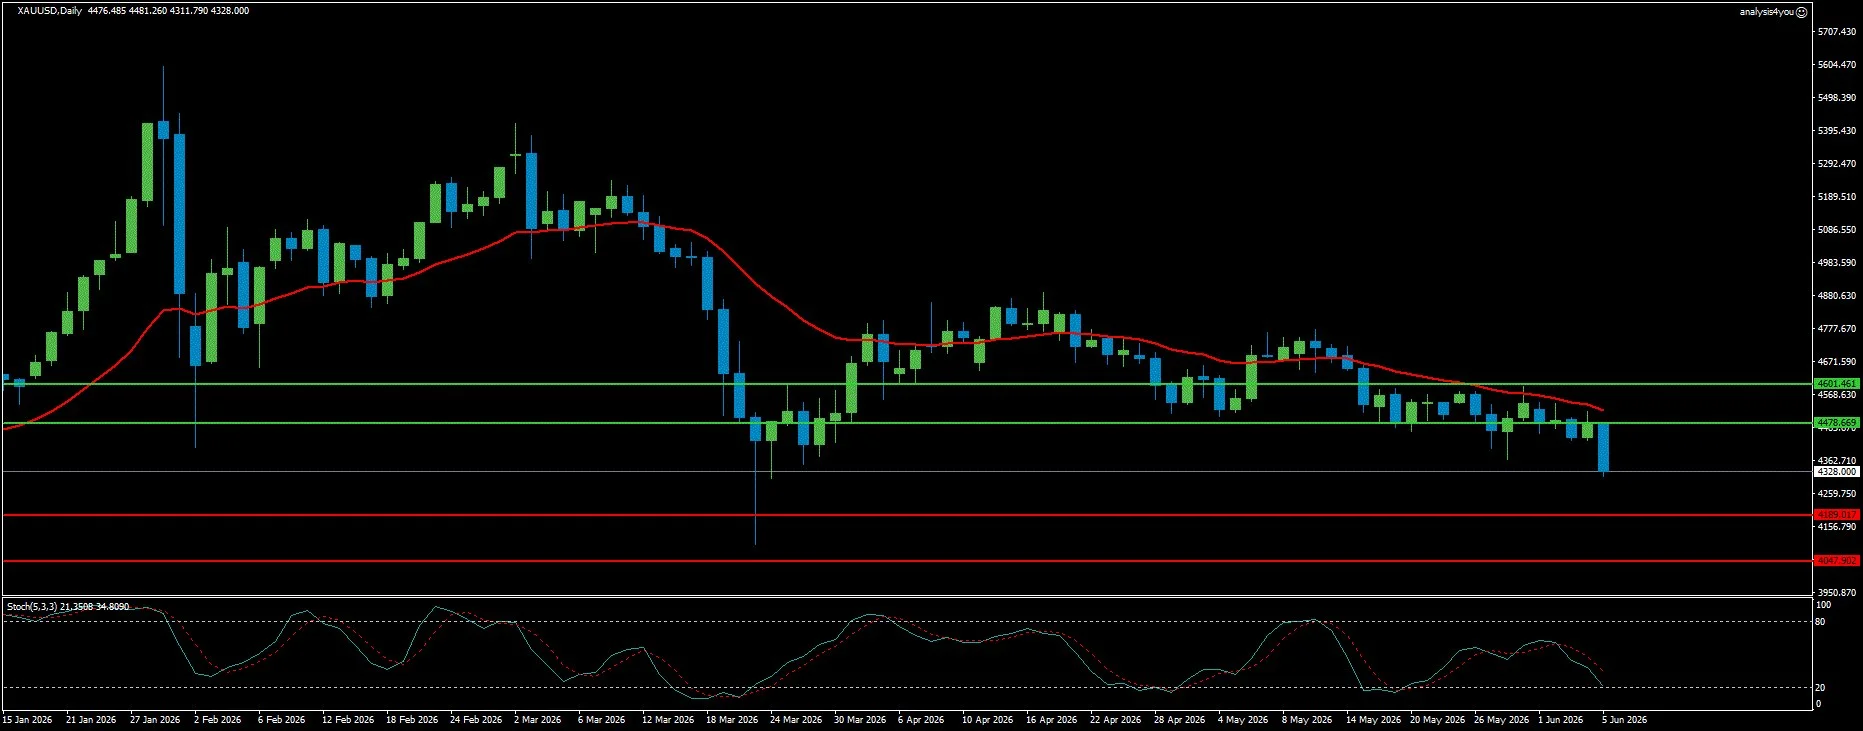
Gold: 200-Day SMA Broken, Bearish Breakout Confirmed, $4,000 in Sight (4,328)
Current Trend: Bearish
Resistance: 4,479 | 4,601
Support: 4,189 | 4,048
Gold has suffered its most decisive technical breakdown of the entire war period. The $4,380 to $4,400 support zone (the convergence of the 200-day SMA and the descending triangle base that had held for six weeks) has been broken decisively to the downside. At $4,328, Gold is now below MA 20, MA 50, and MA 200 simultaneously for the first time since the war began. The current bar is below lower Bollinger Bands. The bearish breakout has been confirmed: Gold dropped below the 200-day SMA and the bottom line of the descending triangle. The triple headwind is the most aligned it has been during the war. First, the NFP beat drove Fed rate hike probability to 60 to 70% by year-end. Second, two-year Treasury yields surged 12 basis points, raising the opportunity cost of holding Gold. Third, Iran’s Foreign Minister confirmed no tangible progress in negotiations (but WTI rebounded on re-escalation, and the re-escalation should theoretically be Gold-bullish). The paradox: Gold is being crushed by the very geopolitical factor that should theoretically be supporting it. May CPI on Wednesday is the last critical piece of information before the June 16 to 17 FOMC. A reading above the market forecast could feed into expectations for a hawkish Fed policy outlook. A softer-than-expected core CPI print could help XAU/USD stage a rebound. Technically, Gold is at $4,328, below lower Bollinger Bands. The Stochastic at 21.35/34.81 is deeply oversold in a downtrend with a bearish signal. Technical targets: $4,240 (Fibonacci 78.6%), $4,189 (DK_FinMa support), $4,048 (approaching $4,000). Resistance at $4,479 (the broken support now acts as resistance).
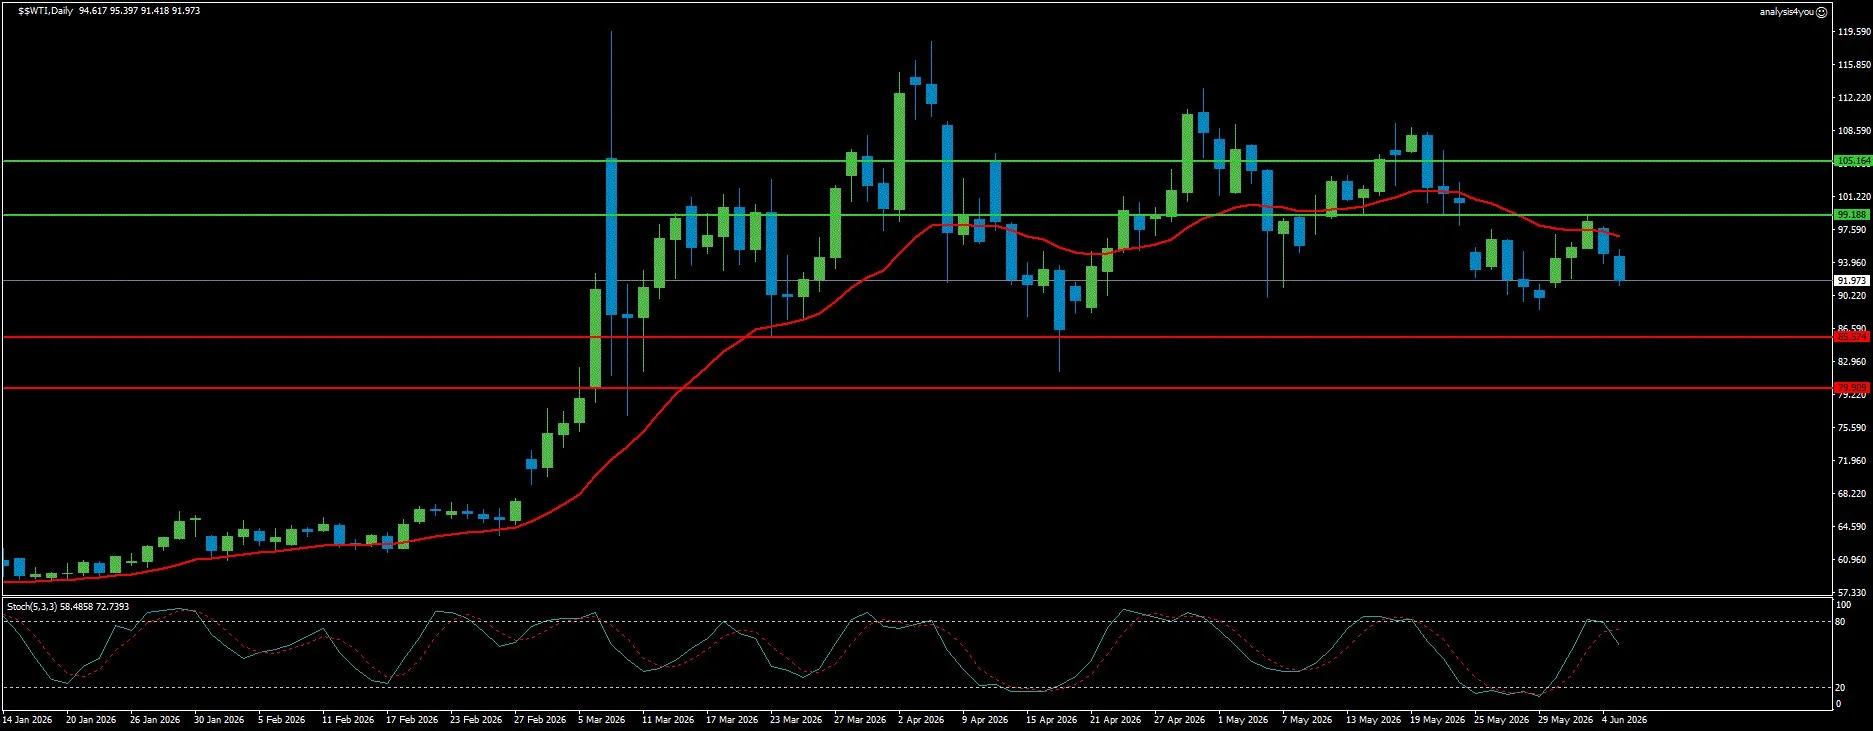
WTI Crude Oil: Re-escalation Bounce Confirmed, 95.4-95.5 Is the Week’s Pivot (91.97)
Current Trend: Cautiously Bullish
Resistance: 99.19 | 105.16
Support: 85.57 | 79.91
WTI crude oil staged a powerful recovery during the prior week (rebounding over 6% from the peace-deal lows of $87 to $90 back toward $92 to $96). The re-escalation narrative is back in full force. Iran’s negotiating team stopped exchanging messages through mediators in protest against Israel’s renewed attacks on Lebanon. CENTCOM launched self-defense strikes on Iran’s Qeshm Island. Iran launched drone attacks on US forces in Kuwait. Mattel’s shipping intelligence maintained the HIGH STRESS classification across all key energy corridors. The market has reassigned the war premium that had been partially removed during the MOU optimism. Even if the MOU is eventually formalized, full Hormuz flows will not return before Q1 to Q2 2027. The Stochastic has reversed from the most extreme oversold reading of the series (12.39/14.38) to mid-range (58.49/72.74) in a single week (the most dramatic single-week Stochastic reversal of any instrument in the series). Technically, WTI is at approximately $92, with middle Bollinger Bands. The Stochastic at 58.49/72.74 is mid-range in an uptrend with a bullish signal. Mattel’s participation pivot at $95.4 to $95.5 is the week’s primary balance level. Resistance at 99.19 / 105.16. Support at 85.57 / 79.91.
Crypto
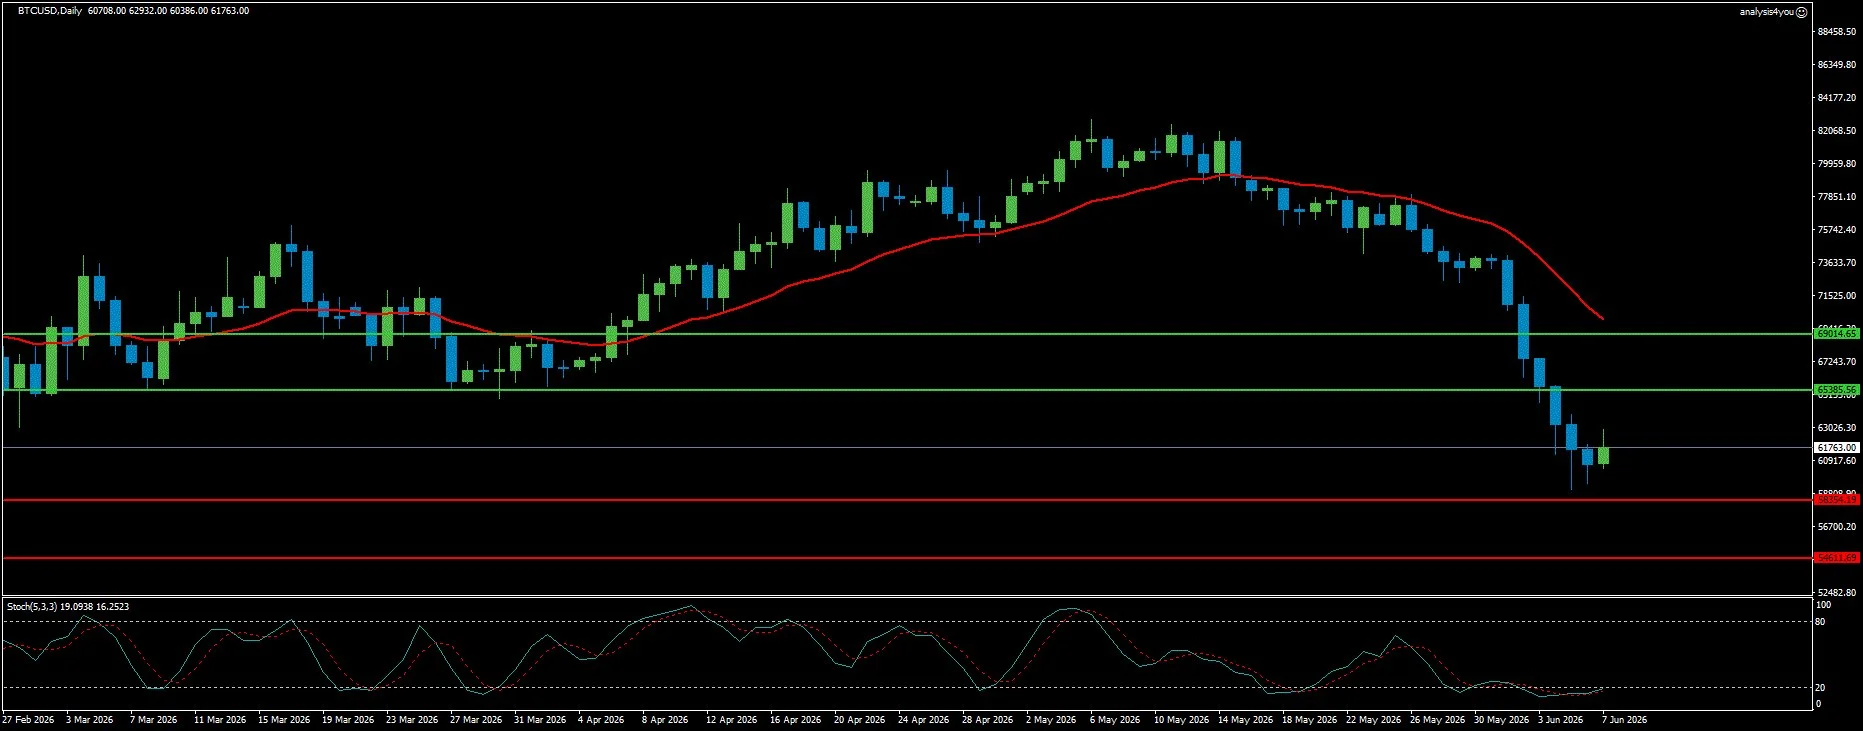
Bitcoin: Bloodbath Below $60,000, Fourth Consecutive $1B+ ETF Outflow Week (61,763)
Current Trend: Bearish
Resistance: 65,386 | 69,015
Support: 58,354 | 54,612
Bitcoin experienced a bloodbath (crashing from $73,865 last week to $61,763, a $12,102 loss representing the single most severe weekly decline of the war period). The $60,000 psychological level was briefly breached, with BTC touching levels not seen since February. Liquidations reached approximately $2.45 billion. Spot BTC ETFs recorded outflows of $1.40 billion through Thursday (the fourth consecutive week of over $1 billion in outflows, with cumulative four-week outflows exceeding $5 billion). Bitcoin Exchange Reserves on Binance rose from approximately 616,000 BTC to slightly above 660,000 BTC (investors are transferring assets to exchanges, ready to sell). The $60,000 level still matters because the market has already seen buyers step in there before. For that level to hold, buyers need to defend it over several sessions while ETF flows stabilize. Otherwise, a break below $60,000 would put $58,000 and the mid-$50,000s back on the table. The macro headwinds remain formidable. Fed rate hike probability at 60 to 70% by year-end reduces risk appetite. US two-year yields at 4.16% (post-NFP surge) are meaningful enough to influence institutional allocation decisions. The bullish Stochastic (19.09/16.25 in an uptrend with a bullish signal) combined with the bullish current bar suggests the worst of the NFP liquidation cascade may have passed. Technically, BTC is at $61,763. The Stochastic at 19.09/16.25 is deeply oversold in an uptrend with a bullish signal (the only genuinely bullish technical configuration in the current chart set). Resistance at $65,386 / $69,015. Support at $58,354 / $54,612.
Key Events (June 8-12, 2026)
Monday, June 8: Markets open digesting the NFP aftermath. No major scheduled data. Iran developments over the weekend set the opening tone.
Tuesday, June 9: US May NFIB Small Business Optimism. Further positioning ahead of the week’s two defining events.
Wednesday, June 11: US May CPI (THE WEEK’S MOST IMPORTANT SCHEDULED DATA RELEASE). Forecast at 4.2% YoY. Monthly CPI forecast at +0.5%. Core CPI forecast at +0.3% MoM. US May PPI also released. Fed is in the blackout period.
Thursday, June 12: ECB Monetary Policy Decision (THE WEEK’S DEFINING CENTRAL BANK EVENT). The first ECB rate hike in years, widely expected and fully priced. Critical market question: is July also live? Lagarde’s press conference guidance defines EUR direction. US Initial Jobless Claims.
Friday, June 13: University of Michigan Consumer Sentiment June preliminary. US May Import and Export Prices. Markets close positioned for the June 16 to 17 FOMC (Warsh’s first meeting as Chair).
Week Ahead Outlook
The week of June 8 to 12 is defined by the collision between three simultaneous forces: the Fed’s blackout silence, the ECB’s first rate hike in years, and May CPI on Wednesday (the last major data point before the June 16 to 17 FOMC).
Scenario 1: Hot May CPI + ECB Hawkish Guidance + Iran Stalemate (approximately 40%): May CPI prints at 4.2% or above. ECB hikes and signals July is live. Iran situation remains deadlocked. DXY breaks above 100.00 toward 100.67. EUR/USD breaks below 1.1470 toward 1.1409 then 1.1200. GBP/USD breaks below 1.3254 toward 1.3160. Gold extends decline toward $4,240. WTI holds $92 to $97 on re-escalation. BTC breaks below $60,000 again, testing $58,354. S&P 500 falls toward 7,216. This is the most likely scenario given the data trajectory.
Scenario 2: In-line CPI + ECB Hike + Partial Iran Progress (approximately 35%): May CPI at 4.0% to 4.2% (broadly in line, core at 0.3% MoM). ECB hikes and delivers neutral guidance (July conditional). Iran talks show limited but real progress. DXY consolidates 99.03 to 100.67. EUR/USD stabilizes 1.1409 to 1.1577. Gold finds floor near $4,240. WTI holds $92 to $97 range. BTC stabilizes $60,000 to $65,386. S&P 500 recovers partially toward 7,500.
Scenario 3: Soft CPI + ECB Hike + Iran Breakthrough (approximately 25%): May CPI decelerates significantly (headline at 3.8% to 4.0%, core at 0.2% MoM). ECB hikes and signals one-and-done. Iran announces genuine MOU progress. WTI crashes below $90. Fed rate hike probability falls from 70% to below 50%. DXY reverses toward 99.03. EUR/USD bounces toward 1.1577. Gold surges back above $4,400. BTC recovers above $65,386. S&P 500 surges toward ATH zone 7,499 to 7,619.
Bottom line: Fourteen weeks into the Iran war, the market has entered its most contradictory phase. The US economy is defying the rules (100 days into the oil shock, the recession signal is still missing). But the very resilience of that economy is now the market’s enemy, because it validates the case for Fed rate hikes that crush risk assets, strengthen the Dollar, and extend Gold’s malaise. The ECB’s first hike in years simultaneously confirms that stagflation is not a risk but a reality across the developed world. The five-day week of June 8 to 12 will answer three critical questions: Is May inflation still accelerating? Will the ECB signal further hikes or retreat to one-and-done? And will the Iran MOU find a path to formal ratification before Warsh chairs his first FOMC on June 16?

