S&P 500 Breaks New ATH Above $7,000, Ceasefire Expires Tuesday

Market Sentiment Overview
The week of April 20 to 24 opens at a genuinely historic juncture in the seven-week Iran war. The Strait of Hormuz (closed since February 28) has been declared fully open for commercial vessels by Iran’s Foreign Minister Araghchi, tied to the 10-day Israel-Lebanon ceasefire announced by Trump on Thursday April 17. The market reaction was immediate and dramatic: WTI crude crashed nearly 10% in a single session, the S&P 500 broke to new all-time highs above $7,000, Bitcoin surged above $75,000, the US Dollar fell to its lowest levels since early March, and EUR/USD posted its third consecutive weekly gain approaching 1.1840. But the optimism is running ahead of confirmed facts. The ceasefire expires April 22 (this Tuesday). The US naval blockade of Iranian ports remains in full force. Iran’s State TV qualified the opening by stating commercial vessels must pass through a certain route with permission of the Revolutionary Guards. A second round of US-Iran talks is expected this weekend. Gulf Arab and European leaders believe a genuine peace deal will take approximately six months. The Islamabad talks produced no breakthrough (21 hours of negotiations, no deal). This weekend’s talks are the most important scheduled event for every asset class.
Currencies
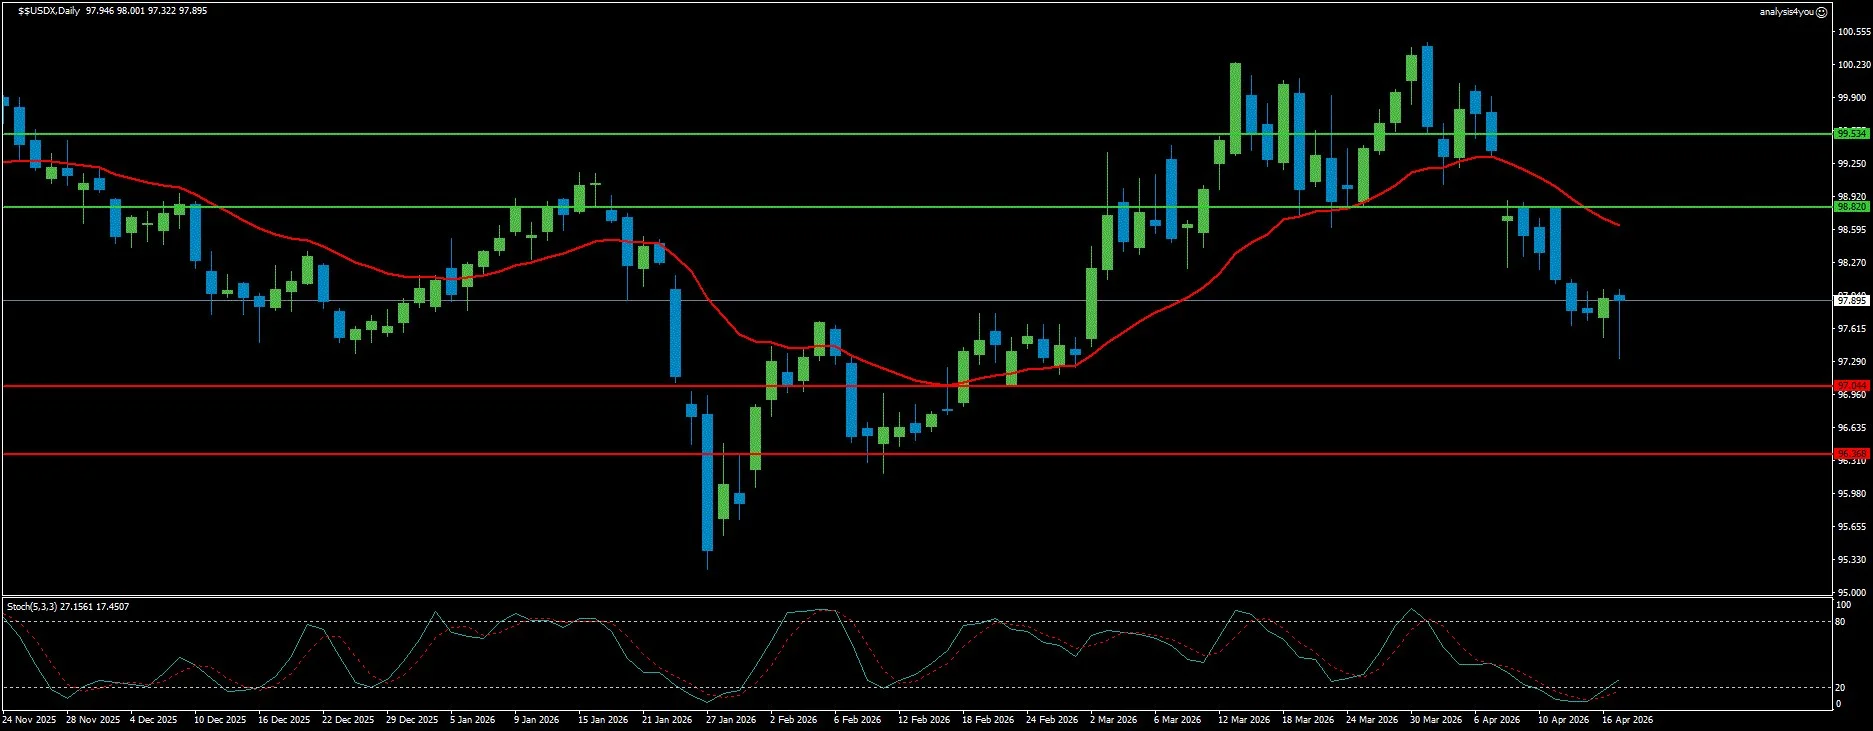
USD Index: Structurally Broken, Macro Back in Focus (97.90)
Current Trend: Bearish
Market Sentiment: Risk-On Driven
Resistance: 98.82 | 99.53
Support: 97.04 | 96.37
The US Dollar has now given back virtually all of its war-driven gains from the past seven weeks. DXY at 97.90 has fallen from the 100.41 war-peak to levels last seen in early March (a decline of over 250 points in two weeks). The Dollar will trade off rate differentials once again, keeping DXY within the middle of its nearly one-year 96.00 to 100.00 range. Structurally, bearish USD view persists because of fading confidence in US trade and security policy, worsening US fiscal credibility, and the ongoing politicization of the Fed. Investors are drawing parallels with the 1970s, when a Fed chair loyal to the White House eased monetary policy during an oil shock, resulting in sharper price rises and entrenched high inflation expectations (and a collapsing Dollar). The nomination of Kevin Warsh as Powell’s replacement is the week’s defining domestic event. Warsh’s Senate confirmation hearing on Tuesday April 22 will be scrutinized for his likely policy stance. The 1970s parallel (will Warsh prioritize supporting the economy or maintaining the Fed’s inflation-fighting credibility?) is the question investors are asking. The Fed blackout period began Saturday April 18 (no Fed speakers all week ahead of the April 28 to 29 decision, creating a vacuum that leaves the Dollar dependent entirely on geopolitical headlines and Warsh’s testimony). Technically, DXY has fallen sharply from 100.41, broken decisively below the 200-day SMA, and the MA has rolled over into a downward slope. The Stochastic at 27.16/17.45 is at its most oversold reading in months. Resistance at 98.82 is the immediate ceiling. On the downside, 97.04 is the first meaningful support, with 96.37 the deeper floor.
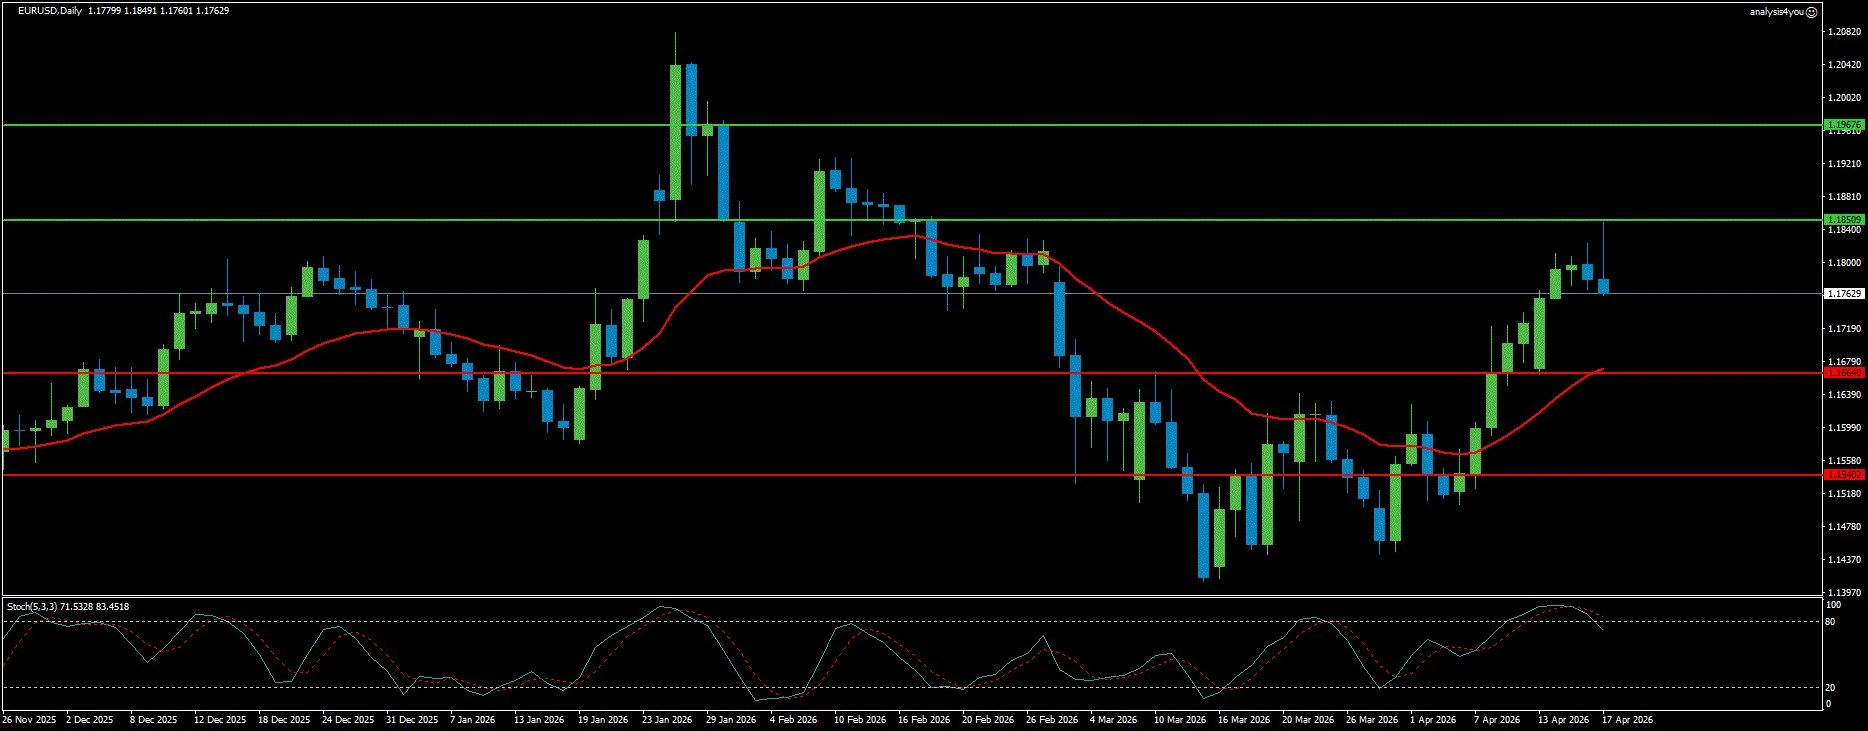
EUR/USD: Third Consecutive Weekly Gain, Bulls Eye 1.2000 (1.1763)
Current Trend: Bullish
Market Sentiment: Constructive
Resistance: 1.1851 | 1.1968
Support: 1.1664 | 1.1540
EUR/USD has closed its third consecutive week with gains, reaching its highest level since late February near 1.1840. The pair has now reclaimed all moving averages (with the 20-day SMA heading firmly north below the longer ones at 1.1633, and price comfortably above the 100-day SMA at 1.1704 and the 200-day SMA at 1.1633). The Momentum indicator aims firmly north within positive levels, while the RSI in the mid-60s supports another leg higher. Buyers could aim for 1.2000 on continued Dollar weakness and ceasefire-driven risk appetite. ECB officials are more aligned than Fed ones, broadly agreeing on the need to act if inflation continues to escalate. Eurozone HICP revised to 2.6% (above target but below the feared 3%+ scenario). The euro benefits from the structural rotation away from the Dollar as geopolitical risk fades. Warsh’s Senate testimony Tuesday is the most important event for EUR/USD by inverse correlation (a hawkish Warsh supports USD and pressures EUR, while a dovish or politically uncertain hearing reinforces EUR gains). Flash PMIs on Thursday for both the Eurozone and US are the week’s key economic assessment. Technically, EUR/USD extends its recovery above all major moving averages with a firmly constructive near-term bias. The Stochastic at 71.53/83.45 is in the upper range but not yet at extreme overbought levels (there is room to push further). The Fibonacci 61.8% retracement zone at 1.1823 to 1.1828 has been tested and partially broken. Resistance at 1.1851 is the immediate ceiling (a clean daily close above this level opens the path toward 1.1968 and eventually 1.2000). On the downside, 1.1664 is now the first meaningful support.
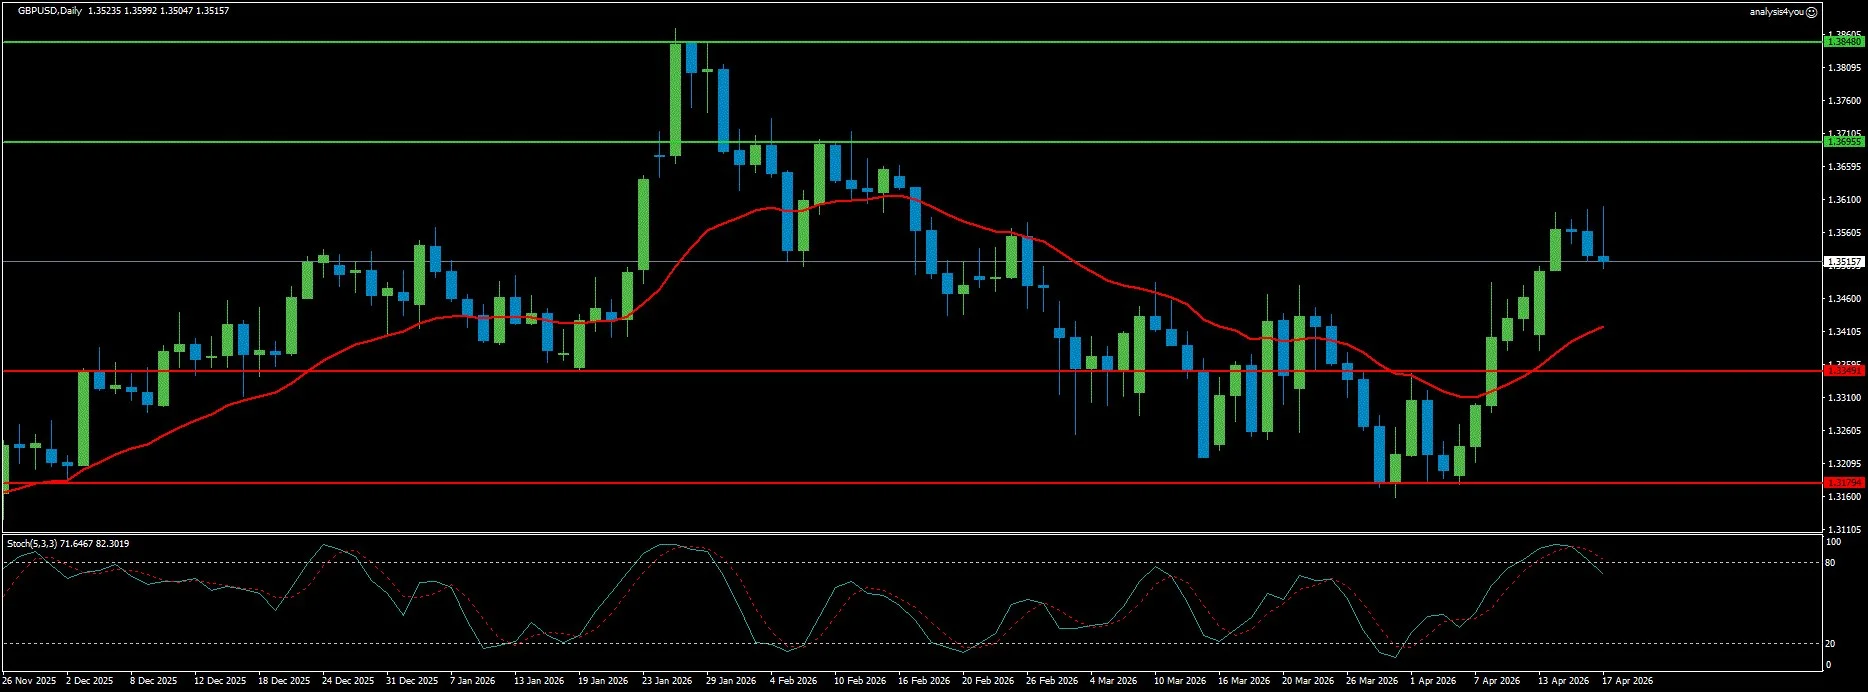
GBP/USD: Big Week Ahead (Jobs, CPI, PMIs, Retail Sales) (1.3516)
Current Trend: Bullish
Market Sentiment: Constructive
Resistance: 1.3695 | 1.3848
Support: 1.3349 | 1.3179
GBP/USD posted its second consecutive weekly gain, refreshing two-month highs near 1.3600 before sellers emerged at the triple top resistance. The week ahead is unambiguously the most data-heavy UK week of the entire war period (four major UK releases in five days). Tuesday brings the UK labour market report: unemployment has risen to 5.2% and any further increase reduces pressure on the BoE to hike rates. Wednesday delivers UK March CPI (this is the first inflation reading that will capture the energy shock from the war’s onset and is almost certain to show a sharp reversal of the cooling trend). Thursday brings UK and US flash PMIs. Friday rounds off with UK Retail Sales. The BoE rate outlook is being recalibrated in real time. The market has settled on approximately two hikes as the base case. UK CPI on Wednesday is the single most important release and will determine whether GBP breaks above the 1.3600 triple top or retreats toward the SMA cluster. Technically, GBP/USD trades at 1.3516, maintaining its constructive bullish bias above the dense SMA support cluster at 1.3375 to 1.3450. The Stochastic at 71.65/82.30 is approaching overbought territory. The triple top resistance just below 1.3600 has proven resilient. Resistance at 1.3695 is the fresh level above the triple top (a break here represents a genuine structural breakout and opens 1.3848). Below, the SMA cluster at 1.3375 to 1.3450 provides formidable support.
Stocks
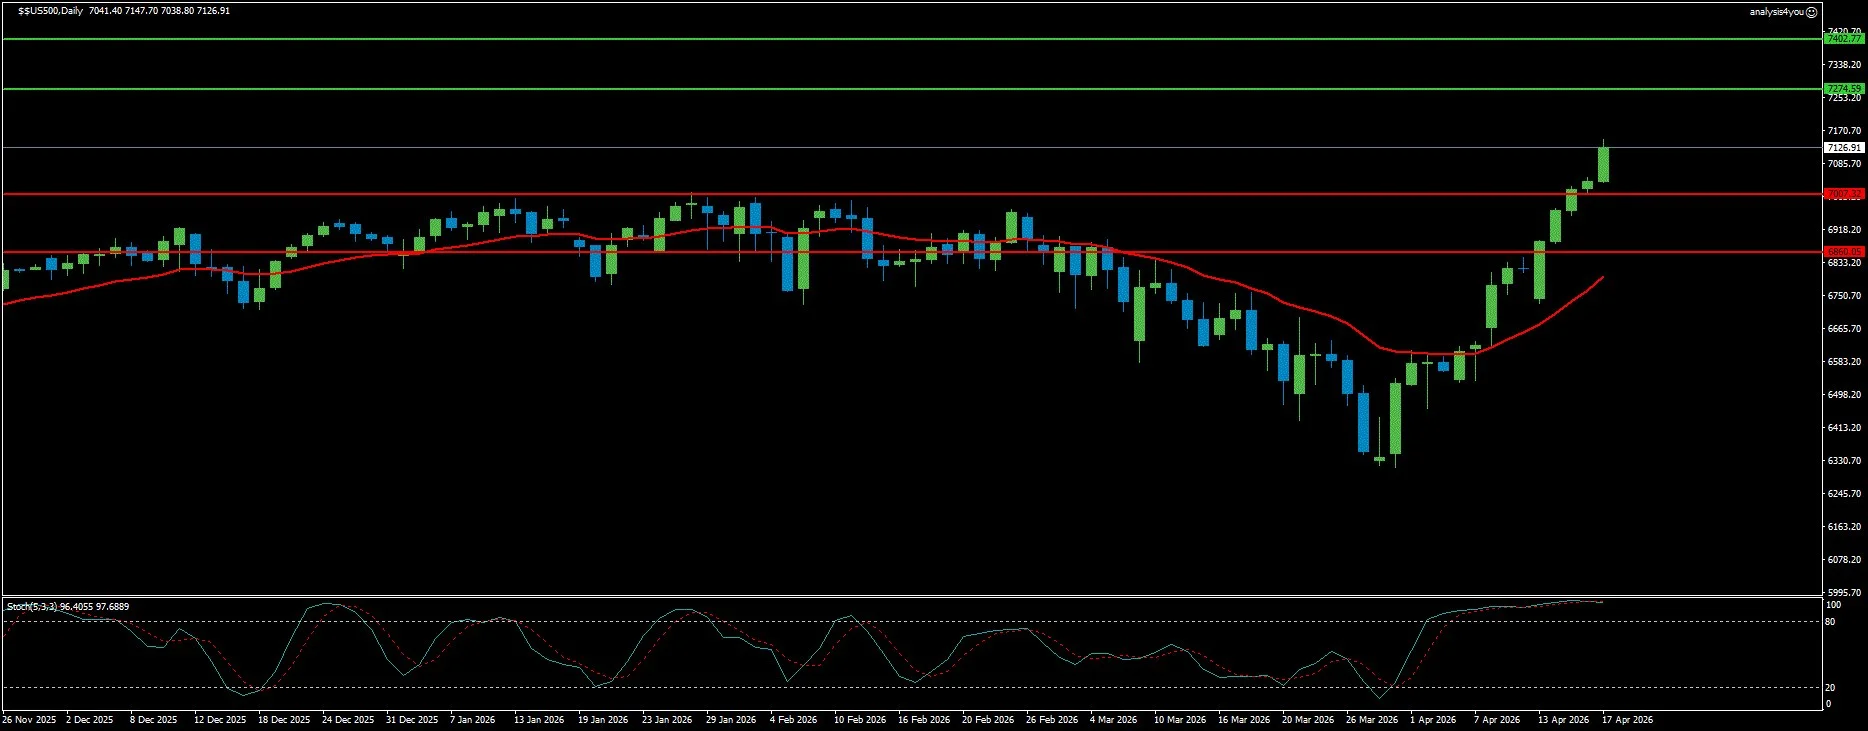
S&P 500: New All-Time High Above $7,000, But Built on Fragile Foundations (7,127)
Current Trend: Bullish (Extreme Overbought)
Market Sentiment: Euphoric
Resistance: 7,275 | 7,403
Support: 7,007 | 6,860
The S&P 500 has achieved the remarkable: a new all-time high above $7,000 just three weeks after testing six-month lows at 6,350 during the peak of the war escalation. The index is at 7,127 (a gain of over 770 points from the war low, representing a 12%+ recovery in less than a month). The drivers are clear: the Israel-Lebanon ceasefire, Iran’s Hormuz reopening declaration, Trump’s repeated signals that the war is close to ending, strong Q1 bank earnings, and China’s Q1 GDP beat at 5.0% YoY. Equities are at greater risk of a correction, as Wall Street has notched up new record highs even before there has been an agreement on how to bring a permanent end to the Middle East conflict. The ceasefire expires April 22 (this Tuesday). Any setback in the push for peace could easily push oil prices back above $100. The S&P 500 has not priced in a scenario where fresh negotiations fail again. The Stochastic at 96.41/97.69 is the most overbought reading across all seven instruments and the most extreme reading on the S&P 500 chart since January’s ATH. The prior ATH was followed by a war-driven crash of over 600 points. Technically, price has reclaimed the declining MA, broken above the January ATH zone of 7,002, and is now trading at 7,127. The Stochastic at 96.41/97.69 is at its most overbought reading since January (a warning signal that the pace of the recovery is extreme and a consolidation or sharp pullback is overdue). Resistance at 7,275 is the immediate target. On the downside, the psychological 7,000 level and the chart support at 7,007 are now the critical floor.
Commodities
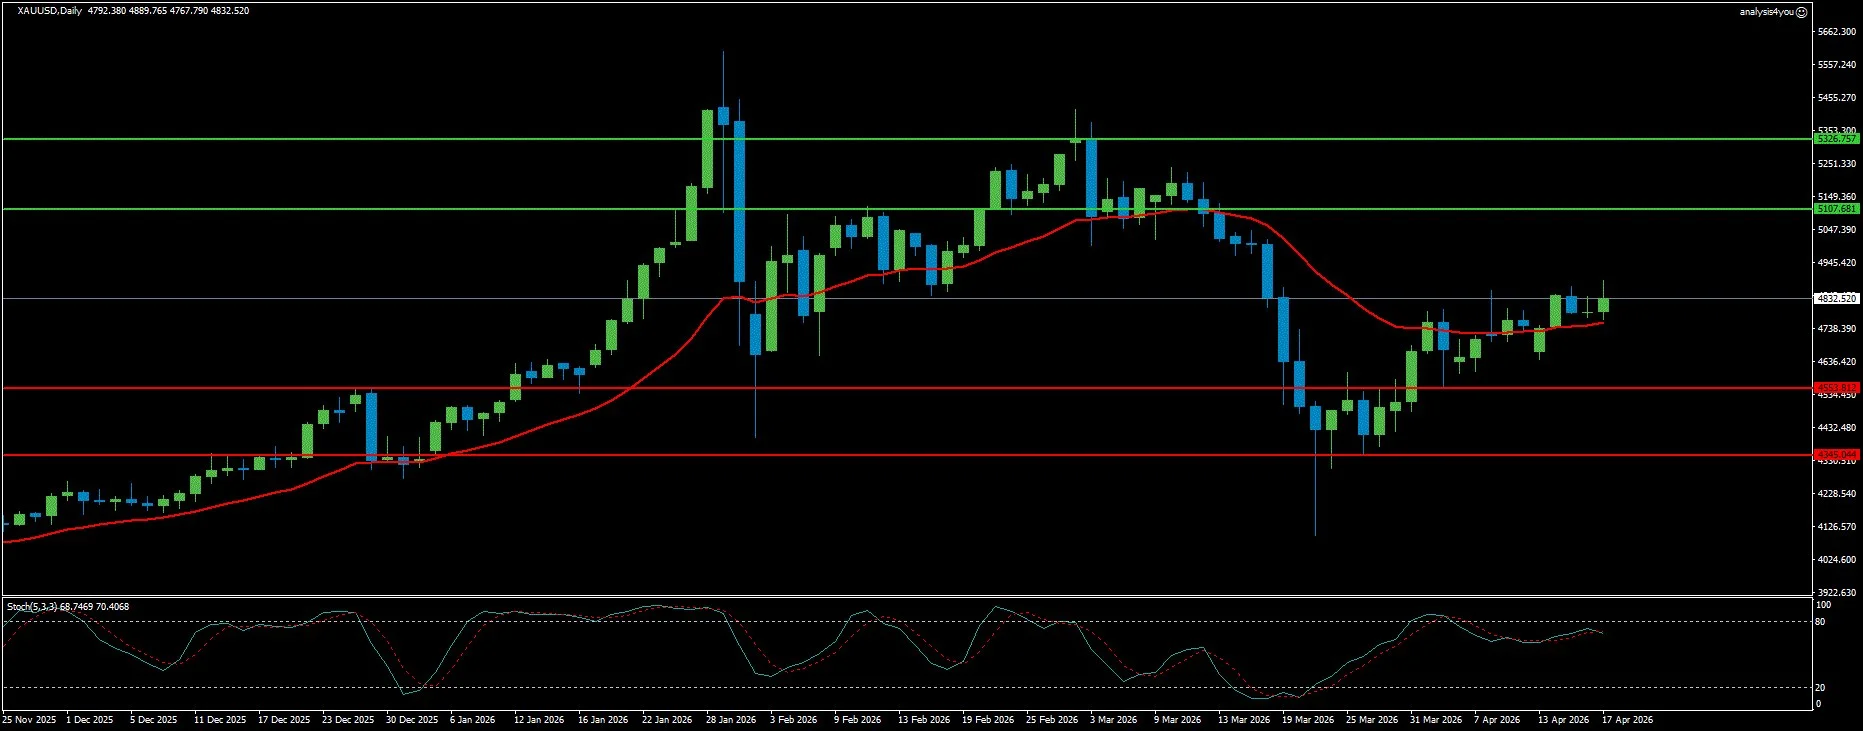
Gold: Bulls Pressing Critical Pivot, Oil-Inflation Link Drives (4,833)
Current Trend: Bullish
Market Sentiment: Constructive
Resistance: 5,108 | 5,327
Support: 4,554 | 4,345
Gold has risen for the second consecutive week, climbing from $4,749 to $4,833 (now pressing directly against the critical $4,865 to $4,900 Fibonacci 38.2%/50-day SMA pivot zone). The sharp correction in WTI prices (down nearly 20% since the temporary truce was reached) eased concerns over a permanent increase in global inflation and allowed investors to reassess the Fed’s policy outlook. CME FedWatch now shows zero probability of a rate hike this year and approximately 52% probability of the Fed leaving rates unchanged through end-2026. This dovish reassessment reduces the opportunity cost of holding Gold. If sides agree to fully open the strait, risk flows could continue and pave the way for another leg lower in oil. In this scenario, Gold gathers further bullish momentum. Technically, Gold approaches the $4,865 to $4,900 pivot zone from below. The 100-day SMA at approximately $4,715 has been cleanly reclaimed and is now dynamic support. The Stochastic at 68.75/70.41 is in the upper half of its range without being overbought (the healthiest momentum reading for a continued rally). A decisive break and close above $4,900 confirms the pivot zone has been cleared and opens the path toward $5,000 and $5,108.
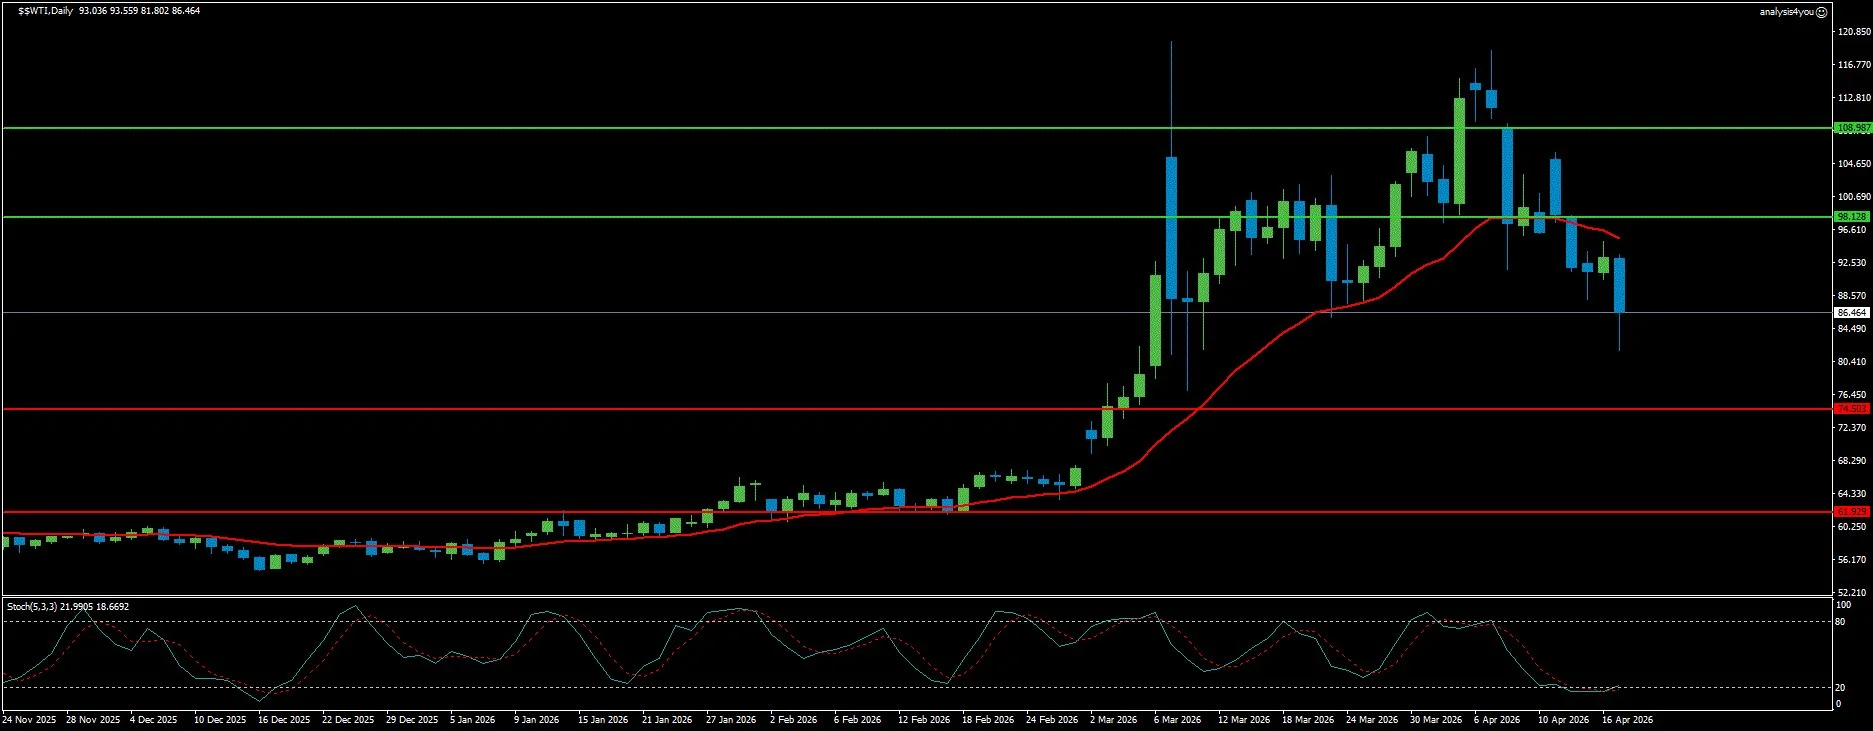
WTI Crude Oil: Hormuz Crash Changes the Game, Bears Test $80 (86.46)
Current Trend: Bearish
Market Sentiment: Risk-On
Resistance: 98.13 | 108.99
Support: 74.50 | 61.93
WTI crude oil has undergone its second massive weekly decline in three weeks, crashing from $96.20 to $86.46 (a drop of nearly $10) as Iran’s full Hormuz reopening announcement triggered an immediate 10% daily crash in Brent crude on Friday. The commodity is now down nearly 23% from its $112+ war peak. Bears have broken the psychological $90 level and dented the important Fibonacci 50% retracement at $87.16. A weekly close below these levels confirms the bearish signal and exposes targets at $84.70 to $84.50, $81.91 (Fibonacci 61.8%), and the psychological $80. The ceasefire expiry on Tuesday April 22 is the critical near-term event for oil. If the ceasefire is extended or a permanent framework is agreed, WTI extends the decline toward $80 and eventually $74.50. If the ceasefire expires without renewal and military action resumes, oil spikes back above $98 resistance toward $108. Technically, WTI has broken decisively through the $87.16 Fibonacci 50% support and is trading at $86.46. The Stochastic at 21.99/18.67 is at its most oversold reading since before the war began (technically extreme, warning of a potential bounce but not a reversal). Immediate downside targets: $84.70 to $84.50, then $81.91, and the psychological $80.00.
Crypto
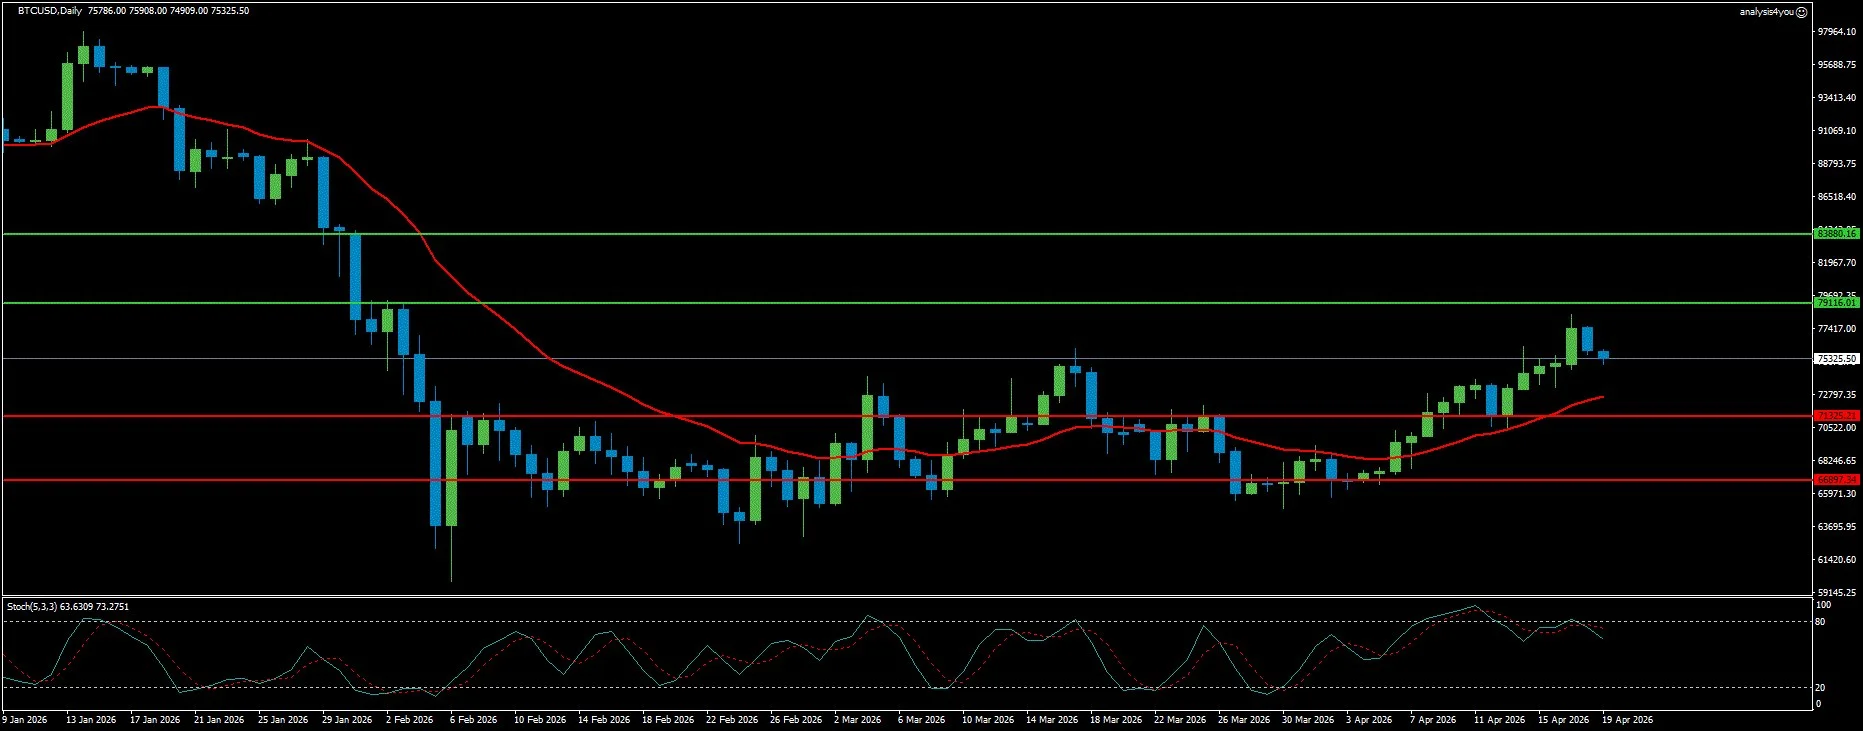
Bitcoin: Textbook Breakout Confirmed, Traders’ Realized Price Resistance Ahead (75,325)
Current Trend: Bullish
Market Sentiment: Constructive
Resistance: 79,116 | 83,880
Support: 71,325 | 66,897
Bitcoin has completed a textbook breakout move. The ascending triangle pattern that had been building since early February broke above its upper trendline at $73,400, BTC hit a two-month high of $76,038 on Tuesday, successfully retested the $73,400 breakout level as support, and is now trading at $75,325. Spot Bitcoin ETFs recorded $332.46 million in net inflows through Thursday (the third consecutive week of positive flows). Strategy purchased 13,927 BTC for $1 billion (its most aggressive single purchase since the war began). Morgan Stanley’s Bitcoin Trust (MSBT) is live on the NYSE. BTC is now approaching the Traders’ Realized Price at approximately $75,000 to $76,800 (historically described as a major bear market resistance level). Large deposits increased from less than 10% to more than 40% of total exchange inflows within days, indicating institutional distribution. The short-squeeze setup remains a powerful force. K33 Research reported 46 consecutive days of negative funding rates (a historically extreme regime that has preceded significant rallies). Technically, BTC is at $75,325 having completed a textbook breakout-and-retest setup from the ascending triangle. The Stochastic at 63.63/73.28 is in the upper range without being overbought (the healthiest, most measured momentum reading of all seven instruments this week). The critical near-term resistance zone is $75,000 to $76,800 (Traders’ Realized Price). A decisive daily close above $76,800 opens the path toward $79,116 and eventually $83,880.
Key Events This Week (April 20-24, 2026)
Weekend (April 19-20): Second round of US-Iran talks expected.
Monday, April 20: Germany PPI March. Light US calendar.
Tuesday, April 21: CEASEFIRE EXPIRES. Kevin Warsh Senate Confirmation Hearing. US Retail Sales March. UK Labour Market Report.
Wednesday, April 22: UK CPI March (CRITICAL for GBP and BoE expectations). ECB speakers.
Thursday, April 23: Flash April PMIs for France, Germany, Eurozone, UK, and US (most important economic data event). US Initial Jobless Claims.
Friday, April 24: UK Retail Sales March. Germany IFO Survey April. US Michigan Consumer Sentiment.
Week Ahead Outlook
The week of April 20 to 24 is the most consequential of the entire war period: Tuesday April 22 is when the ceasefire expires. The market has positioned for de-escalation across every asset class.
Scenario 1: Ceasefire Extended or Peace Framework (approximately 50%): Talks produce either an extension or a framework for permanent negotiations. DXY extends decline toward 97.04 and 96.37. EUR/USD breaks 1.1851 targeting 1.1968. GBP/USD breaks 1.3695. S&P 500 holds 7,000+ targeting 7,275. WTI extends decline toward $84.50 and $80. Gold breaks $4,900 targeting $5,000. Bitcoin clears $76,800 targeting $79,116.
Scenario 2: Ceasefire Expires, Talks Stall (approximately 35%): The ceasefire expires without a clear extension or framework. Oil spikes back toward $95 to $98. DXY bounces toward 98.82. EUR/USD consolidates 1.1664 to 1.1851. S&P 500 pulls back toward 7,007 to 7,050. Gold holds $4,715 to $4,865 range. Bitcoin pulls back toward $73,400.
Scenario 3: Ceasefire Breakdown (approximately 15%): Talks fail completely, Trump resumes military strikes. DXY spikes through 98.82. EUR/USD crashes below 1.1664. S&P 500 gaps below 7,000. WTI spikes back above $98. Bitcoin flash-crashes below $71,325.
Bottom line: The war premium is being systematically removed from markets. Tuesday April 22 is the moment of truth. The one instrument with the best technical setup for continuation (with mid-range Stochastics, confirmed breakout structure, institutional inflow support, and a short-squeeze setup) is Bitcoin. The one instrument most vulnerable to a sharp reversal on any geopolitical shock (with Stochastic at 96/97 and new ATH based on unconfirmed peace) is the S&P 500.

