US-Iran Ceasefire Triggers Regime Shift: USDX Breaks 200-Day SMA, S&P 500 Recovers 460 Points
Market Sentiment Overview
The week of April 13 to 17 opens in a fundamentally different market regime from any point in the past six weeks. The US-Iran two-week ceasefire (brokered with Pakistan’s mediation and announced by Trump late Tuesday April 8) has triggered the most dramatic cross-asset repricing since the war began on February 28. The US Dollar Index has broken below its 200-day SMA to multi-week lows at 98.37. EUR/USD has surged above all major moving averages to 1.1725. GBP/USD posted its biggest weekly gain in 11 weeks. The S&P 500 has recovered over 460 points from its war lows. WTI crude has crashed from $112 to $96, breaking below $100 for the first time since the war. Bitcoin has surged above $71,500 approaching key resistance. But the market’s euphoria is running ahead of the facts on the ground. The ceasefire is extremely fragile. The Strait of Hormuz has not fully reopened (Iran is letting some ships through but navigation remains restricted, with Iran demanding transit fees of approximately $1 per barrel payable in Bitcoin or yuan, and requiring advance cargo approval). Israel has continued striking Hezbollah in Lebanon, which Iran argues constitutes a breach of the ceasefire agreement. Trump himself complained on Truth Social that Iran is doing a very poor job of allowing oil through the Strait. The weekend negotiations in Islamabad (led by VP Vance with envoys Witkoff and Kushner on the US side, and Foreign Minister Araghchi with parliament speaker Ghalibaf on the Iranian side) are the week’s defining event.
Currencies
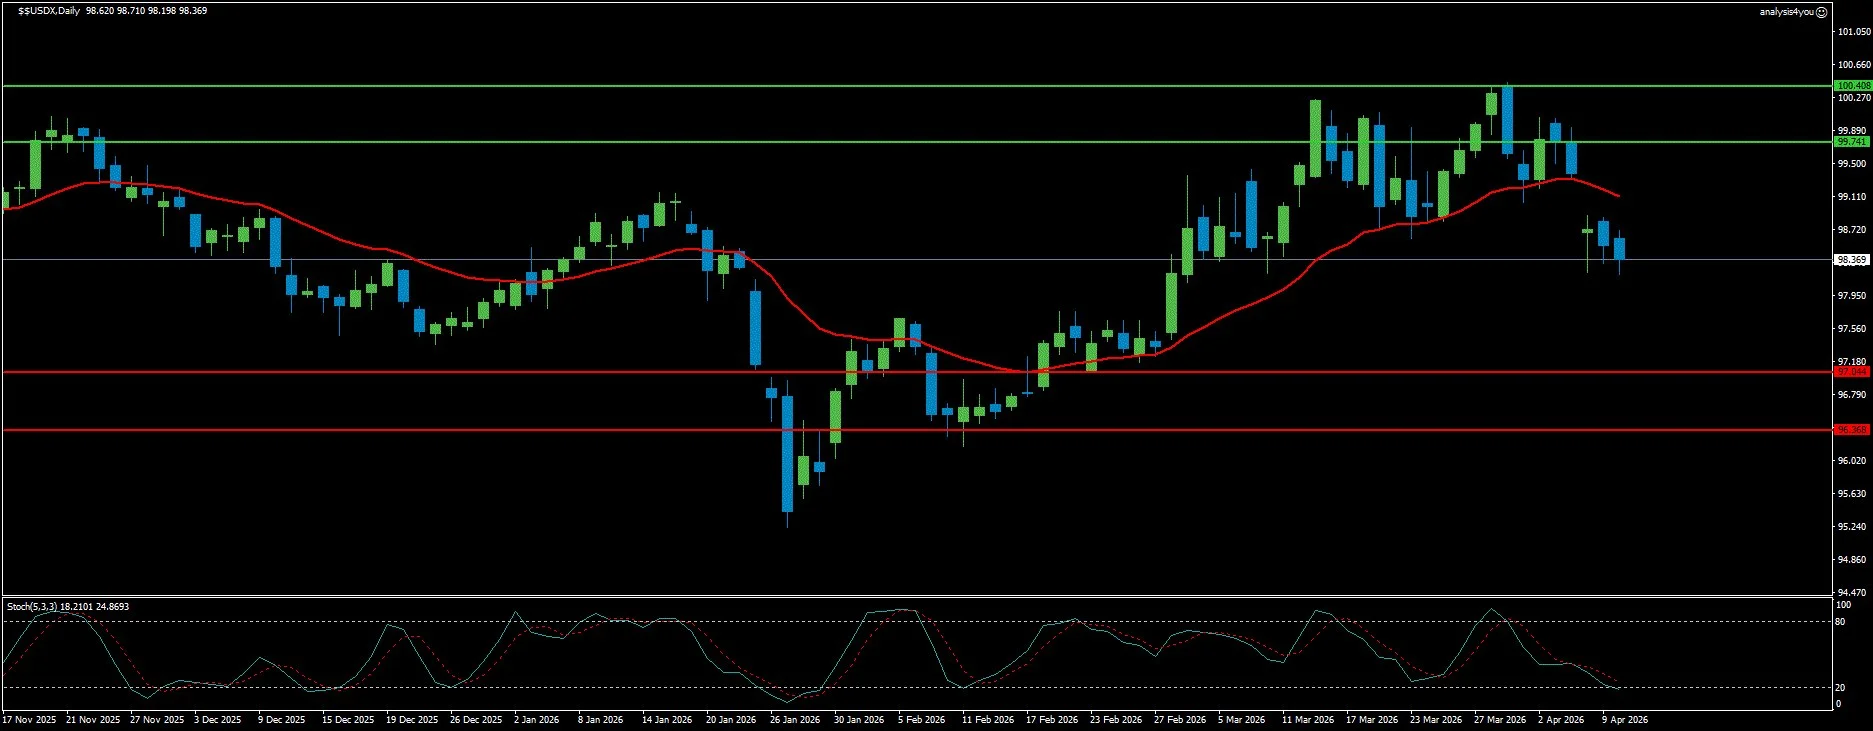
USD Index: Ceasefire Breaks the Dollar Below 200-Day SMA (98.37)
Current Trend: Bearish
Market Sentiment: Risk-On Driven
Resistance: 99.74 | 100.41
Support: 97.04 | 96.37
The US Dollar has suffered its worst two-week stretch since the war began. The USDX fell to multi-week troughs near 98.50 (breaking below its critical 200-day SMA) as the ceasefire announcement triggered a wholesale reversal of the safe-haven bid. What makes this weakness particularly significant is that it occurred against data that should have been constructive: NFP beat at 178K, ISM Manufacturing surged to 52.7 with Prices Paid at 78.3, and CPI jumped to 3.3%. In any other environment, this combination pushes the Dollar higher. Instead, the ceasefire narrative overwhelmed fundamentals entirely. The FOMC Minutes from the March meeting confirmed the Fed’s wait-and-see stance while acknowledging two-sided risks. Officials still project one rate cut in 2026 if inflation declines as projected, but some policymakers now see rate hike scenarios if energy-driven inflation proves persistent. Critically, many members thought policy was already in a reasonable range of neutral, meaning the bar for additional tightening remains high. The dovish Minutes reduced rate hike fear and allowed the ceasefire-driven selling to accelerate. CFTC positioning data showed speculative accounts had rebuilt to modest net longs (approximately 3,600 to 3,700 contracts) with rising open interest (a setup that has now been unwound by the ceasefire shock). Fed speakers delivered a consistent message: policy is appropriately restrictive, the outlook is two-sided, and oil shock persistence is the key variable. The week ahead is pivotal. The Islamabad negotiations outcome determines whether the ceasefire solidifies (bearish Dollar continuation) or breaks down (sharp safe-haven rebound). US PPI on Tuesday provides the next inflation reading (after CPI’s 3.3% jump, a hot PPI reinforces higher-for-longer and could provide temporary support). The Fed Beige Book on Wednesday offers a real-time snapshot of economic conditions. ECB Meeting Accounts on Thursday may reveal hawkish language that supports EUR and pressures USDX further. Technically, the daily chart confirms a meaningful breakdown. USDX has fallen from the 100.24 prior high and broken below the 200-day SMA. The Stochastic at 18.21/24.87 is at its most oversold reading in months, which warns of a potential technical bounce. However, the trend has shifted and oversold conditions in a new downtrend can persist. Resistance at 99.74 is the immediate ceiling. A recovery back above 99.74 requires a significant catalyst such as a ceasefire breakdown or a dramatically hot PPI print. On the downside, 97.04 is the first meaningful support, with 96.37 the deeper floor.
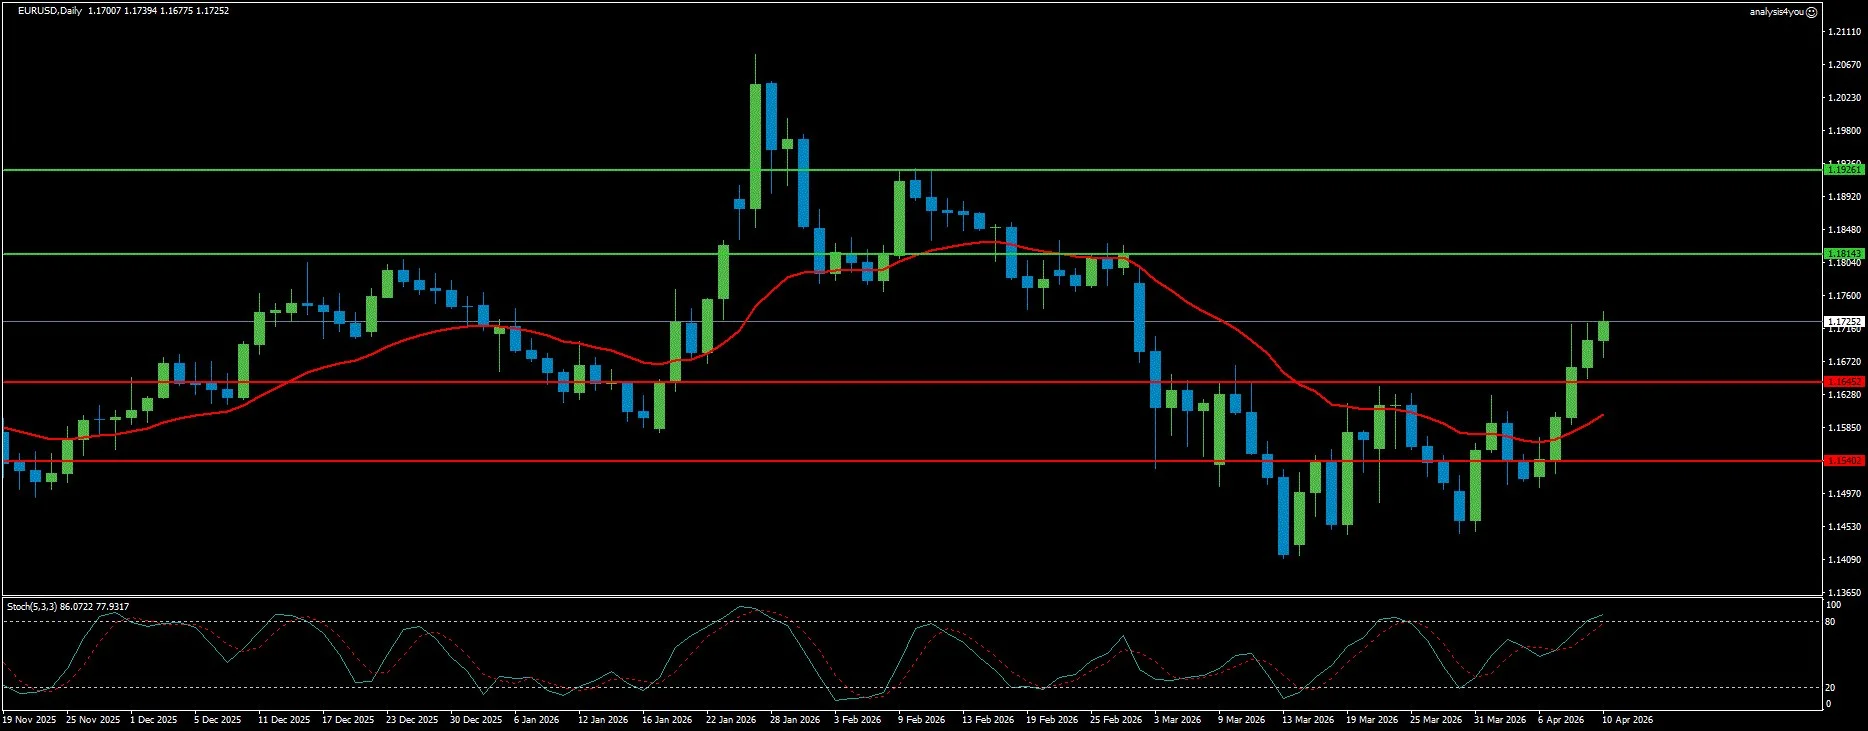
EUR/USD: Breakout Above All SMAs, Mildly Bullish Bias (1.1725)
Current Trend: Bullish
Market Sentiment: Constructive
Resistance: 1.1814 | 1.1926
Support: 1.1645 | 1.1540
EUR/USD has broken out of the four-week range that defined March and early April, surging from 1.1517 to 1.1725 (a move of over 200 pips that took the pair above the 100-day SMA at 1.1694, the 200-day SMA at 1.1672, and the flat 20-week SMA at 1.1687). The technical picture has shifted from bearish to constructive for the first time since February. The driver was the broad USD selloff on ceasefire relief that lifted all EUR pairs simultaneously. The Eurozone fundamental backdrop has improved modestly but remains challenged. German Factory Orders rose 0.9% MoM and 3.5% YoY in February, the Trade Balance posted a €19.8 billion surplus, and Eurozone PPI declined 0.7%. These are pre-war figures that do not capture the full energy shock impact. The more worrying data point is the March inflation surge: German HICP jumped from 2.0% to 2.8%, and Eurozone HICP rose from 1.9% to 2.5%. The ECB’s dilemma is sharpening (it stands ready to hike rates if inflation runs out of control, yet the economic outlook is deteriorating). ECB President Lagarde reiterated that the bank stands ready to hike even in the case of a not-too-persistent rise in inflation. The week ahead features an unusually heavy ECB speaker schedule. The ECB Meeting Accounts on Thursday will be the key scheduled event (any hawkish language around rate hike scenarios in response to energy-driven inflation provides EUR support). US data (PPI Tuesday, Beige Book Wednesday, Jobless Claims Thursday) will drive USD direction and therefore EUR/USD by inverse correlation. Technically, the daily chart has undergone a significant transformation. EUR/USD has broken above the 100-day SMA at 1.1694, the 200-day SMA at 1.1672, and the 20-week SMA at 1.1687 (all in the same week). The moving average is beginning to curl upward after months of pointing lower. The Stochastic at 86.07/77.93 is in overbought territory (the pair has moved fast and a consolidation or shallow pullback is likely before the next leg higher). The pair holds above all major moving averages for the first time since February. Resistance at 1.1814 is the first meaningful ceiling above (a break there opens 1.1926 and eventually the 1.2000 psychological threshold). On the downside, the broken resistance levels now act as support: 1.1645 (former resistance near the 100-day SMA) and 1.1540 (20-day SMA area).
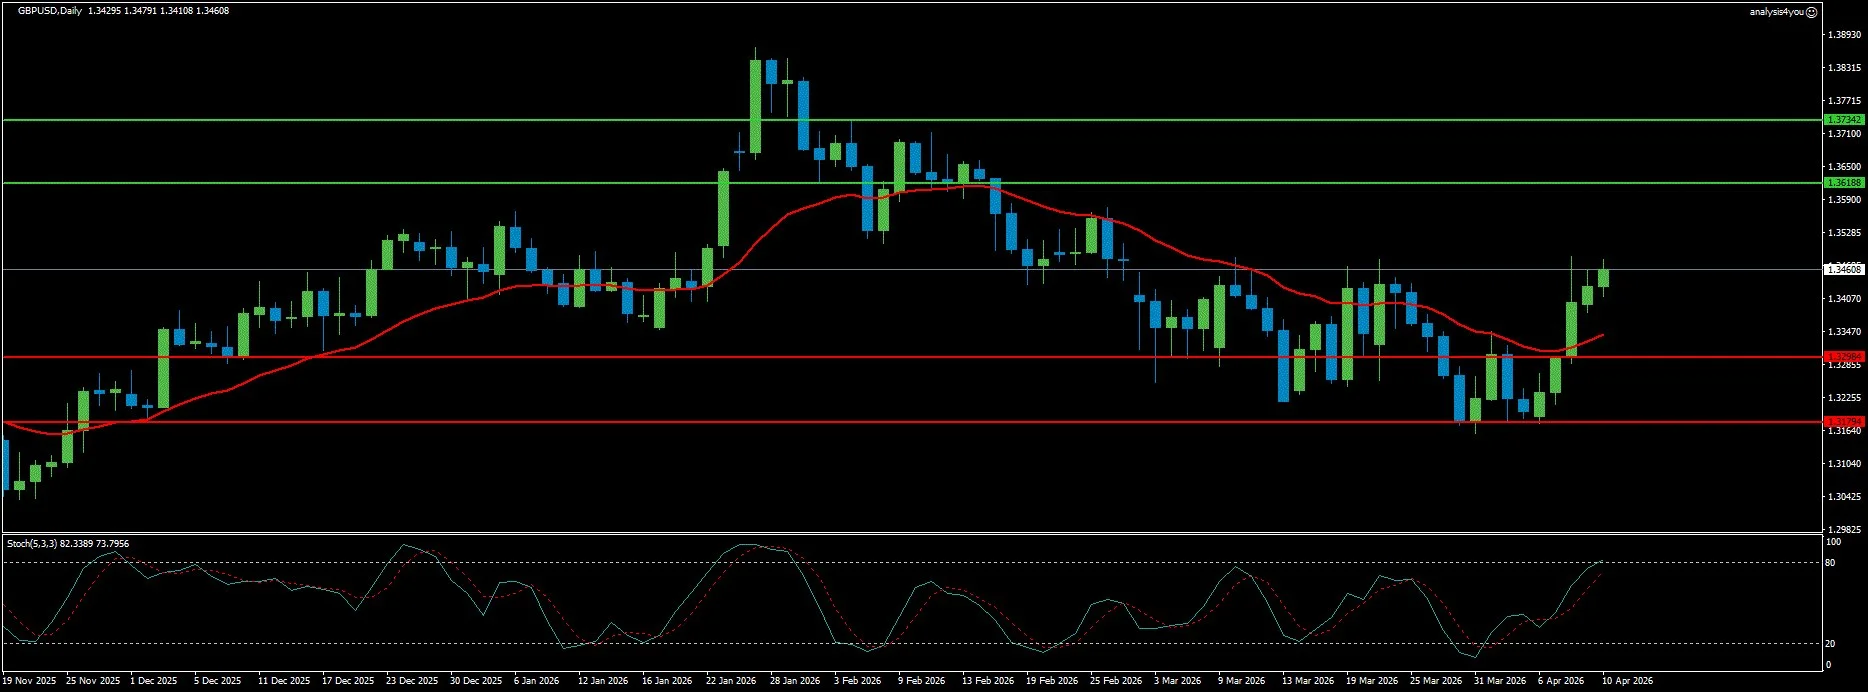
GBP/USD: Biggest Weekly Gain in 11 Weeks, Now Above All SMAs (1.3461)
Current Trend: Bullish
Market Sentiment: Constructive
Resistance: 1.3619 | 1.3734
Support: 1.3298 | 1.3179
GBP/USD staged a stellar recovery from its four-month lows near 1.3219 to close just shy of 1.3500 (the biggest weekly gain in 11 weeks), driven overwhelmingly by the ceasefire-triggered USD selloff rather than any improvement in UK-specific fundamentals. The pair has reclaimed all the major SMAs clustered between 1.3324 and 1.3435, and the technical structure has shifted from mildly bearish to constructive for the first time since February. The UK fundamental picture remains a study in contradiction. Markets are pricing approximately 50 basis points of BoE tightening by year-end (the rate repricing from cuts to hikes has provided structural Sterling support). UK CPI remains at 3% (February), already above target before the full energy shock has embedded. UK Retail Sales fell 0.4% in February (weaker than the 0.7% decline feared but still negative). The March CPI, when it arrives, will be the first genuine read on energy passthrough. The week features multiple BoE Governor Bailey appearances (Tuesday at Columbia University in New York for moderated discussion on the future of central banking, Wednesday at two separate events, and further activity Thursday and Friday). Bailey’s tone on rates, inflation tolerance, and the war’s economic impact will be the primary GBP driver. A hawkish Bailey reinforces the BoE tightening repricing and supports Sterling. A dovish or more cautious Bailey (acknowledging growth risks alongside inflation) could trigger a GBP pullback. Thursday’s UK monthly GDP and industrial production data will provide the first economic snapshot with some war overlap. The ceasefire rally has turbocharged the short-squeeze dynamic. The question for this week is whether dip-buyers will step in to confirm genuine bullish conviction or whether the rally fades as war uncertainty persists. Technically, the daily chart shows GBP/USD trading at 1.3461 above the 20-, 50-, 100- and 200-day SMAs clustered between roughly 1.3324 and 1.3435. This stacked moving average support configuration (with price above all four major SMAs) is the most bullish technical structure Cable has displayed since the pre-war peak in January. The Stochastic at 82.34/73.80 is in overbought territory, consistent with the magnitude of the weekly rally. Resistance at 1.3619 is the immediate target. Above that, 1.3734 is the stronger cap. On the downside, the SMA cluster at 1.3298 to 1.3435 now provides a formidable support floor. A pullback toward 1.3298 (20-day SMA) is a healthy consolidation within the new bullish structure.
Stocks
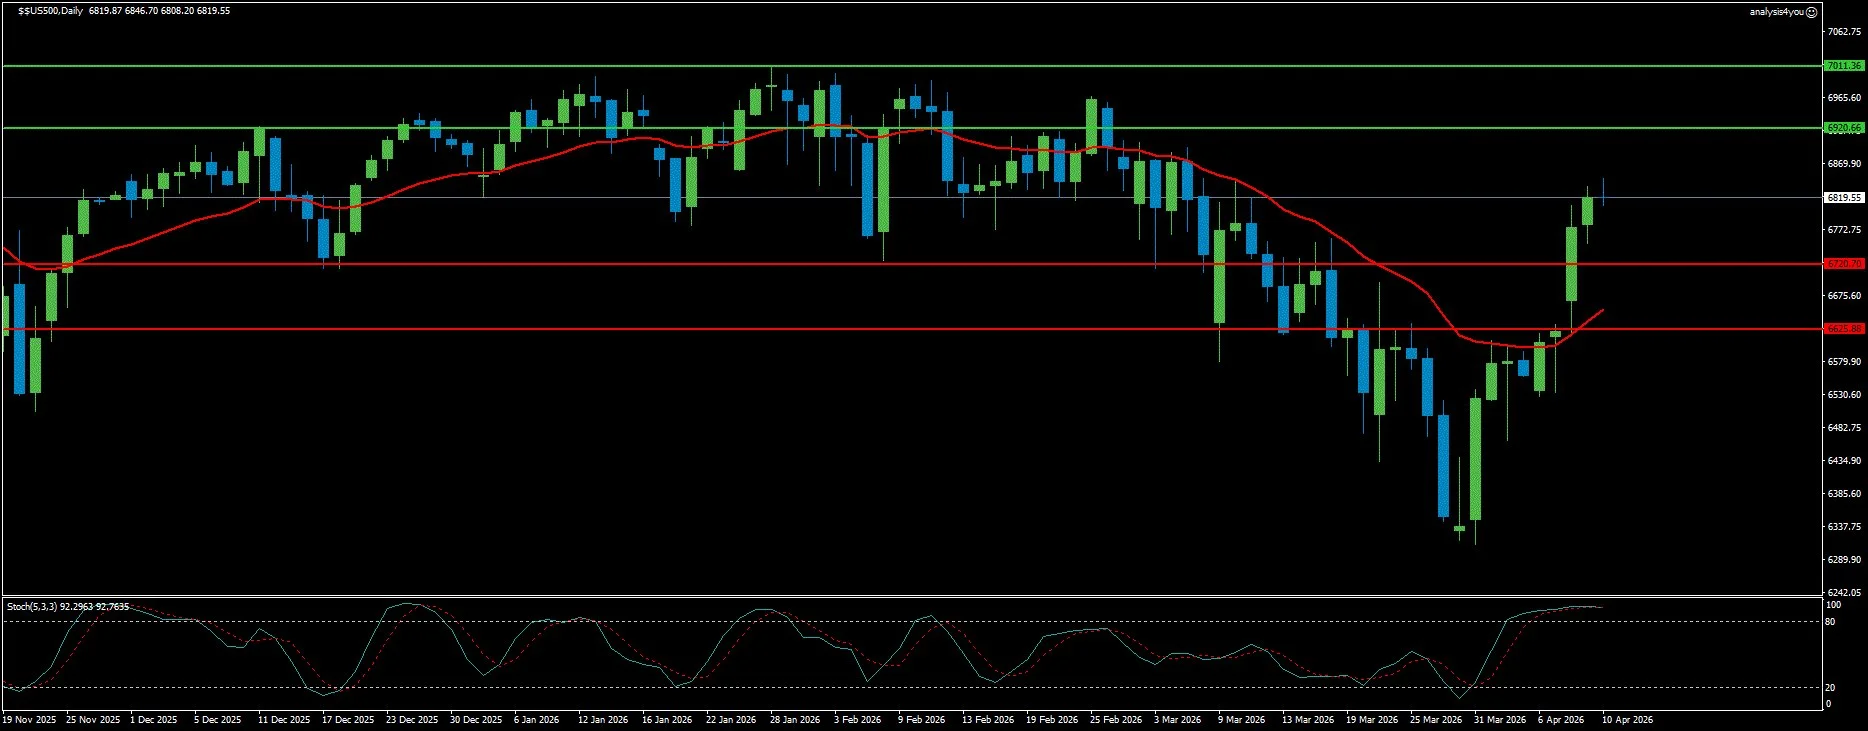
S&P 500: Ceasefire Rally Reclaims Key Levels, Earnings Season Begins (6,820)
Current Trend: Bullish (Counter-Trend Rally)
Market Sentiment: Cautiously Optimistic
Resistance: 6,921 | 7,011
Support: 6,721 | 6,626
The S&P 500 has staged a remarkable recovery, surging from the 6,352 war lows to 6,820 (a gain of over 460 points in two weeks). The index has posted its best weekly performance since November for the second consecutive week, driven by the ceasefire-triggered risk-on surge. The five-week losing streak that defined March is now firmly behind the index. But the recovery’s character (tactical dip-buying on peace signals rather than structural conviction) means the durability of these gains depends entirely on whether the Islamabad negotiations produce a lasting framework. The fundamental backdrop is genuinely mixed. On the positive side: NFP beat at 178K confirms labor market resilience. ISM Manufacturing surged to 52.7 with new orders strong. Q1 earnings season has begun with 85% of early reporters beating estimates and aggregate profit growth tracking at approximately 13.9% YoY. Chipmakers led last week (Broadcom +4.7%, Nvidia +2.6%, Taiwan Semiconductor beating revenue forecasts). On the negative side: Q4 GDP was revised down to 0.5% annualized (the weakest since the pandemic). Consumer Sentiment fell to a record low. CPI at 3.3% confirms the inflation shock is embedding. The Stochastic at 92.30/92.76 on the daily chart is at extreme overbought levels (the most extreme reading since January’s all-time high). Software giants suffered during the week (Adobe plunged 7.6% on a guidance miss and CEO departure). The divergence between earnings-driven sectors (energy, defense, tech hardware) and rate-sensitive or consumer-facing sectors is widening. The week ahead brings the real test of the earnings season (major US banks including JPMorgan report). Q1 bank earnings will reveal the extent of loan growth resilience versus credit quality deterioration under the energy shock. The Beige Book on Wednesday provides the Fed’s real-time regional economic assessment. Chinese Q1 GDP and industrial data on Thursday will show how Asia’s largest economy has absorbed the energy shock. Technically, the daily chart shows a powerful recovery. The Stochastic at 92.30/92.76 is at its most overbought reading since January’s all-time high, signaling the pace of recovery has been extreme and a consolidation or pullback is overdue. The death cross (50-day and 200-day WMA crossover) remains technically in place. Resistance at 6,921 is the immediate ceiling (a break above that level puts the January all-time high zone of 7,000 to 7,011 within reach). On the downside, 6,721 is the first support, with 6,626 the stronger floor.
Commodities
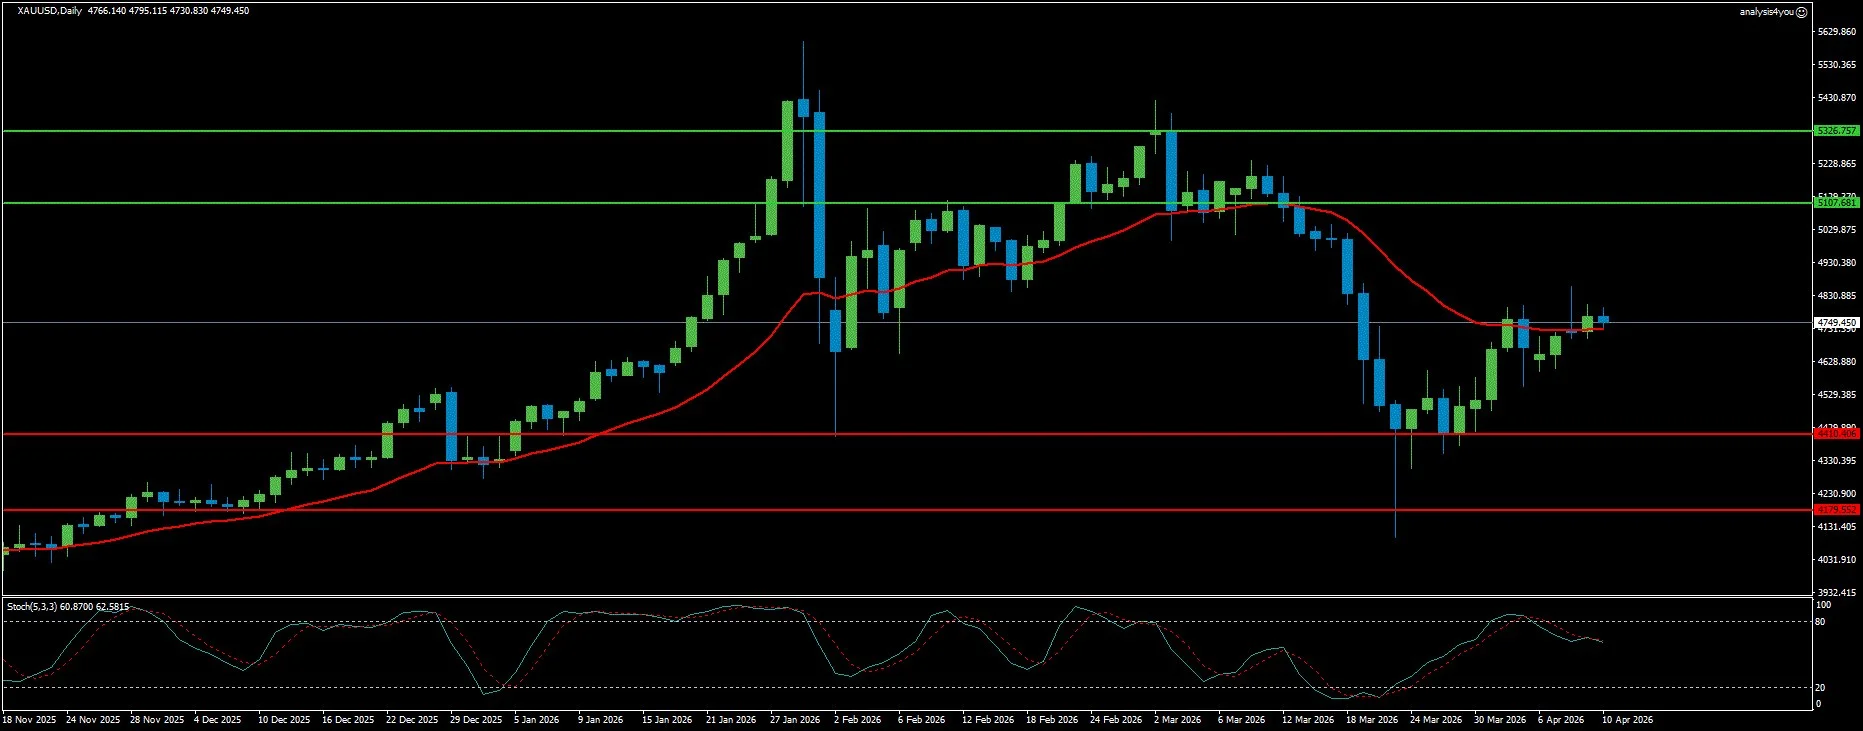
Gold: Two Consecutive Weekly Gains, Ceasefire Keeps Bulls Tentative (4,749)
Current Trend: Neutral to Cautiously Bullish
Market Sentiment: Tentative
Resistance: 5,108 | 5,327
Support: 4,410 | 4,180
Gold has posted two consecutive weeks of gains (recovering from the devastating -17% March collapse), but the recovery remains tentative and headline-driven. XAU/USD closed the prior week near $4,749, having touched $4,850+ during the ceasefire euphoria before pulling back as doubts about the agreement’s durability emerged. The gold market’s behavior continues to reflect the fundamental paradox: conflicting geopolitical signals with safe-haven demand offset by shifts in risk sentiment and dollar moves. The ceasefire announcement triggered a sharp oil selloff, which reduced inflation fears, which in turn reduced the hawkish rate premium that had been suppressing Gold. The FOMC Minutes’ dovish lean (still projecting one rate cut in 2026 if inflation declines) provided additional relief. CME FedWatch shows approximately 75% probability the Fed holds rates unchanged through year-end, leaving room for the USD to weaken further if the ceasefire holds and oil falls. TD Securities strategists argued that even with the ceasefire, it will take time to reverse higher inflation expectations along with higher energy, fertilizer, and chemical prices (making it difficult for the Fed to cut soon). Only a broader normalization in energy and rates could allow Gold to return above $5,000 in the latter part of 2026. The Iran-Oman transit fee arrangement introduces a new structural complexity. Even if a permanent ceasefire is agreed, Iran’s control over Hormuz transit fees means oil prices may not fully normalize immediately. The $1 per barrel fee payable in Bitcoin or yuan represents Iran’s attempt to maintain economic leverage over the strait regardless of the military outcome. This structural supply uncertainty provides a floor for both oil and Gold even in a de-escalation scenario. The week ahead for Gold centers on the Islamabad negotiation outcome and US PPI on Tuesday. A hot PPI print (energy-driven) reinforces the higher-for-longer rate narrative and pressures Gold toward the $4,680 100-day SMA support. A benign PPI combined with credible ceasefire progress could push Gold above the $4,865 to $4,900 pivot zone and toward $5,000. Technically, the daily chart shows Gold recovering from the March war-lows and now consolidating around $4,749. The 100-day SMA (approximately $4,680) has been reclaimed and is now acting as dynamic support. The Stochastic at 60.87/62.58 is in the upper half of its range without being overbought. The critical pivot area at $4,865 to $4,900 (Fibonacci 38.2% retracement, 50-day SMA) is the level Gold bulls need to conquer for the recovery to become sustainable. A break and hold above $4,900 opens the path toward $5,000 and $5,108. On the downside, $4,680 is the first key support. A break below that level exposes $4,500 and $4,410.
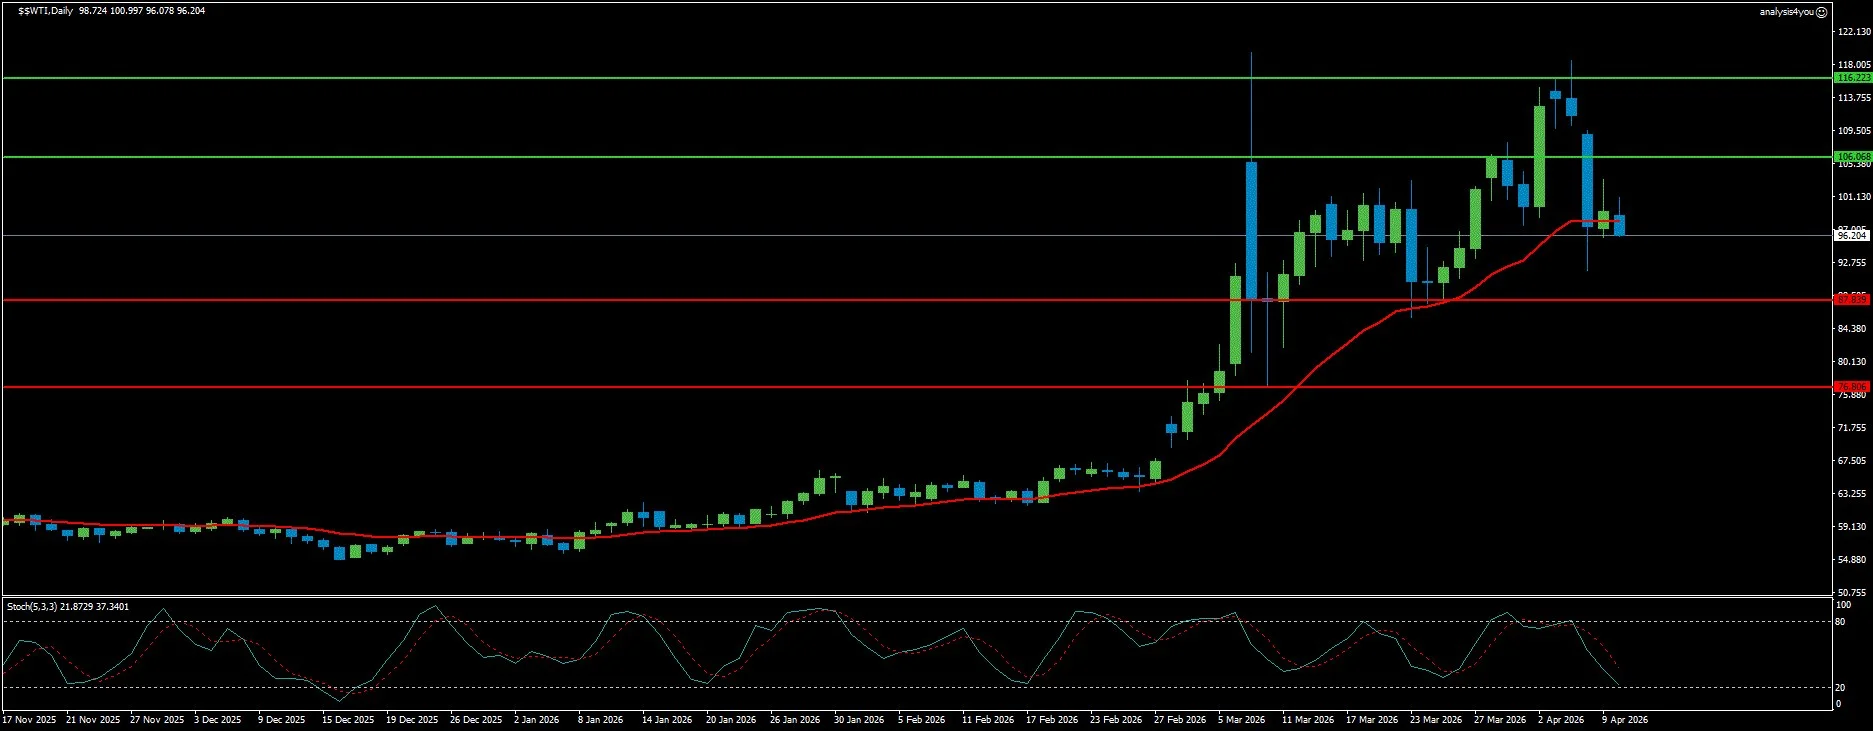
WTI Crude Oil: Ceasefire Breaks $100, Consolidating at $96 (96.20)
Current Trend: Neutral (Ceasefire-Driven Correction)
Market Sentiment: Cautious
Resistance: 106.07 | 116.22
Support: 87.84 | 76.81
WTI crude oil has undergone its most dramatic single-week reversal of the entire war cycle. From the $112.68 high reached the prior week, oil crashed to $96.20 (a decline of over $16 per barrel) as the ceasefire announcement triggered immediate supply relief expectations. The $100 psychological barrier has been broken to the downside. However, the ceasefire’s fragility means this break is tentative: the Strait of Hormuz has not fully reopened, Iran is charging transit fees, and the Islamabad negotiations this weekend will determine whether the selloff continues or reverses. Wells Fargo’s assessment remains balanced: the ceasefire looks fragile and keeps Middle East risk elevated. They still assume active conflict ends by mid-year and oil trends lower into H2 2026, but conviction remains low. The IEA estimates potential supply shut-ins near 10 million barrels per day (roughly 10% of global supply). Even in the ceasefire scenario, shipping through Hormuz and energy production will recover slowly. Iran’s transit fee arrangement (requiring advance cargo approval and $1 per barrel payments in crypto or yuan) means Iran retains economic control of the strait even under ceasefire conditions. WTI’s new price equilibrium under a ceasefire scenario is approximately $90 to $95, reflecting the residual supply premium from the still-restricted Hormuz passage. A full and durable reopening could see WTI fall toward $80 to $85. Conversely, a ceasefire breakdown this weekend at the Islamabad talks sees oil immediately retest $100 and potentially push back toward $106 resistance. UBS notes that US, UK, German and French motor fuel demand is flat to below pre-pandemic levels. Consumers are adapting (reducing driving, shifting to EVs, responding to price signals). This structural demand softening provides a medium-term ceiling on how high oil can go. Technically, the daily chart shows WTI has pulled back sharply from its $112+ highs and is now consolidating just below the $100 psychological level at $96.20. The Stochastic at 21.87/37.34 is approaching oversold territory (the first oversold reading since the war began), suggesting the ceasefire selloff may have been excessive relative to the actual change in supply conditions. Resistance at $106.07 is the immediate ceiling (a break above requires a ceasefire breakdown). On the downside, $87.84 is the first meaningful support. The $76.81 deeper support aligns with pre-war levels.
Crypto
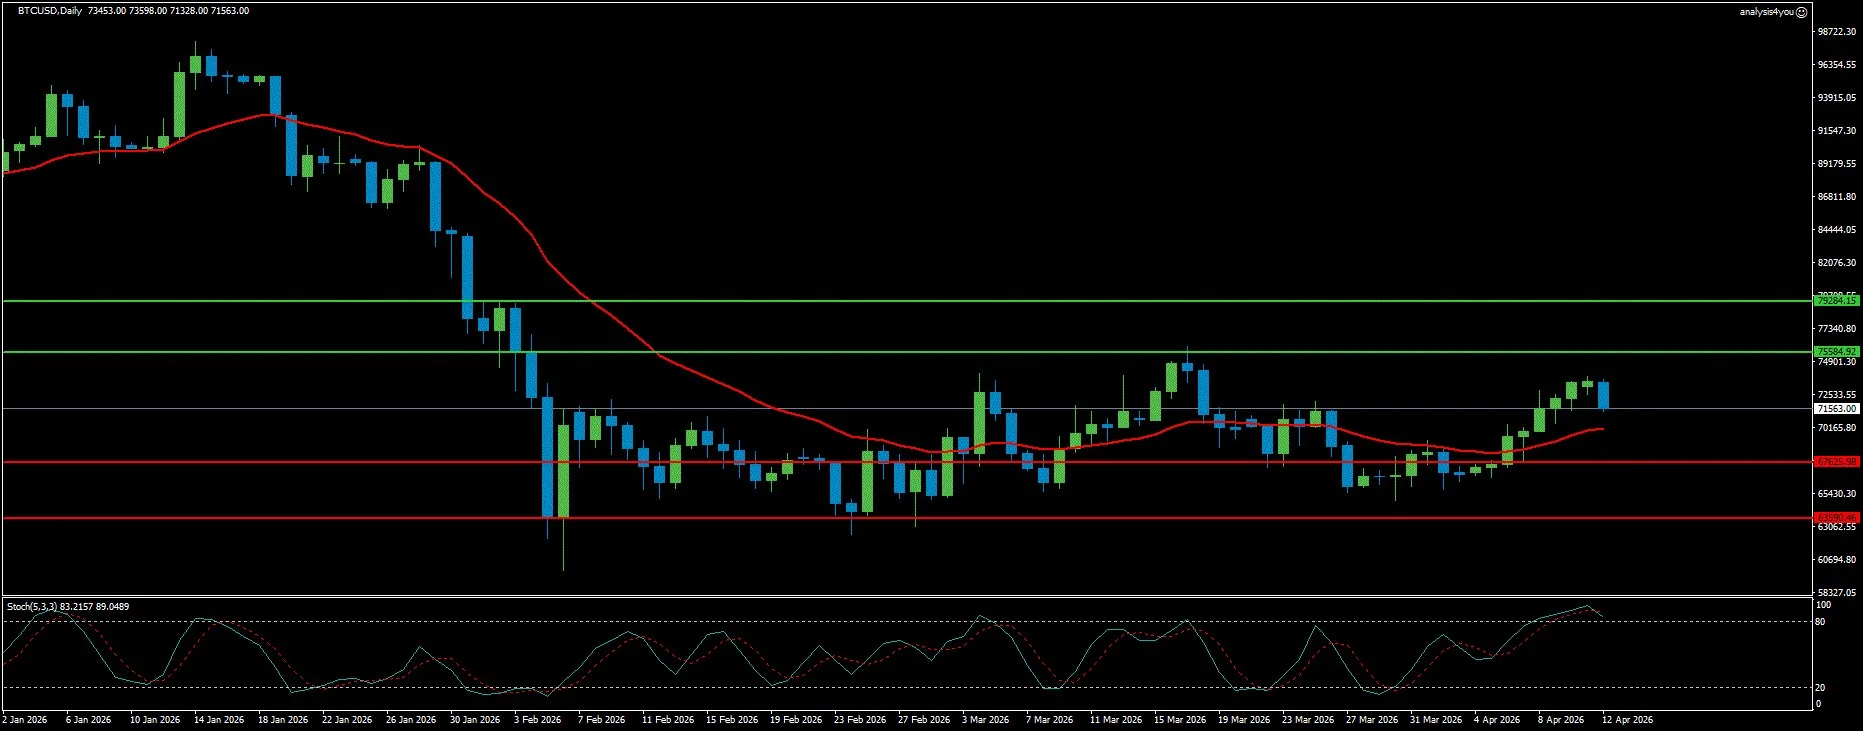
Bitcoin: Ceasefire Surge Plus Bitcoin Toll Proposal Drives Recovery (71,563)
Current Trend: Bullish
Market Sentiment: Optimistic
Resistance: 75,585 | 79,284
Support: 67,626 | 63,590
Bitcoin has had its most eventful week since the war began, surging from $66,872 to $71,563 (a gain of over 7%), driven by a remarkable combination of macro and crypto-specific catalysts. The US-Iran ceasefire triggered risk-on flows that lifted all risk assets. Spot Bitcoin ETFs recorded $545.90 million in net inflows through Thursday (the second consecutive week of positive flows and the largest inflow week since the war began). In a development that could mark a historic milestone for crypto adoption, Iran announced plans to accept Bitcoin and other cryptocurrencies as payment for oil tanker transit fees through the Strait of Hormuz (a proposal that could expose Bitcoin to 20% of global oil tanker traffic). The Morgan Stanley Bitcoin Trust (MSBT) began trading on the NYSE on Wednesday (the first spot Bitcoin ETF launched by a major US bank). Bloomberg’s Eric Balchunas described it as a BIG BOY LAUNCH, projecting approximately $5 billion in AUM within the first year. This represents the next major institutional adoption milestone after BlackRock and Fidelity. The Coinbase Premium Index turned positive following the ceasefire announcement, indicating broad-based US investor demand re-engagement. CryptoQuant’s on-chain analysis identified a critical structural breakout: BTC crossed above the Traders’ Lower Realized Price band at approximately $69,400 following the ceasefire news. This level had capped price action for weeks and its breakout signals an improving market structure. If Bitcoin holds above $69,400 and no escalatory developments emerge, the next key target is the Traders’ Realized Price at approximately $79,000. Open Interest in BTC perpetual futures rose by $2.1 billion following the ceasefire announcement (confirming traders are opening net new long positions). The Iran Bitcoin toll proposal deserves particular attention as a medium-term demand catalyst. With 20% of global oil tankers passing through Hormuz, implementation requires shipping companies to acquire and hold Bitcoin (creating genuine real-world demand). Headwinds remain. Strategy purchased only 4,871 BTC this week (a significant reduction from 22,337 BTC the prior week). The broader demand picture shows 30-day apparent demand growth at approximately -63,000 BTC (total market selling pressure still exceeds institutional buying). Technically, the daily chart shows BTC approaching the channel top at $72,600 from below. The Stochastic at 83.22/89.05 is in overbought territory (the sharpest overbought reading since January’s ATH), suggesting the ceasefire surge has created short-term overextension. A decisive daily close above the channel ceiling at $72,600 signals a bullish break and opens the path toward $75,585 and $79,284. On the downside, $67,626 is the first support, with $63,590 the critical floor.
Key Events This Week (April 13-17, 2026)
Weekend (April 12-13): US-Iran negotiations in Islamabad led by VP Vance. Outcome determines Monday open direction for all risk assets.
Monday, April 13: US Existing Home Sales (March). ECB’s De Guindos speech. Fed’s Miran speaks. Markets digest Islamabad negotiation news.
Tuesday, April 14: US March PPI (primary inflation event). BoE Governor Bailey speaks at Columbia University. Fed’s Goolsbee, Barr speeches. ECB’s Lane, Cipollone and Lagarde speeches. China Exports, Imports and Trade Balance.
Wednesday, April 15: BoE Governor Bailey speaks at two separate events. Fed’s Beige Book. France CPI March. Eurozone Industrial Production. Fed’s Barr and Bowman speeches. ECB’s Cipollone, Lagarde and Schnabel speeches.
Thursday, April 16: ECB Monetary Policy Meeting Accounts (the week’s most important ECB event). UK GDP February, UK Industrial Production. Eurozone HICP March Final. China Q1 GDP, Industrial Production, Retail Sales. US Initial Jobless Claims. US Philadelphia Fed Manufacturing Survey. US Industrial Production.
Friday, April 17: Fed’s Waller speech. Q1 earnings season continues (bank earnings from JPMorgan and major financials).
Week Ahead Outlook
The week of April 13 to 17 is a transition week (transitioning from the war-driven risk-off regime that defined March into whatever the new regime becomes based on the Islamabad negotiation outcome). The market is currently priced for de-escalation: USD weak, EUR/GBP strong, equities recovering, oil below $100, Gold tentatively higher, Bitcoin surging. If the Islamabad
talks produce a credible framework for lasting peace and Hormuz reopening, these moves extend. If talks break down, every move reverses violently.
Scenario 1: Islamabad Success (approximately 35%): US and Iran agree on a framework for a permanent ceasefire with a clear timeline for full Hormuz reopening. WTI crashes toward $85 to $87. USDX extends decline toward 97.04 and 96.37. EUR/USD surges above 1.1814 toward 1.1926. GBP/USD breaks 1.3619 targeting 1.3734. S&P 500 rallies above 6,921 toward 7,011. Gold initially dips then rallies as Fed rate cut expectations return (target $5,000). Bitcoin surges above $75,585 toward $79,284.
Scenario 2: Islamabad Stalemate (approximately 40%): Talks produce no breakthrough. The two-week ceasefire holds nominally. Hormuz remains partially restricted with Iran charging transit fees. Oil consolidates $90 to $100. USDX stabilizes 97 to 99 range. EUR/USD consolidates 1.1640 to 1.1814. GBP/USD holds 1.3298 to 1.3619 range. S&P 500 consolidates 6,721 to 6,921. Gold holds $4,680 to $4,865 range. Bitcoin consolidates $69,400 to $72,600 channel. PPI Tuesday and Beige Book Wednesday drive intra-week moves.
Scenario 3: Islamabad Breakdown (approximately 25%): Talks collapse entirely. War re-escalation confirmed. Safe-haven bid returns violently. USDX surges back toward 100.41. EUR/USD crashes below 1.1540 toward 1.1404. GBP/USD falls below 1.3298 toward 1.3179. S&P 500 gaps lower below 6,721 toward 6,626. WTI spikes back above $100 toward $106. Gold spikes on safe-haven demand ($5,000 in play). Bitcoin flash-crashes below $67,626.
Trading Priorities: Islamabad talks (monitor Monday open). USDX 97.04 (next support on ceasefire continuation). EUR/USD 1.1814 (first resistance). GBP/USD 1.3619 (first resistance). S&P 500 6,921 (key ceiling). Gold $4,865 to $4,900 (pivot zone). WTI $100 (psychological level). BTC $72,600 (channel top breakout). US PPI Tuesday (inflation signal). ECB Meeting Accounts Thursday. Bank earnings mid-week.
Bottom line: The market has made a decisive regime shift on ceasefire optimism. Every major safe-haven trade from the past six weeks has been partially or fully unwound. The speed and scale of the reversal (USDX down 1.4 points, EUR/USD up 200 pips, S&P 500 up 460 points, WTI down $16) reflects the depth of the war premium that had been embedded in prices. If the Islamabad talks succeed, there is more to go. If they fail, the reversal will be equally violent. The Stochastic readings across all assets at extremes (USDX oversold at 18, S&P 500 overbought at 92, GBP overbought at 82, BTC overbought at 83) are the market’s own warning signal that conviction is running ahead of confirmed facts.

