How to Measure Slippage, Spread, and Market Impact Before They Erode a Winning Strategy
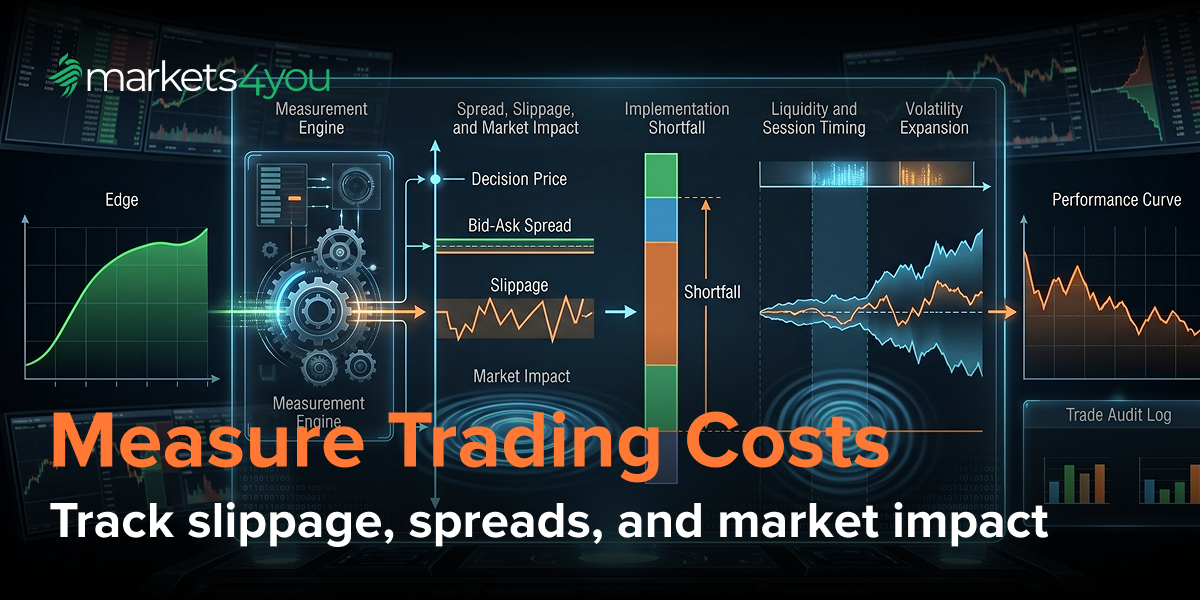
Many traders experience the same frustrating pattern.
A strategy performs well during backtesting. The setups appear clean, the win rate looks attractive, and the risk-reward profile seems strong enough to produce consistent returns. But once the strategy is traded live, the results slowly drift away from expectations.
The entries may still be technically correct. The market direction may even remain accurate. Yet overall trading performance weakens over time.
Often, the issue is not the strategy itself.
The issue is execution.
Spread cost, slippage, and market impact can quietly erode profitability even when market analysis is correct. Small inefficiencies repeated across dozens or hundreds of trades may eventually turn a profitable system into a mediocre one.
This is why execution quality matters far more than many traders realise.
Markets do not reward theoretical entries. They reward actual fills.
A strategy that appears profitable on paper may struggle in live conditions if trading costs rise during volatile sessions, liquidity conditions weaken, or order execution becomes inconsistent.
This is especially true for short-term trading systems, breakout strategies, scalping models, and volatility-driven trading.
Understanding how to measure slippage, spread cost, and market impact helps traders evaluate whether their edge truly exists after real-world trading friction is accounted for.
More importantly, it helps traders shift their focus from simply predicting direction toward improving execution efficiency.
Why Win Rate Alone Can Mislead Traders
One of the most common mistakes traders make is evaluating a strategy primarily through win rate. At first glance, this seems logical. A system that wins 70% of the time should theoretically outperform one that wins only 45% of the time. But markets are rarely that simple. Win rate alone does not capture the true effect of trading costs, execution quality, or market friction. A strategy may look impressive statistically while quietly losing edge through poor fills, spread widening, or slippage during volatile conditions. This becomes especially important in short-term trading systems. For example, imagine a scalping strategy targeting small intraday price movements. On paper, the system may appear highly profitable because the average gain exceeds the average loss across historical testing. However, once spread cost and slippage are applied consistently, the actual returns may shrink dramatically. A strategy targeting five or six pips per trade may lose a meaningful portion of its expected edge if:- spreads widen during execution,
- market orders fill late,
- stops experience negative slippage,
- or liquidity disappears during fast-moving sessions.
- session timing,
- liquidity depth,
- news conditions,
- position size,
- and execution method.
- How much does execution cost reduce the edge?
- How stable are fills across different sessions?
- How does volatility affect order execution?
- What happens during poor liquidity conditions?
The Difference Between Spread, Slippage, and Market Impact
Many traders group all trading costs together under the idea of “broker fees” or “bad fills.” In reality, spread cost, slippage, and market impact are separate forms of trading friction that affect performance differently. Understanding these differences is essential for improving execution quality. Spread Cost Spread cost refers to the difference between the bid price and the ask price. Every market order immediately crosses this bid-ask spread, meaning traders begin each trade slightly negative at entry. For short-term traders, spread cost can become a major source of hidden drag. Spread conditions also change dynamically. During stable liquidity conditions, spreads often remain tight. But during news events, session transitions, low-liquidity hours, or volatility spikes, spread widening can increase execution costs substantially. This is why effective spread matters more than advertised minimum spreads. The effective spread reflects what traders actually experience during live execution rather than ideal market conditions. Slippage Slippage occurs when an order is filled at a different price from the trader’s intended execution level. This often happens during:- rapid market movement,
- thin liquidity,
- volatile news releases,
- or aggressive momentum conditions.
- VWAP execution,
- algorithmic order slicing,
- passive liquidity participation,
- and benchmark execution models.
What Implementation Shortfall Reveals About Real Performance
Implementation shortfall is one of the most useful frameworks for measuring real trading performance. At its core, implementation shortfall compares the decision price of a trade against the final execution result. The decision price represents the theoretical price where the trader intended to enter or exit. The executed price reflects what actually happened once spread cost, slippage, and market conditions were applied. The difference between these two outcomes reveals the true cost of execution. This concept matters because markets rarely deliver perfect fills consistently. A strategy may appear profitable at the decision level while underperforming significantly after execution friction is included. For example, imagine a breakout trader identifies a long entry at 1.2050. But by the time the order reaches the market and liquidity shifts, the actual fill arrives at 1.2055. The strategy immediately begins five pips worse than intended before additional costs are considered. If this pattern repeats consistently, long-term trading performance may deteriorate substantially even if the trader’s directional analysis remains accurate. Implementation shortfall therefore connects strategy quality with execution reality. It helps traders understand whether poor results come from flawed market analysis or whether execution drag is quietly damaging the edge. Professional firms treat execution benchmarking as a core part of performance attribution. They analyse:- how efficiently orders were executed,
- how closely fills matched benchmark execution levels,
- and how much cost drag reduced profitability.
- slippage rises sharply during certain sessions,
- stop-loss execution deteriorates during volatility expansion,
- or market orders consistently perform worse during low-liquidity conditions.
Why Liquidity and Session Timing Change Execution Costs
Execution quality changes constantly throughout the trading day because liquidity conditions are never static. Many traders focus heavily on chart patterns while ignoring why time of day is often more critical than price levels for execution quality. In reality, the same strategy may produce completely different trading costs depending on when trades are placed. Liquidity depth shifts throughout major trading sessions as institutional participation and macroeconomic activity change. During highly liquid periods, markets generally absorb orders more efficiently. Spreads remain tighter, slippage decreases, and fill quality improves. But during weaker liquidity conditions, execution friction rises quickly. For example, the overlap between the London and New York sessions typically provides stronger intraday liquidity across major forex pairs. By contrast, off-peak hours frequently produce:- thinner liquidity,
- wider spreads,
- unstable fills,
- and greater slippage risk.
- sudden spread widening,
- aggressive slippage,
- delayed fills,
- or sharp price gaps.
How Volatility Expansion Can Distort Fills and Stops
Volatility expansion creates some of the most difficult execution conditions traders face, especially for traders building systems around volatility expansion cycles. During stable market environments, liquidity tends to remain predictable. Order execution is smoother, spreads remain tighter, and slippage risk is easier to manage. But when volatility increases rapidly, execution conditions can deteriorate very quickly. This is especially common during:- economic news releases,
- central bank announcements,
- breakout conditions,
- geopolitical shocks,
- and sudden shifts in market sentiment.
Which Benchmarks Traders Can Use to Audit Execution Quality
Most traders review strategy performance through profit and loss alone. Professional traders evaluate execution more deeply. They use execution benchmarking to measure how efficiently trades were placed relative to market conditions. One of the simplest benchmarks is average spread cost. Traders should track:- typical spreads during different sessions,
- spread widening during volatility,
- and how spread conditions affect net profitability.
- session timing,
- spread conditions,
- volatility environment,
- order type used,
- fill quality,
- slippage behaviour,
- and execution outcome relative to intended price.
How to Reduce Cost Drag Without Over-Optimizing the Strategy
Many traders respond to execution problems by endlessly modifying their strategy rules. Often, this creates more problems than solutions. A system may not require major structural changes if the real issue is execution quality rather than trade selection. Reducing cost drag should focus on improving efficiency without over-optimising the strategy itself. One of the simplest improvements involves session selection. Trading during stronger liquidity conditions generally improves:- fill quality,
- spread stability,
- and execution consistency.
Common Mistakes Traders Make When Measuring Trading Costs
One of the biggest mistakes traders make is treating trading costs as random bad luck rather than measurable market behaviour. Execution friction is rarely random. Spread widening, slippage, and poor fill quality often follow identifiable patterns connected to:- liquidity conditions,
- volatility expansion,
- session timing,
- and order execution methods.
Summary
Many strategies fail not because the market analysis is wrong, but because execution drag quietly erodes profitability over time. Spread cost, slippage, and market impact all affect trading performance differently. Together, they create trading friction that can significantly reduce edge, particularly in short-term and volatility-driven systems. This is why execution quality deserves as much attention as strategy design itself. A strong setup on paper may still underperform in live markets if traders ignore:- liquidity conditions,
- session timing,
- volatility expansion,
- fill quality,
- and implementation shortfall.
FAQ
- What is the difference between spread and slippage?
- What is market impact in trading?
- How does implementation shortfall help measure performance?
- Why do trading costs rise during volatile markets?
- How can traders reduce hidden execution costs?


