Warsh Becomes Fed Chair Monday, April CPI Tuesday Defines New Era

Market Sentiment Overview
The week of May 11 to 15 opens at a genuinely historic inflection point for global markets. On Monday May 11, Kevin Warsh officially becomes Chair of the Federal Reserve (the most consequential leadership transition since Ben Bernanke replaced Alan Greenspan in 2006). Powell’s term expires May 15. The Fed that Warsh inherits is divided and with its independence in doubt. Three members voted against the easing bias language at the April meeting (the most hawkish internal configuration since October 1992). Warsh himself has called for balance sheet reduction, new inflation frameworks, and the elimination of forward guidance. His first week as Chair will be defined before he even chairs a meeting: Tuesday’s April CPI report will be the first major inflation data under his watch. The prior week delivered a week that will be studied in financial history courses. The S&P 500 and Nasdaq both hit new all-time highs, with the S&P 500 reaching 7,398 to 7,400 and posting its seventh consecutive weekly advance. Bitcoin hit a three-month high of $82,850 on Wednesday before being rejected at the 200-day EMA and 100-week EMA cluster. WTI fell 7.39% for the week as Iran’s peace proposal sparked de-escalation optimism. EUR/USD posted its second consecutive weekly gain, flirting with 1.1800. GBP/USD broke the 1.3600 triple top that had rejected price four times (the most significant Cable technical development of the entire war period). The Iran war narrative produced its most whipsawing week yet. Trump announced Project Freedom Monday (a US Navy escort operation for oil vessels). It was paused Tuesday. Mid-week, multiple news outlets reported the US and Iran were closing in on a final agreement (triggering a +3% Gold rally). Then Thursday, US forces targeted Iranian military facilities. As of Friday, Washington is waiting for Tehran’s official response to the US 14-point memorandum.
Currencies
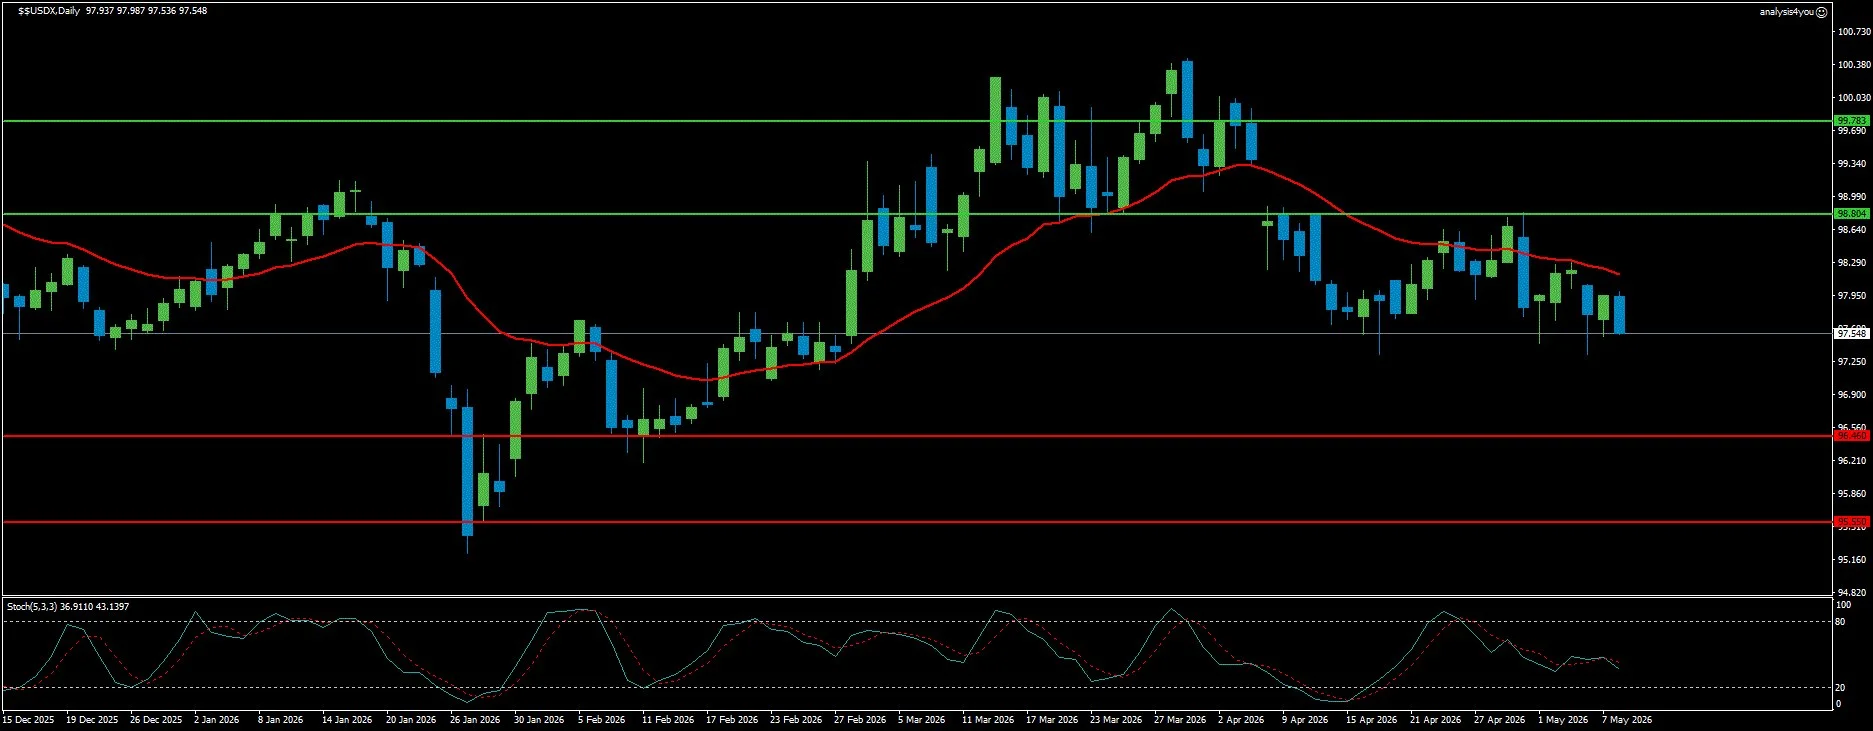
USD Index: Accelerating Downtrend, Lowest Since January (97.55)
Current Trend: Bearish
Resistance: 98.80 | 99.78
Support: 96.46 | 95.55
The US Dollar’s structural downtrend has accelerated. DXY at 97.55 has declined from the 100.41 war-peak to levels last seen in January (a decline of nearly 300 points in five weeks). The current bar has reached lower Bollinger Bands (a new technical deterioration versus prior weeks’ middle bands). This is no longer a dead-cat bounce scenario; this is a confirmed downtrend with momentum. DXY has challenged the area of multi-week troughs near 97.60, slipping further below its key 200-day SMA. The selling pressure has been driven by somewhat easing tensions in the Middle East. The fundamental picture has shifted materially in favor of Dollar bears. Fed speakers who emerged from the blackout period delivered a consistent message: higher for longer, with inflation risks dominating. Yet despite this hawkish Fed rhetoric, the Dollar continues to fall. The DXY is only slightly higher than it was at the start of March (unusual as the Greenback typically strengthens during geopolitical turmoil). This time, the success in March was followed by a rout in April as investors rushed to capitalize on de-escalation. Investors believe that once the Middle East conflict ends, the old fears will sink the Greenback again. Warsh’s transition adds a new dimension: any explicit signals about reforms could spook markets. The NFP data provided a muted Dollar reaction (115K in April beat the 62K estimate convincingly, but the reaction reflected the high bar for Fed rate changes). The Dollar needs a genuinely hot CPI on Tuesday to mount any meaningful recovery (Wells Fargo forecasts headline CPI at 3.8% YoY for April). Technically, DXY at 97.55 is below MA 20, MA 50, and MA 200 (all three stacked bearishly above). The current bar has reached lower Bollinger Bands (the most bearish signal during the entire war period). The Stochastic at 36.91/43.14 is mid-range in a downtrend with a bearish signal. Resistance at 98.80 is the immediate ceiling. On the downside, 96.46 is first support, with 95.55 (the January multi-month low) now directly in sight.
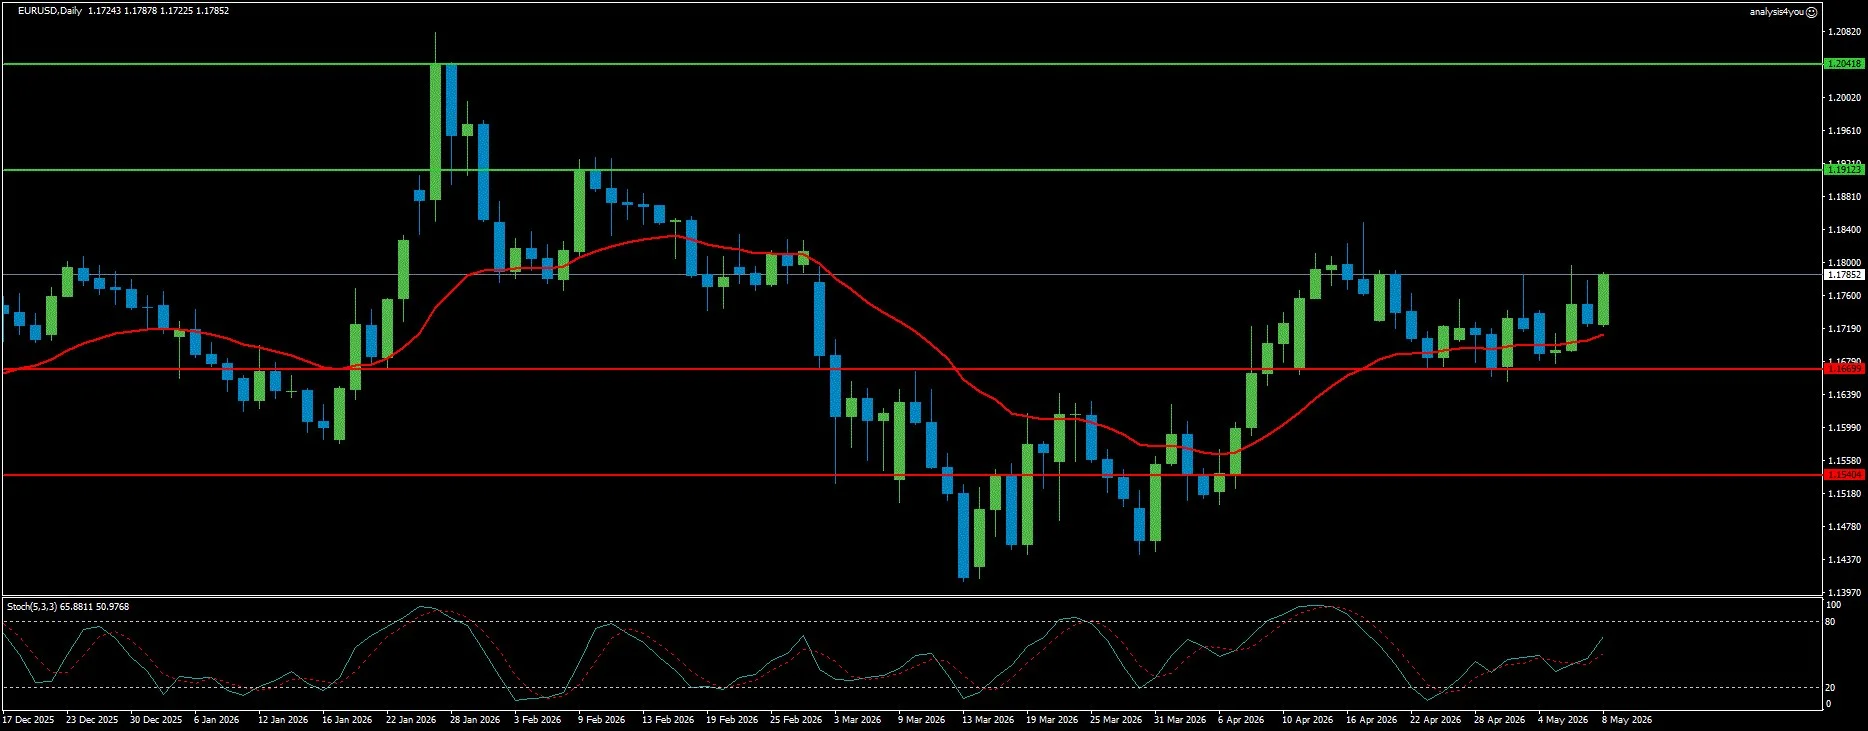
EUR/USD: Upper Bollinger Band Breakout, 1.2000 Now the Target (1.1785)
Current Trend: Bullish
Resistance: 1.1912 | 1.2042
Support: 1.1670 | 1.1540
EUR/USD has posted two consecutive weekly gains and is now pressing against the upper Bollinger Band (the most bullish technical configuration the pair has displayed in months). At 1.1785, the pair is comfortably above all three major moving averages. The RSI advances around 59 skewing risk to the upside. The resistance levels have been upgraded to 1.1912 and 1.2042 (the 1.2000 psychological threshold is now the primary medium-term target). The fundamental support for EUR comes from multiple converging directions. The ECB’s hawkish pivot (with Lagarde acknowledging inflation risks tilted to the upside, and anonymous sources confirming the ECB expects to hike in June and again later in the year if Brent holds above $100) provides structural EUR support. Eurozone April HICP rose to 3.0% YoY (the highest since September 2023). The market is now pricing approximately 75bp of ECB tightening by year-end. The key caution: optimism may not last as tensions in the Middle East escalate. EUR/USD’s gains are built on peace hopes that have not yet been confirmed by a signed agreement. A hot US CPI on Tuesday would be the most immediate EUR headwind (Wells Fargo forecasts headline at 3.8% YoY with core at 2.9%). The Trump-EU trade war escalation (tariff threat by July 4) adds a secondary EUR headwind. Technically, EUR/USD is at 1.1785, with the current bar reaching upper Bollinger Bands. Above MA 20, MA 50, and MA 200 with all three MAs now pointing upward. The Stochastic at 65.88/50.98 is in the upper range in an uptrend with a bullish signal. As long as the 1.1700 area holds, the risk remains skewed to the upside. Resistance at 1.1912 is the immediate target. On the downside, 1.1670 is the first meaningful floor.
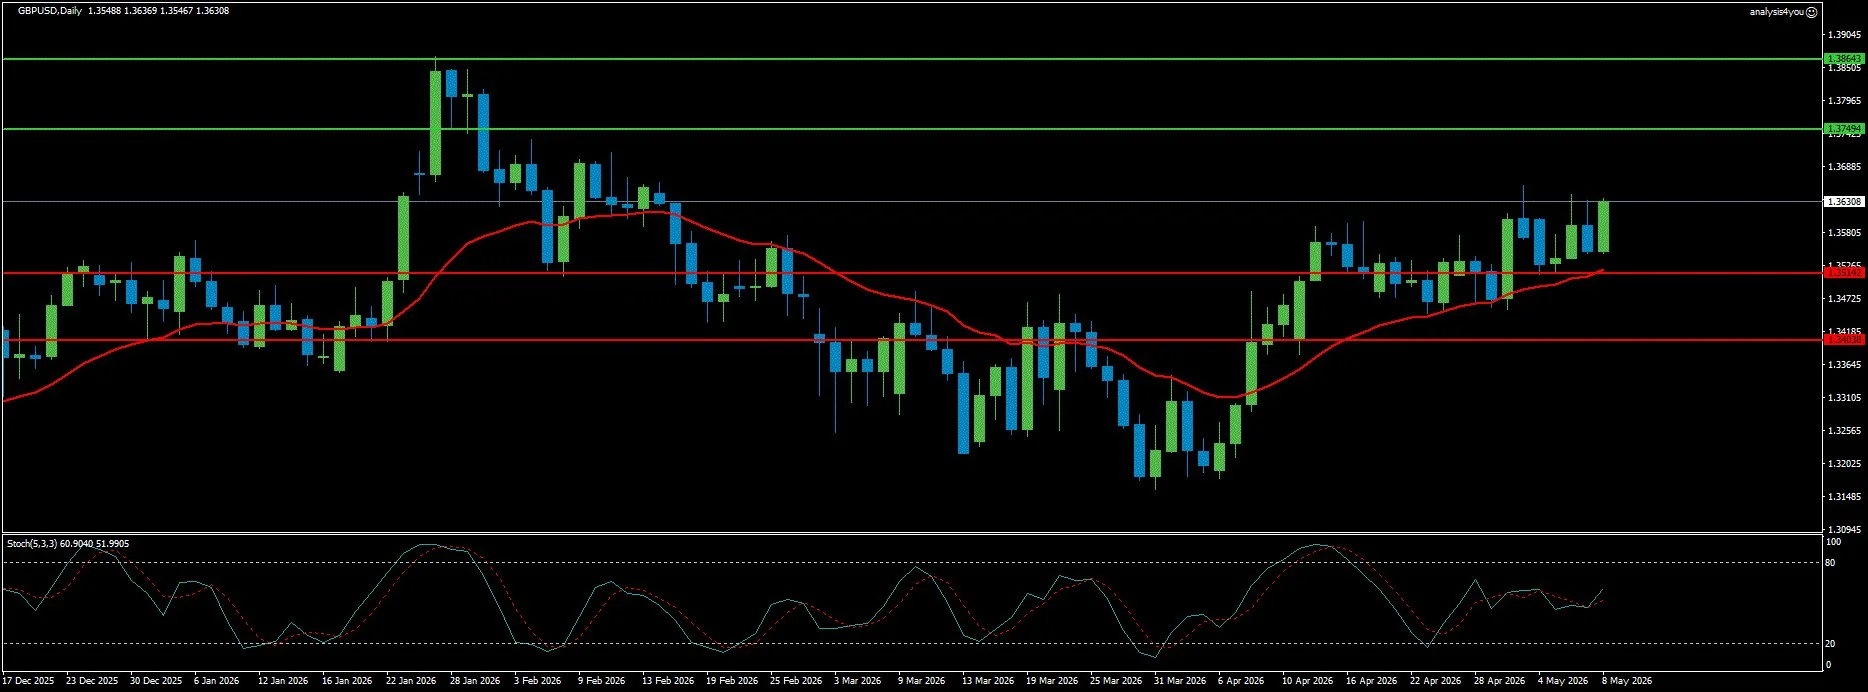
GBP/USD: Historic: Triple Top at 1.3600 Finally Broken (1.3631)
Current Trend: Bullish
Resistance: 1.3749 | 1.3864
Support: 1.3514 | 1.3404
GBP/USD has achieved a technical milestone that eluded the bulls for four consecutive attempts over three weeks: a clean close above the 1.3600 triple top resistance. At 1.3631, the pair is above upper Bollinger Bands (the strongest Bollinger Band signal of the three currency pairs this week) with both RSI and Stochastic in bullish territory. This breakout is structurally validated by the most hawkish BoE communication since the war began. The BoE’s 8-1 hold with Chief Economist Huw Pill dissenting for a 25bp rate hike (the first hawkish dissent of the war period) signals that the balance within the MPC is shifting. Governor Bailey explicitly stated it would be a mistake to wait for second-round inflation effects. Markets are pricing approximately 60bp of BoE tightening by year-end (the largest tightening premium of any major central bank). This Fed-BoE policy divergence of approximately 60bp+ is the structural engine powering Cable’s recovery from 1.3219 war lows to 1.3631 (a 412-pip move). The week ahead is critical for GBP. UK Q1 GDP growth on Thursday will provide the most comprehensive read on the war’s economic impact through Q1. If the GDP print confirms resilience, GBP/USD could extend toward 1.3749 and potentially 1.3864. The primary risk is a softer UK GDP or an unexpectedly hawkish US CPI. Technically, GBP/USD is at 1.3631, above upper Bollinger Bands. Above MA 20, MA 50, and MA 200. The Stochastic at 60.90/51.99 is in the upper mid-range in an uptrend with a bullish signal. Resistance at 1.3749 is the immediate target above the broken triple top. On the downside, 1.3514 is the first meaningful support.
Stocks
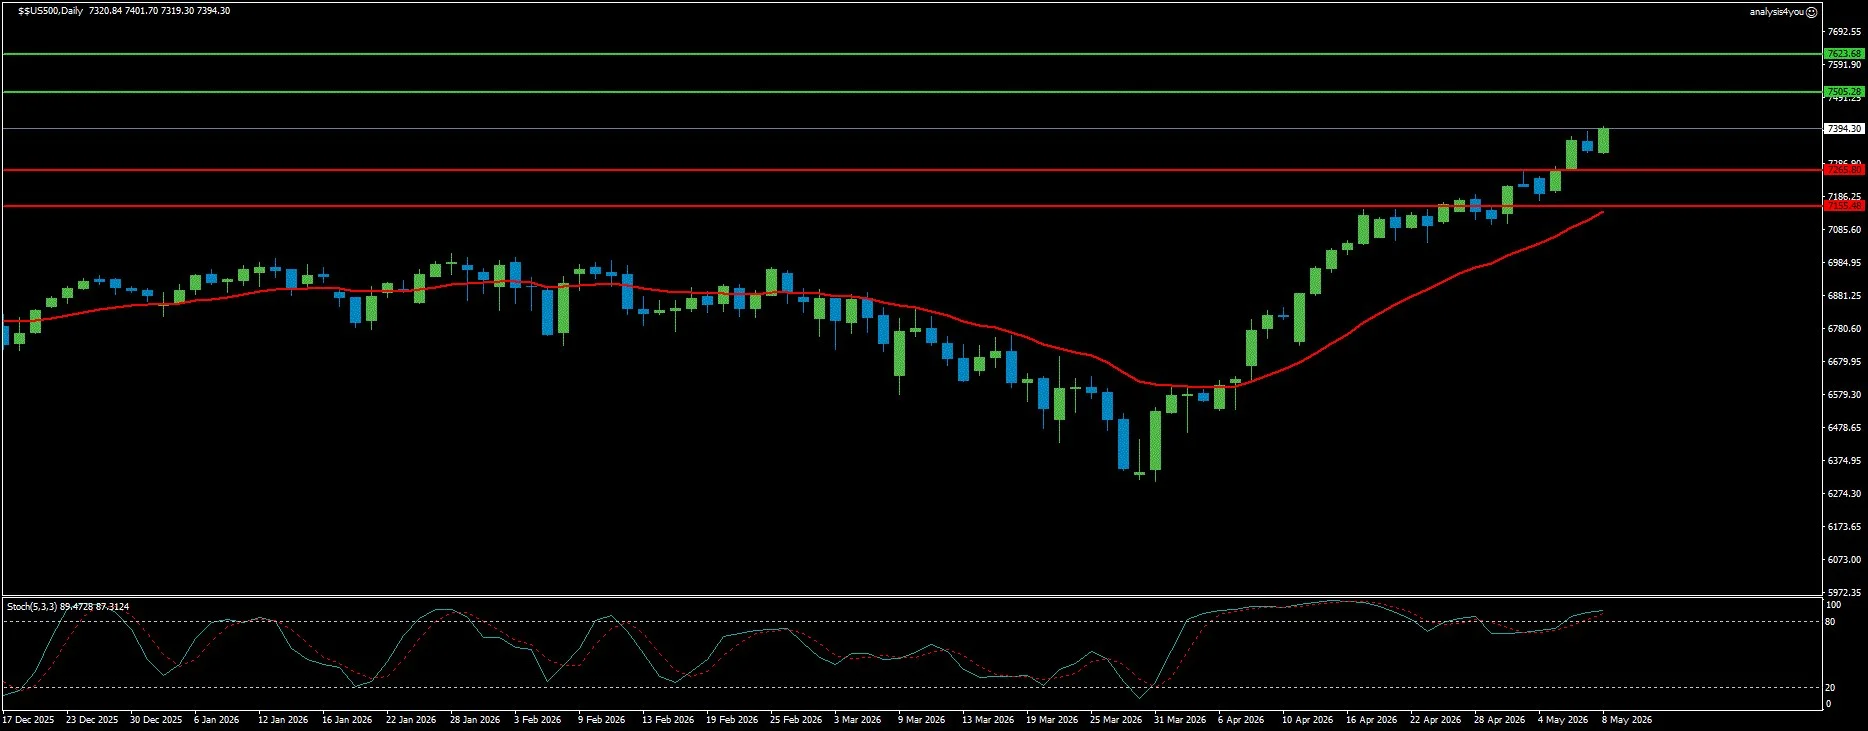
S&P 500: Seventh Consecutive Weekly Gain, New ATH at 7,398 (7,394)
Current Trend: Bullish
Resistance: 7,505 | 7,624
Support: 7,266 | 7,155
The S&P 500 posted its seventh consecutive weekly advance (extending the longest winning streak since October 2024) closing at approximately 7,394 to 7,400 (a new all-time high). The Nasdaq hit approximately 29,000 to 29,235. The combined S&P 500 and Nasdaq have risen 17% and 27% respectively from their March 30 bottoms (described as one of the strongest reversals in US stock market history). The driver is unambiguous: AI-driven corporate earnings momentum has overwhelmed geopolitical uncertainty. The earnings season delivered a historically significant verdict. Q1 2026 aggregate earnings growth of 27.8% YoY (the highest since Q4 2021) with 83% of reporting companies beating estimates and 78% beating revenue. Retail investors poured over $1.1 billion in the week (the second-largest weekly retail purchase on record). Sandski returned over 7,731% in the past year (surpassing Qualcomm’s record from 1999 and marking the strongest annual return of the entire Dot-Com Bubble era). The S&P 500 Stochastic at 89.47/87.31 is the most overbought reading since the war began (but crucially, it is in an uptrend with a bullish signal). Equities are at greater risk of a correction as Wall Street has notched up new record highs even before there has been an agreement on how to bring a permanent end to the Middle East conflict. The 30-year Treasury yield pressing toward the 4.97% to 5.08% zone is the structural risk. The week ahead for the S&P 500 is defined by Tuesday’s CPI and the Trump-Xi trade meeting in China. A hot CPI reinforces higher-for-longer rates, potentially pushing 30-year yields toward 5%. Technically, the S&P 500 is at 7,394, at upper Bollinger Bands with an overbought Stochastic in uptrend. Resistance at 7,505 is the immediate target. Support at 7,266 is the first floor.
Commodities
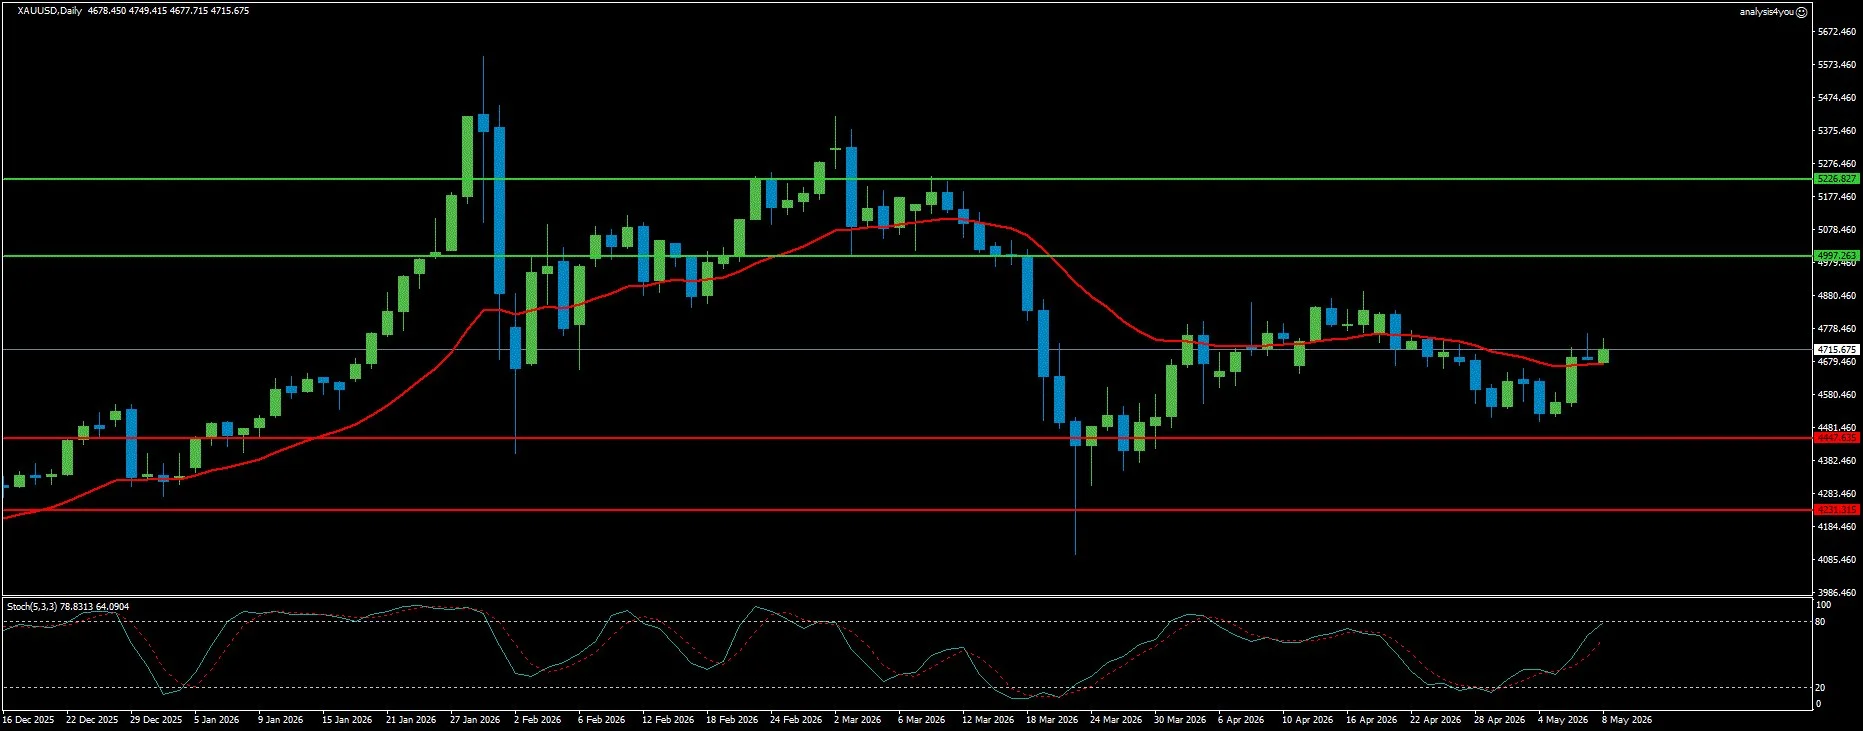
Gold: Most Bullish Stochastic Configuration in Weeks, CPI is the Catalyst (4,716)
Current Trend: Cautiously Bullish
Resistance: 4,997 | 5,227
Support: 4,448 | 4,231
Gold staged a dramatic recovery during the prior week (dropping nearly 2% Monday on Project Freedom escalation fears, rebounding Tuesday, gaining nearly 3% Wednesday on US-Iran peace deal reports, rising to a two-week high above $4,760 Thursday morning, then losing traction Thursday afternoon). The week ended with Gold stabilizing above $4,700. The Stochastic entering this week at 78.31/64.09 (overbought, uptrend, bullish signal) is the most bullish Gold Stochastic configuration in weeks. This represents a significant shift from last week’s approaching-oversold reading at 36.06/26.26. Gold has recovered from the lower Bollinger Band environment to the middle bands this week. The critical question is whether the $4,780 resistance (50-day SMA, 100-day SMA) can be overcome. The April CPI on Tuesday is the defining data event for Gold. Wells Fargo forecasts headline CPI at +0.63% monthly (lifting YoY to 3.8%) with core CPI at +0.50% in April and 2.9% YoY. A stronger-than-forecast monthly core CPI would point to spillover from energy inflation (the USD gathers strength, Gold turns south). A soft core CPI would have the opposite effect. The Iran proposal response (expected from Tehran during the weekend) is the geopolitical variable that supersedes all data. If Iran accepts the US 14-point memorandum, oil crashes and rate cut hopes revive (a strongly bullish Gold scenario). Technically, Gold is at $4,716, with the current bar at middle Bollinger Bands. Above MA 20 and MA 200, but still below MA 50. The Stochastic at 78.31/64.09 is in the overbought zone in an uptrend with a bullish signal. On the upside, $4,780 (50-day SMA) is the first resistance, ahead of $4,866 (Fibonacci 38.2% retracement) and $5,000.
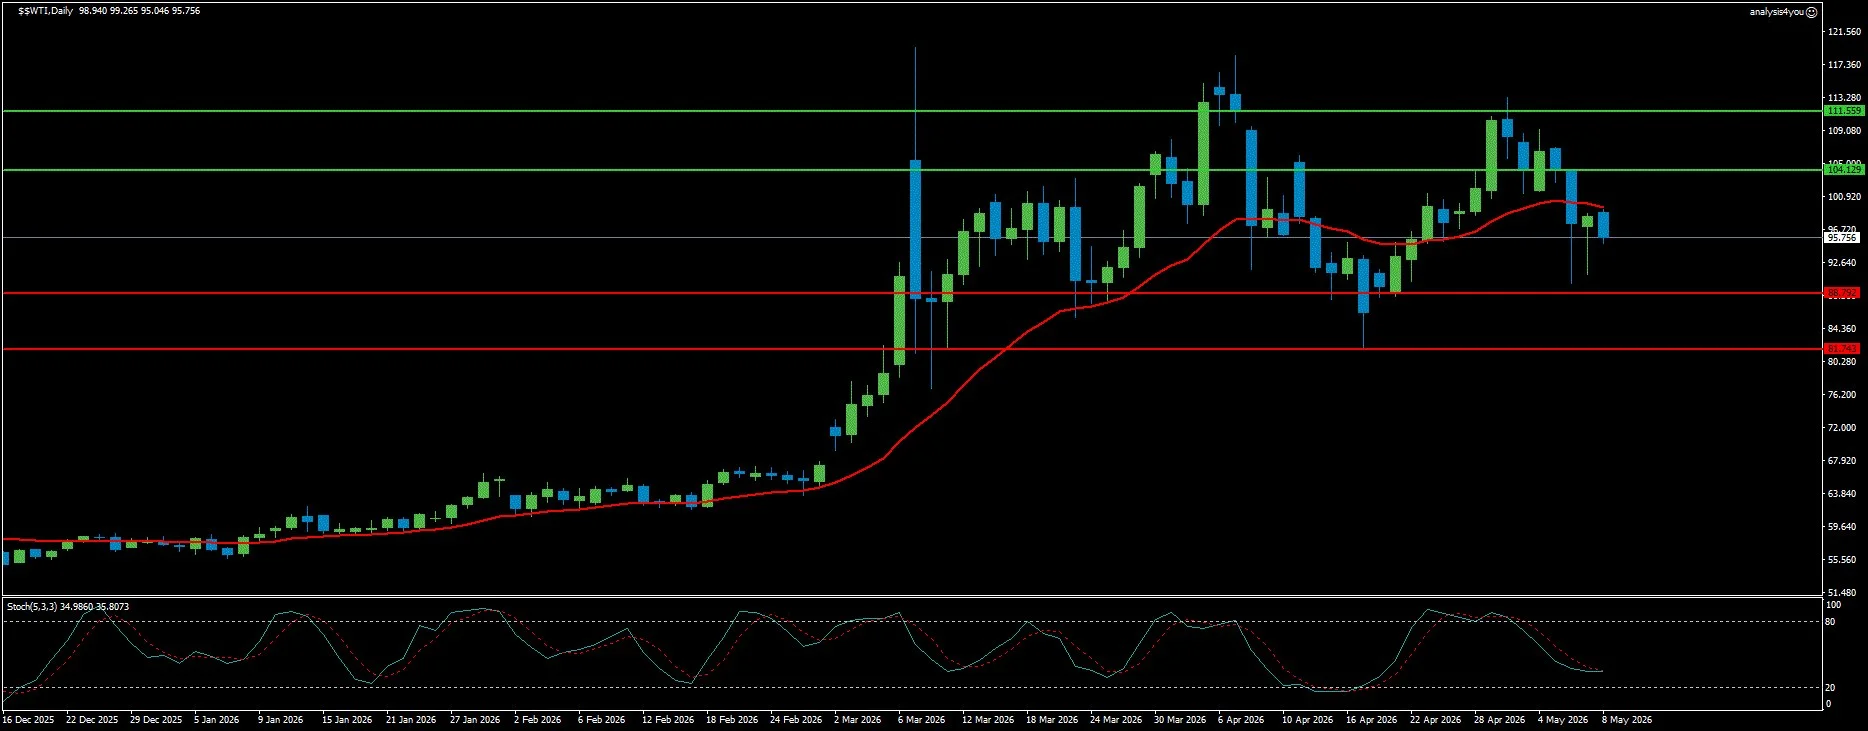
WTI Crude Oil: Peace Hopes Drive 7% Weekly Loss, $89 SMA Floor is Critical (95.76)
Current Trend: Neutral to Bearish
Resistance: 104.13 | 111.56
Support: 88.79 | 81.74
WTI crude oil posted a 7.39% weekly loss (its sharpest weekly decline since the Hormuz reopening announcement in mid-April) closing at approximately $92.47 per Valencia’s article and $95.76 per the chart. The primary driver was Iran’s submission of a peace proposal to Pakistani mediators, which triggered immediate de-escalation pricing. The Hormuz situation remains the central supply variable. WTI holds a constructive near-term bias as price remains above the triple SMA cluster around $91.98. The structural supply disruption has not ended: the Strait remains effectively shut. What has changed is the market’s assessment of how long the disruption will last. The Stochastic entering this week at 34.99/35.81 (approaching oversold, downtrend, bearish signal) is the most bearish WTI Stochastic configuration of the war period. The peace deal optimism has re-entered the market. The critical technical floor at $91.98 (triple SMA cluster) is being tested. A sustained break below $89 would signal the market is pricing a full Hormuz reopening (sending WTI toward $81.74 support). Conversely, if Iran rejects the US proposal and Trump orders fresh strikes, WTI spikes back above $104 immediately. The University of Michigan Consumer Sentiment deteriorating to its all-time low in May (with households feeling the pain from high gasoline prices) is the most powerful demand destruction signal yet. Technically, WTI is at approximately $95.76, with the Stochastic at 34.99/35.81 approaching oversold in a downtrend with a bearish signal. The triple SMA cluster near $91.98 is the critical near-term floor. A sustained break below this zone exposes $89.00, then $80.82. On the upside, 104.13 is the immediate resistance.
Crypto
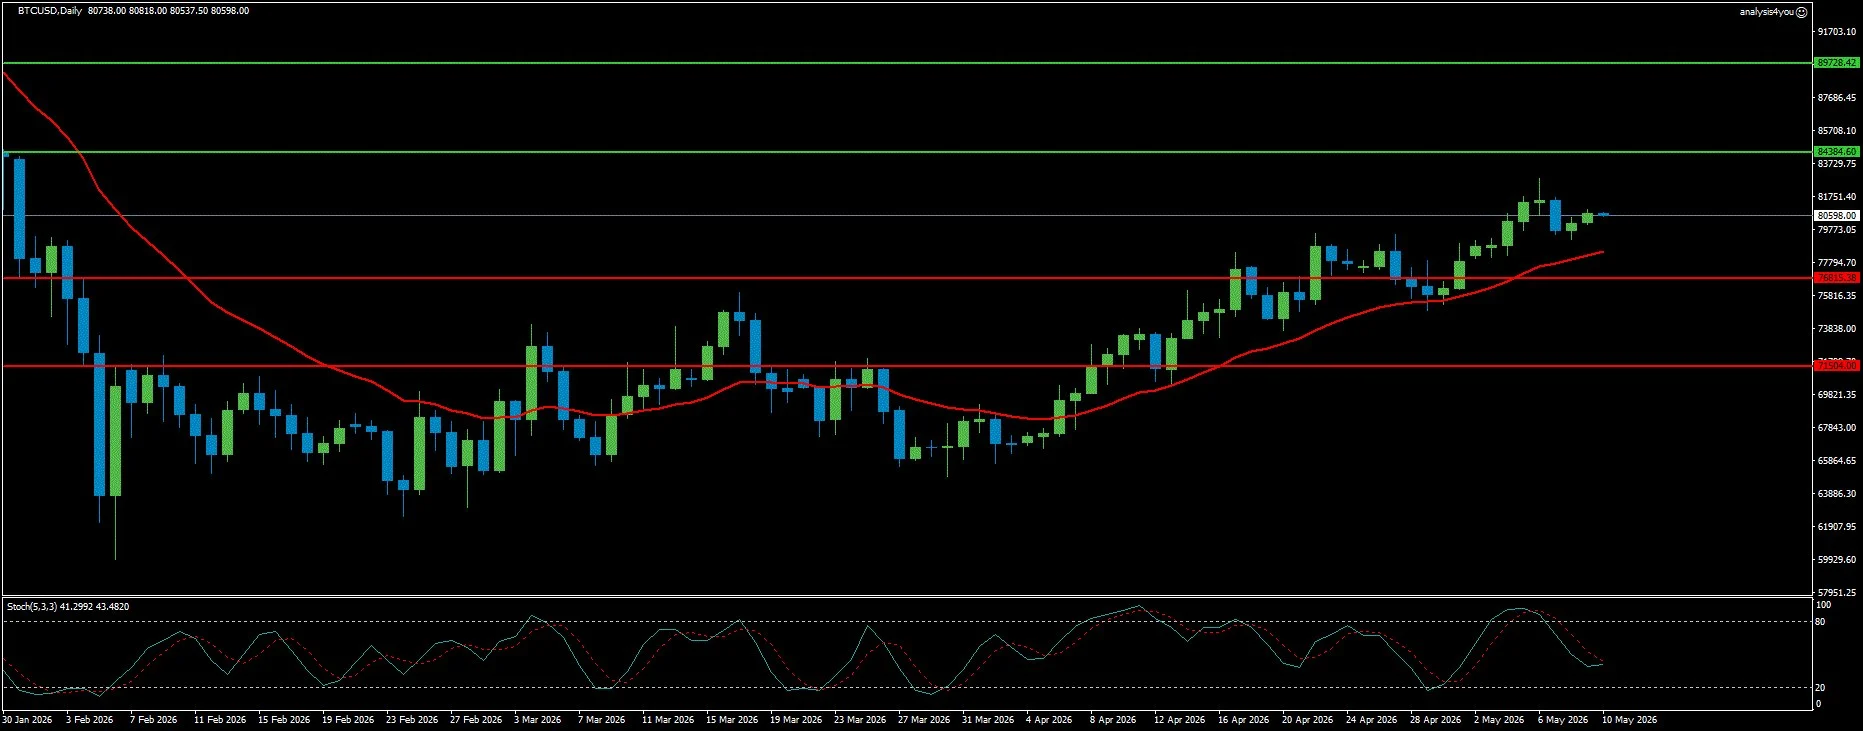
Bitcoin: $80K Broken and Held, 200-Day EMA is the Next Battle (80,598)
Current Trend: Cautiously Bullish
Resistance: 84,384 | 89,728
Support: 76,815 | 71,504
Bitcoin has achieved the milestone that three weeks of analysis identified as the defining level: $80,000 has been broken and (critically) held as support entering the new week. BTC hit a three-month high of $82,850 on Wednesday before being rejected at the convergence of the 200-day EMA at $82,049 and the 100-week EMA at $82,446 (a dual EMA resistance cluster). The pullback from $82,850 to below $80,000 intrawweek, followed by recovery back above $80,598 entering the week, confirms the $80,000 level has successfully transitioned from resistance to support. The institutional demand picture remained robust but with an important nuance. Spot Bitcoin ETFs recorded $768.40 million in net inflows through Thursday (on track for the sixth consecutive week of positive flows). However, daily realized profits spiked to 14,600 BTC on Monday (the highest since December 10, 2025). Bitcoin holders are realizing net profits of +20,000 BTC on a 30-day rolling basis. At 20,000 BTC net profit, the magnitude remains well below the 130,000 to 200,000 BTC thresholds associated with confirmed bull market regime transitions. This reinforces the bear market rally classification rather than a structural regime change. The current market structure (perpetual futures demand driving the surge while spot markets remain in contraction) mirrors the pattern seen at the onset of the 2022 bear market. The Iran war’s direct Bitcoin connection through the crypto transit fee proposal remains a structural medium-term demand catalyst that has not yet been implemented. Technically, BTC is at $80,598, consolidating just above the $80,000 psychological support. Above MA 20 and MA 50, still below MA 200 (at $82,049). The Stochastic at 41.30/43.48 is in the mid-range in an uptrend with a neutral signal. Sustained trade above $80,000 opens the way toward the 200-day EMA at $82,049 and $84,384 resistance. On the downside, initial support at $78,962, ahead of $76,815.
Key Events (May 11-15, 2026)
Weekend (May 10-11): Iran’s official response to the US 14-point memorandum expected.
Monday, May 11: Kevin Warsh officially becomes Fed Chair (Powell’s term expires May 15). US Senate expected to confirm Warsh. Markets digest Iran proposal response.
Tuesday, May 12: US April CPI (THE WEEK’S DEFINING DATA EVENT). Wells Fargo forecasts headline +0.63% MoM (lifting YoY to 3.8%), core +0.50% MoM (+2.9% YoY). Germany and Eurozone Q1 GDP second estimates.
Wednesday, May 13: US April PPI. Eurozone Q1 GDP second estimate. Fed’s Beige Book.
Thursday, May 14: UK Q1 GDP first estimate (the week’s primary GBP catalyst). US April Retail Sales. US Initial Jobless Claims.
Friday, May 15: Powell’s term as Fed Chair officially expires. Trump-Xi meeting in China. US Michigan Consumer Sentiment May final.
Week Ahead Outlook
The week of May 11 to 15 is defined by three simultaneous regime changes: Warsh replaces Powell, April CPI delivers the first inflation reading under the new Chair, and the Iran peace proposal awaits Tehran’s response.
Scenario 1: Iran Deal + Soft CPI + Warsh Dovish Signal (approximately 20%): Iran accepts the US 14-point memorandum. Hormuz reopens. WTI crashes below $89 toward $81.74. CPI comes in soft (headline at 3.5% or below, core monthly at 0.3% or below). Risk-on surge. DXY breaks below 96.46 toward 95.55. EUR/USD breaks 1.1912 toward 1.2042. GBP/USD breaks 1.3749 toward 1.3864. S&P 500 breaks 7,505 targeting 7,624. Gold surges through $4,780 toward $4,866 and $5,000. BTC breaks above $82,049 targeting $84,384.
Scenario 2: Diplomatic Stalemate + Mixed CPI + Warsh Neutral (approximately 50%): Iran responds ambiguously. WTI holds $88 to $100 range. CPI at 3.6% to 3.9% headline and core monthly at 0.4% to 0.5% (elevated but within expectations). Warsh makes no major policy statements. Intraweek direction driven by CPI heat/miss and UK GDP Thursday. DXY holds 96.46 to 98.80. EUR/USD consolidates 1.1670 to 1.1912. GBP/USD holds 1.3514 to 1.3749. S&P 500 consolidates 7,266 to 7,505. Gold holds $4,448 to $4,780. This is the most likely base case.
Scenario 3: Iran Rejection + Hot CPI + Re-escalation (approximately 30%): Iran rejects the US proposal. Trump orders fresh strikes. WTI spikes back above $104. CPI comes in hot (headline above 4%, core monthly above 0.6%). Warsh faces immediate pressure to signal hawkishness. DXY bounces to 98.80 and 99.78. EUR/USD falls below 1.1670 toward 1.1540. GBP/USD breaks below 1.3514. S&P 500 pulls back below 7,266. Gold paradoxically sells off initially on rising real yields. BTC corrects below $76,815 toward $71,504.
Bottom line: The Warsh era begins with the Federal Reserve more divided than at any point in Powell’s tenure, the Iran war unresolved after ten weeks, equity markets at all-time highs on AI earnings momentum, and the Dollar in its sharpest structural downtrend since the conflict began. The DXY at lower Bollinger Bands with a bearish Stochastic downtrend tells the story of a reserve currency under pressure. EUR/USD at upper Bollinger Bands and GBP/USD above upper Bollinger Bands tell the mirror story (the de-dollarization geopolitical risk premium is underway). Whether Tuesday’s CPI or the Iran proposal response confirms or challenges this regime change will define not just this week but the entire second quarter of 2026.

