Trump Announces Iran Peace Deal “Largely Negotiated”, Hormuz to Reopen
Market Sentiment Overview
The week of May 25 to 29 opens with the most consequential single weekend development of the entire three-month Iran war. On Saturday May 24, US President Donald Trump announced on Truth Social that Washington and Iran have largely negotiated a memorandum of understanding on a peace deal that would reopen the Strait of Hormuz, brokered through Pakistani mediation. Trump wrote: Final aspects and details of the Deal are currently being discussed, and will be announced shortly. Secretary of State Rubio said from New Delhi that if the outline is agreed on, it would mean completely open straits and without tolls. Two Pakistani sources confirmed that the Strait would open immediately after the US lifted its blockade. The proposed framework would unfold in three stages: formally ending the war, resolving the Hormuz crisis, and launching a 30-day window for negotiations on a broader agreement. Iran’s response was cautiously constructive but not unconditionally positive. Foreign Ministry spokesperson Baghaei said the trend this week has been towards a reduction in disputes, but there are still issues that need to be discussed through mediators. Even with residual uncertainty, the market context entering the week has fundamentally shifted. The prior week delivered the FOMC Minutes from the April 28-29 meeting (the most hawkish Fed communication since the inflation shock) with many policymakers signaling they would have preferred to remove the easing bias from the policy statement altogether. CME FedWatch now prices approximately 60% probability of at least one Fed rate hike by end-2026, and nearly 15% chance of two hikes. The 10-year Treasury yield hit its highest level since January 2025, near 4.7%, before easing slightly as peace hopes emerged Thursday. Kevin Warsh was sworn in as the 17th Fed Chair on Friday (the first to take the oath at the White House since Alan Greenspan in 1987). The prior week’s Stochastic readings tell a coherent story that the Iran deal weekend news now dramatically amplifies. Three instruments (EUR/USD, GBP/USD, and Gold) show bullish Stochastic divergence: price at or near lower Bollinger Bands while Stochastic has turned to an uptrend with bullish signals. This is the technical setup for a sharp short-covering rally, which the peace deal news would accelerate.
Currencies
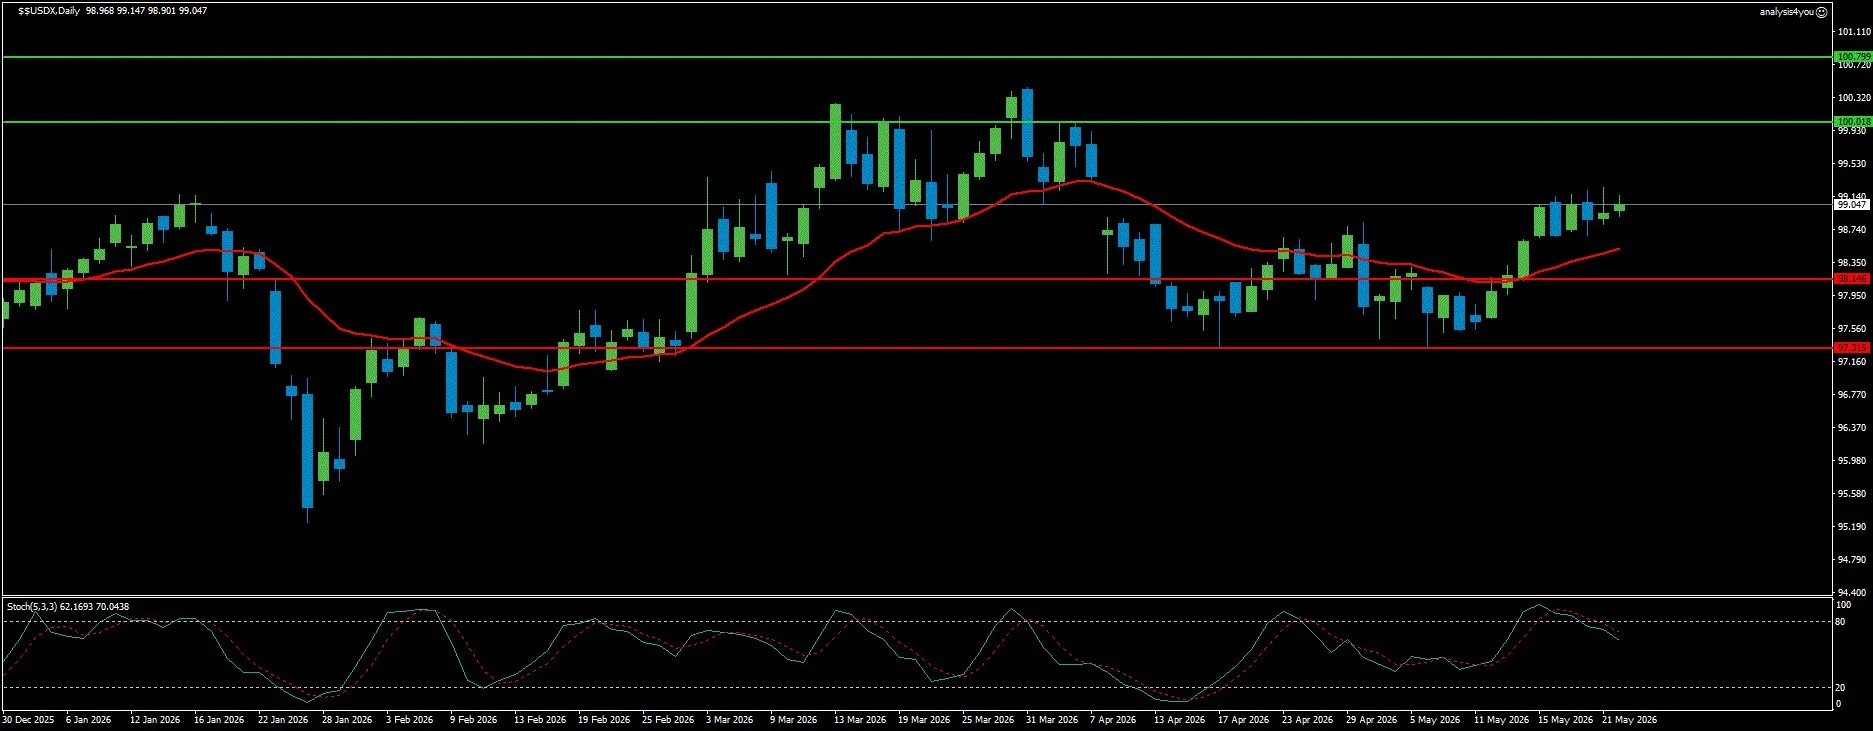
USD Index: Consolidation at Breakout Level, Peace Deal Is Primary Reversal Risk (99.05)
Current Trend: Neutral to Bullish
Resistance: 100.02 | 100.80
Support: 98.15 | 97.32
The US Dollar consolidated exactly as technical analysis suggested (the DXY oscillated between 98.80 and 99.40 throughout the prior week, confirming the 99.00 zone as the new support floor). At 99.05, the Dollar is essentially unchanged from last week’s 99.01. The fundamental support for the Dollar (higher-for-longer Fed expectations, 60% probability of a rate hike by end-2026, resilient labor market with 115K jobs and 3.6% wage growth, and sticky CPI/PPI) remains fully intact. However, the weekend Iran deal announcement is the single most important development for Dollar direction entering Monday’s Asian session. A confirmed, signed peace deal between the US and Iran with Hormuz reopening would be materially USD-bearish through multiple channels: simultaneously oil prices crash, easing global inflation expectations, the Fed’s hawkish pivot rationale weakens, risk-on sentiment favors non-Dollar assets, and the geopolitical safe-haven premium embedded in the Dollar since February 28 unwinds. The Stochastic at 62.17/70.04 has decomposed from the deeply overbought 95.05/82.55 of last week to mid-range (a healthy consolidation signal within the uptrend if the peace deal does not materialize). The week’s primary data event for Dollar direction is April PCE on Thursday. The Fed’s preferred inflation gauge is expected to show further acceleration. A softer PCE (particularly core PCE below 0.4% monthly) would revive rate cut expectations and pressure the Dollar. Technically, DXY is at 99.05, above all three major moving averages with price at upper Bollinger Bands. The Stochastic at 62.17/70.04 is in mid-range with a downtrend and bearish signal. Resistance at 100.02 is the primary target. Support at 98.15 / 97.32.
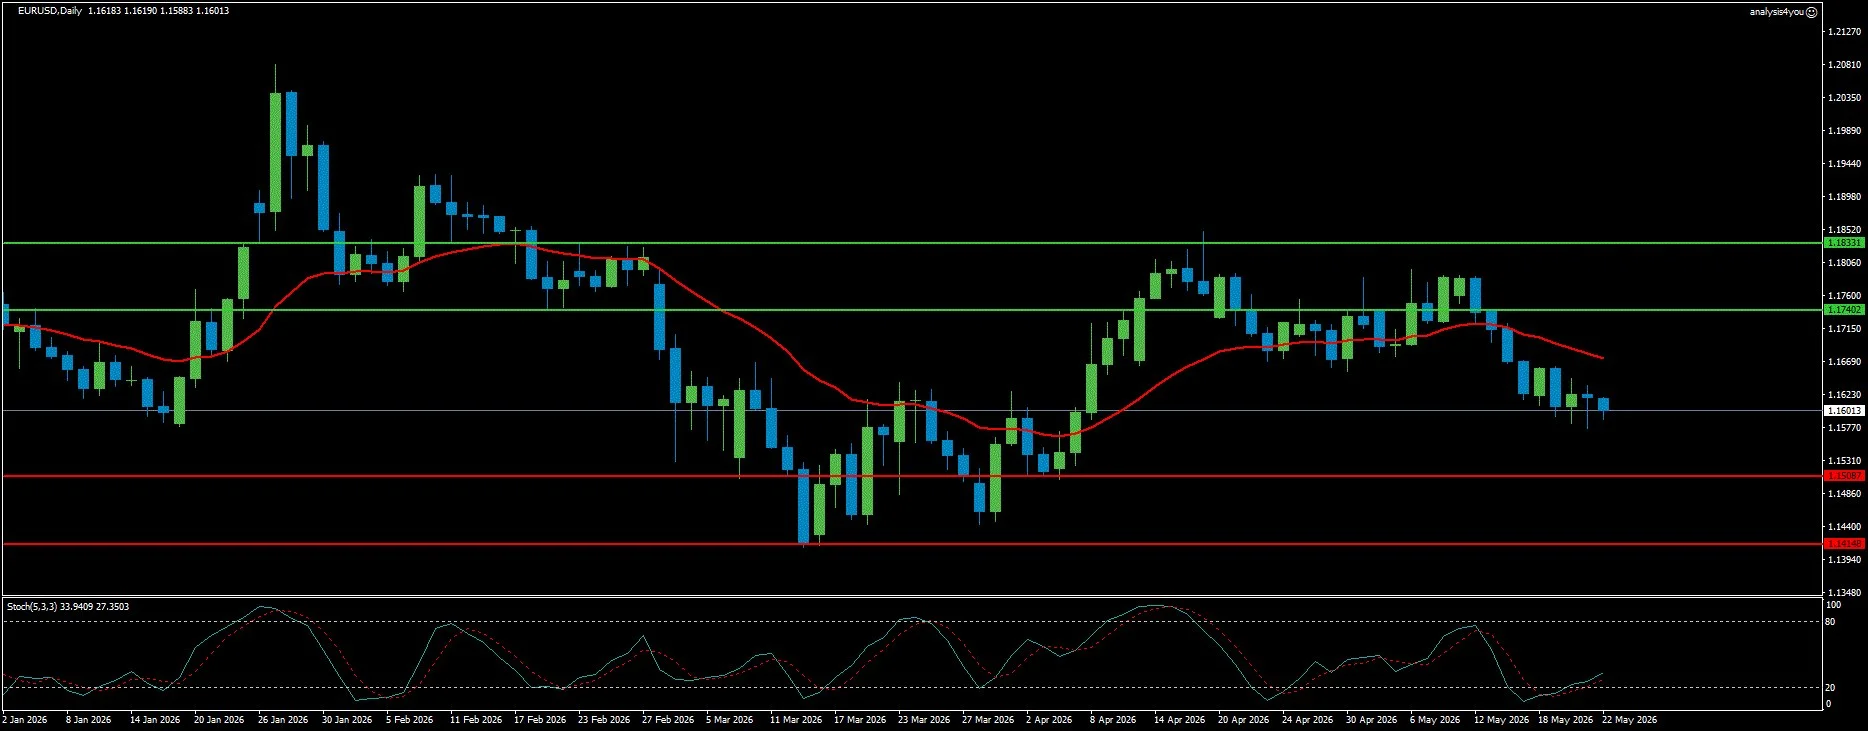
EUR/USD: Bearish Trend, Bullish Stochastic Divergence, Peace Deal Is Bounce Catalyst (1.1601)
Current Trend: Bearish
Resistance: 1.1740 | 1.1833
Support: 1.1509 | 1.1415
EUR/USD has now fallen for three consecutive weeks (from the 1.1785 upper Bollinger Band breakout of three weeks ago to 1.1601 this week, breaking below the 200-day SMA for the first time since the war began). The pair is now below MA 20, MA 50, and MA 200 simultaneously. The fundamental drivers of the decline are unchanged: hot US inflation driving Fed rate hike expectations to 60% probability, hawkish FOMC Minutes, DXY at its strongest level since the war began, and persistent Hormuz closure keeping European inflation elevated while growth remains near zero (Q1 GDP +0.1%). However, the most important technical signal entering this week is the Stochastic divergence: the Stochastic at 33.94/27.35 has turned to an uptrend with a bullish signal while price is still at lower Bollinger Bands. This divergence (bullish momentum turning while price makes new lows) is the classic precursor to a technical reversal. The Iran deal weekend news is the fundamental catalyst that could trigger exactly the bounce the Stochastic divergence is warning about. A confirmed Hormuz reopening would: crash oil prices, ease Eurozone inflation from its 3.0% YoY April reading, revive ECB flexibility, and trigger a risk-on environment that historically benefits the Euro. The ECB’s June 11 rate hike (now widely expected) is a structural EUR support. Technically, EUR/USD is at 1.1601, with two consecutive bars at lower Bollinger Bands. Below MA 20, MA 50, and MA 200. The Stochastic at 33.94/27.35 is in mid-range with an uptrend and bullish signal (the critical divergence). Resistance at 1.1740 is the immediate ceiling. Support at 1.1509 / 1.1415.
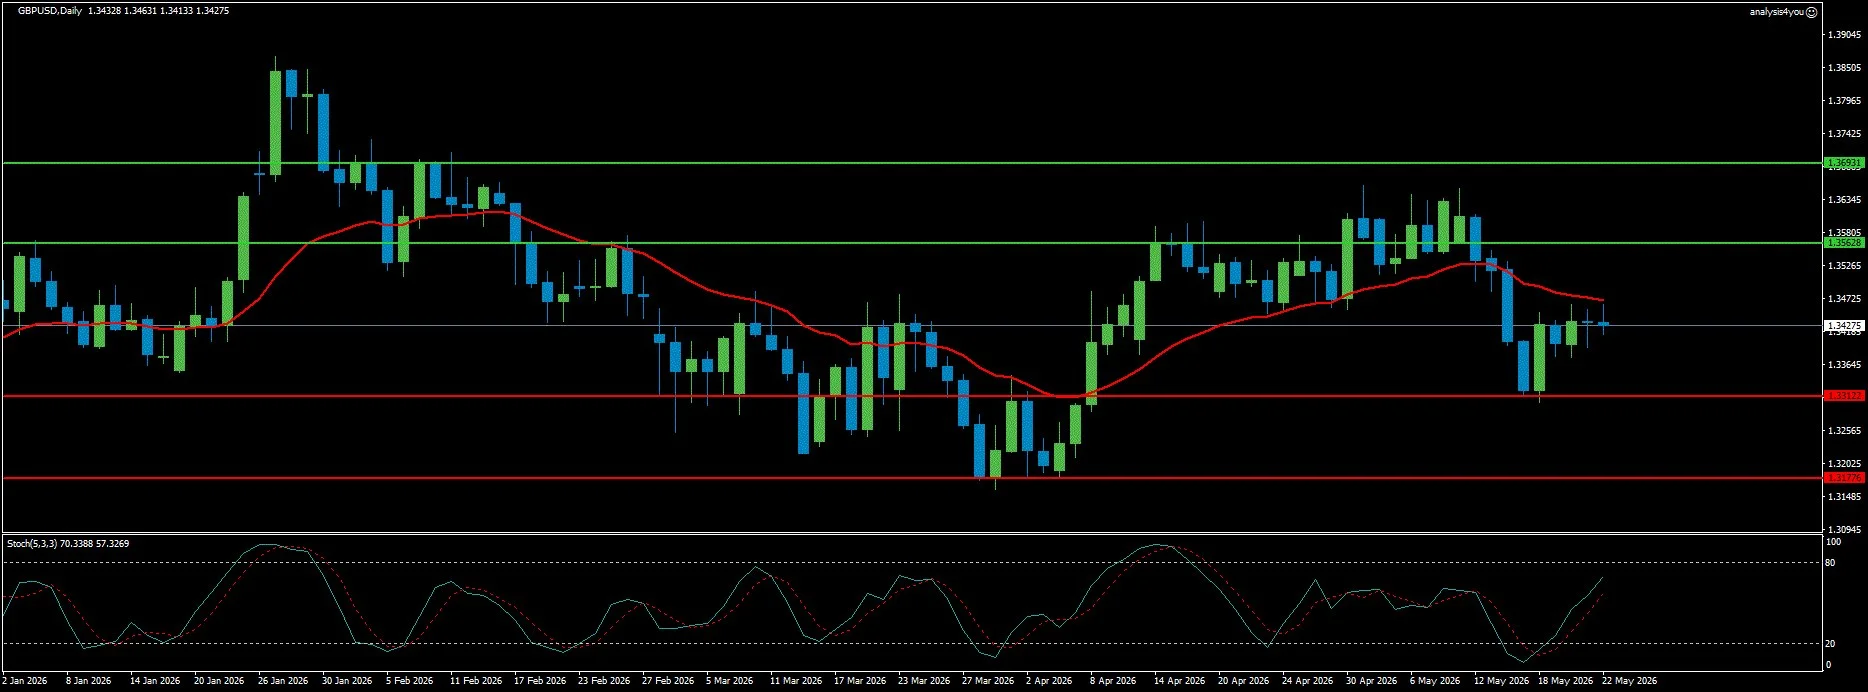
GBP/USD: V-Shaped Bounce, Back Above 200-Day MA, Political Risk Remains (1.3428)
Current Trend: Cautiously Bullish
Resistance: 1.3563 | 1.3693
Support: 1.3312 | 1.3178
GBP/USD staged a significant recovery from last week’s multi-week lows at 1.3322 to 1.3428 (a 106-pip gain that brought the pair back above the 200-day MA at approximately 1.3380). This is the most important development on the GBP/USD chart: after breaking below all three major MAs two weeks ago, the pair has reclaimed the 200-day MA and is attempting to rebuild. The Stochastic at 70.39/57.33 (overbought in an uptrend with a bullish signal) reflects the strongest momentum reading on the Cable chart since the war began. The fundamental picture for Sterling is genuinely mixed. Markets largely shrugged off weaker-than-expected UK data while remaining focused on US-Iran peace deal headlines. The UK political risk (70+ Labour MPs urging Starmer to resign, Andy Burnham as a potential challenger, 10-year Gilt yields at 5.14%) remains a structural GBP headwind. The BoE’s hawkish positioning (8-1 hold with Pill dissenting for a hike, Bailey warning against waiting for second-round effects) provides structural GBP support from the rate differential angle. The week ahead brings UK employment data Tuesday and UK CPI Wednesday. Technically, GBP/USD is at 1.3428, above MA 200 but still below MA 20 and MA 50. The Stochastic at 70.39/57.33 is in the overbought zone with an uptrend and bullish signal. The 200-day MA reclaim is the most important technical development. Resistance at 1.3563 is the next meaningful test. Support at 1.3312 / 1.3178.
Stocks
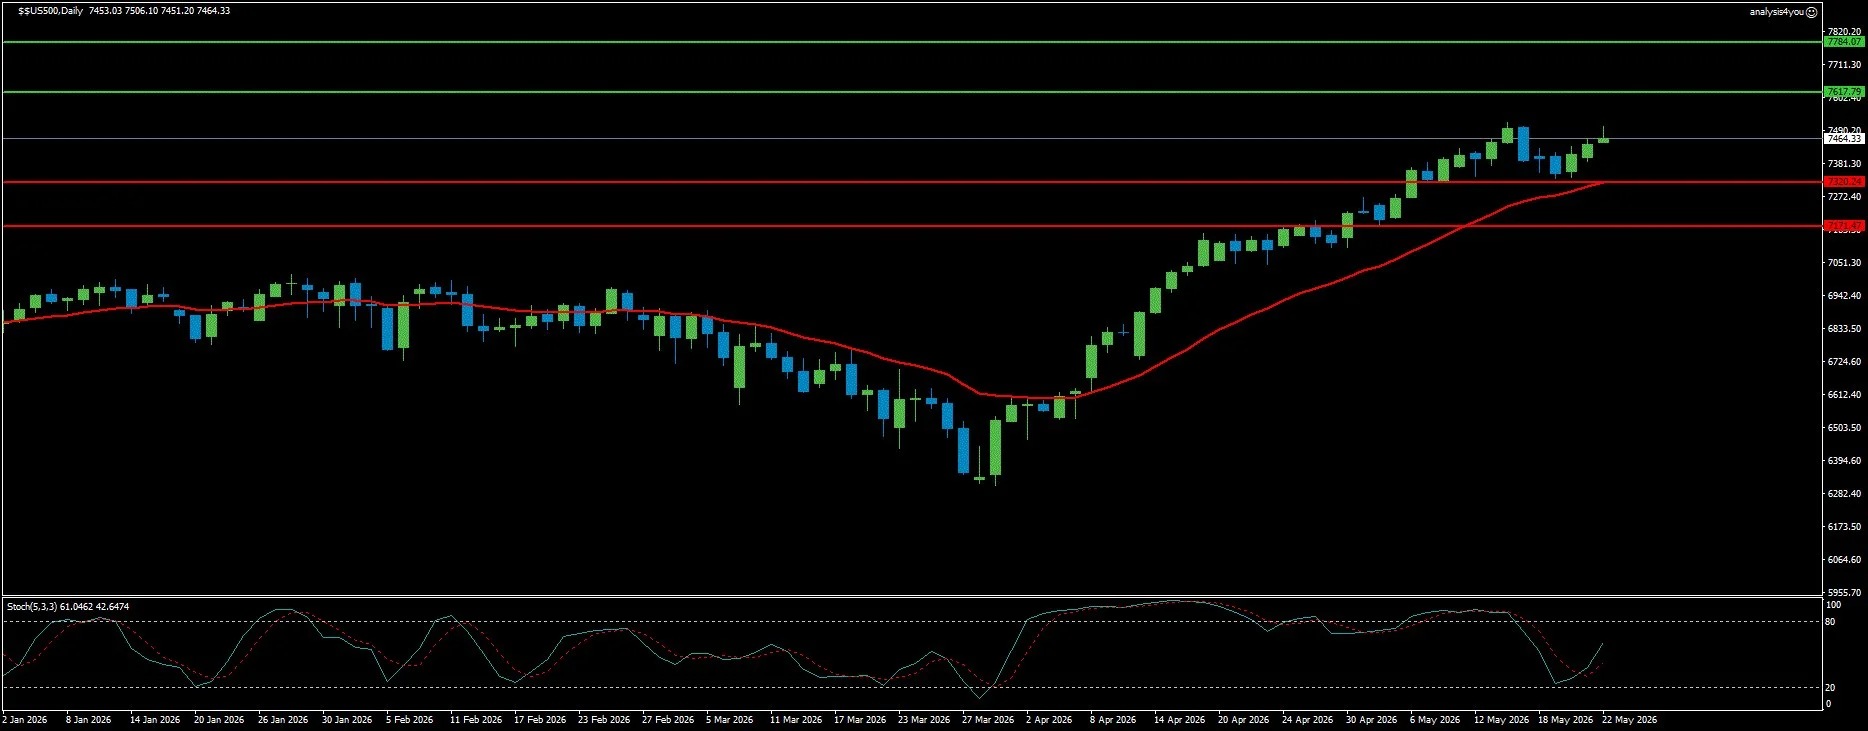
S&P 500: Eighth Consecutive Weekly Gain, Nvidia Beat Confirmed, Breadth Warning Persists (7,464)
Current Trend: Bullish
Resistance: 7,618 | 7,784
Support: 7,320 | 7,171
The S&P 500 posted its eighth consecutive weekly advance (extending the longest winning streak since October 2024) with Nvidia’s record quarter delivering the AI earnings confirmation the market needed. Nvidia posted record revenue of $81.6 billion, beating the $78.6 billion consensus, and guided for $91 billion in the next quarter. ARM surged 42.48%, DELL gained 24.01%, QCOM rose 16.95% (all driven by AI-related tailwinds). The AI narrative is no longer speculative. The equal-weighted S&P 500 fell 1.29% (confirming the narrow breadth concern has not resolved). Consumer sentiment hit an all-time low (the University of Michigan preliminary May reading recorded its lowest level ever) yet the S&P 500 continues to advance. The Iran deal weekend announcement is the most significant equity macro event since the war began. A confirmed peace deal and Hormuz reopening would trigger a dramatic sector rotation: energy stocks would crash as oil prices collapse, while consumer discretionary, airlines, and logistics would surge. The week ahead’s primary equity catalyst: Iran deal evolution (Monday gap), Thursday PCE and Q1 GDP second estimate. Technically, the S&P 500 is at approximately 7,464. The Stochastic at 61.05/42.65 is in the overbought zone with a downtrend and bearish signal (the first bearish Stochastic divergence since the March 30 bottom, now in its second consecutive week). Resistance at 7,618 is the immediate target. Support at 7,320 / 7,171.
Commodities
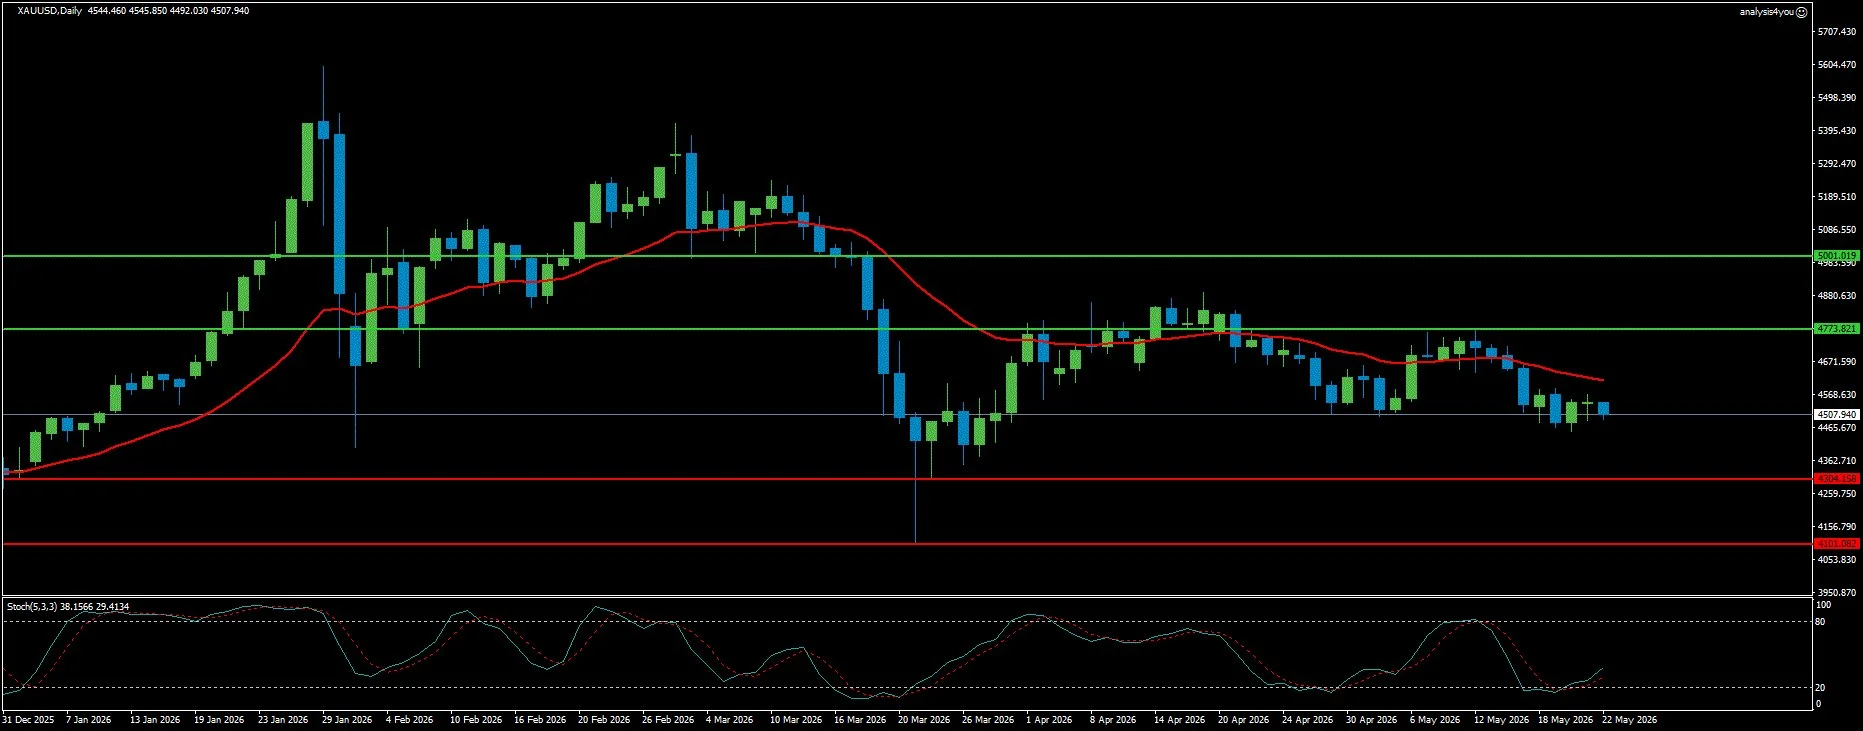
Gold: Third Weekly Loss, Descending Triangle Critical, Peace Deal Is Inflection (4,508)
Current Trend: Bearish
Resistance: 4,774 | 5,001
Support: 4,304 | 4,101
Gold has declined for three consecutive weeks (from the $4,770 two-week high three weeks ago to $4,508 entering this week). Gold struggled to attract buyers, with the 10-year Treasury yield climbing to its highest level since January 2025, near 4.7%. Gold came under renewed bearish pressure and lost nearly 2% in a single day (Tuesday) to touch its lowest level in three weeks near $4,460. BNY Mellon’s abandonment of their call for two Fed rate cuts is the most important institutional sentiment shift for Gold. The FOMC Minutes were the decisive bearish catalyst. CME FedWatch now prices 60% probability of at least one rate hike by end-2026. The descending triangle pattern (with the 200-day SMA and triangle base converging at $4,375 to $4,380) is the most critical technical structure. A close below $4,375 to $4,380 would be a decisive bearish breakout. The Iran deal weekend announcement is the most powerful single catalyst for a Gold reversal. If Hormuz reopens and oil crashes: energy inflation eases, the Fed’s hawkish rationale weakens, rate cut expectations revive, and the 10-year yield would fall (all simultaneously bullish for Gold). The Stochastic at 38.16/29.41 is approaching oversold with an uptrend and bullish signal (the same divergence seen in EUR/USD, confirming the technical setup for a sharp bounce if a fundamental catalyst arrives). Technically, Gold is at $4,508. The Stochastic at 38.16/29.41 is approaching oversold with an uptrend and bullish signal. The $4,375 to $4,380 support zone is the most critical level. Break below triggers $4,240 and $4,100.
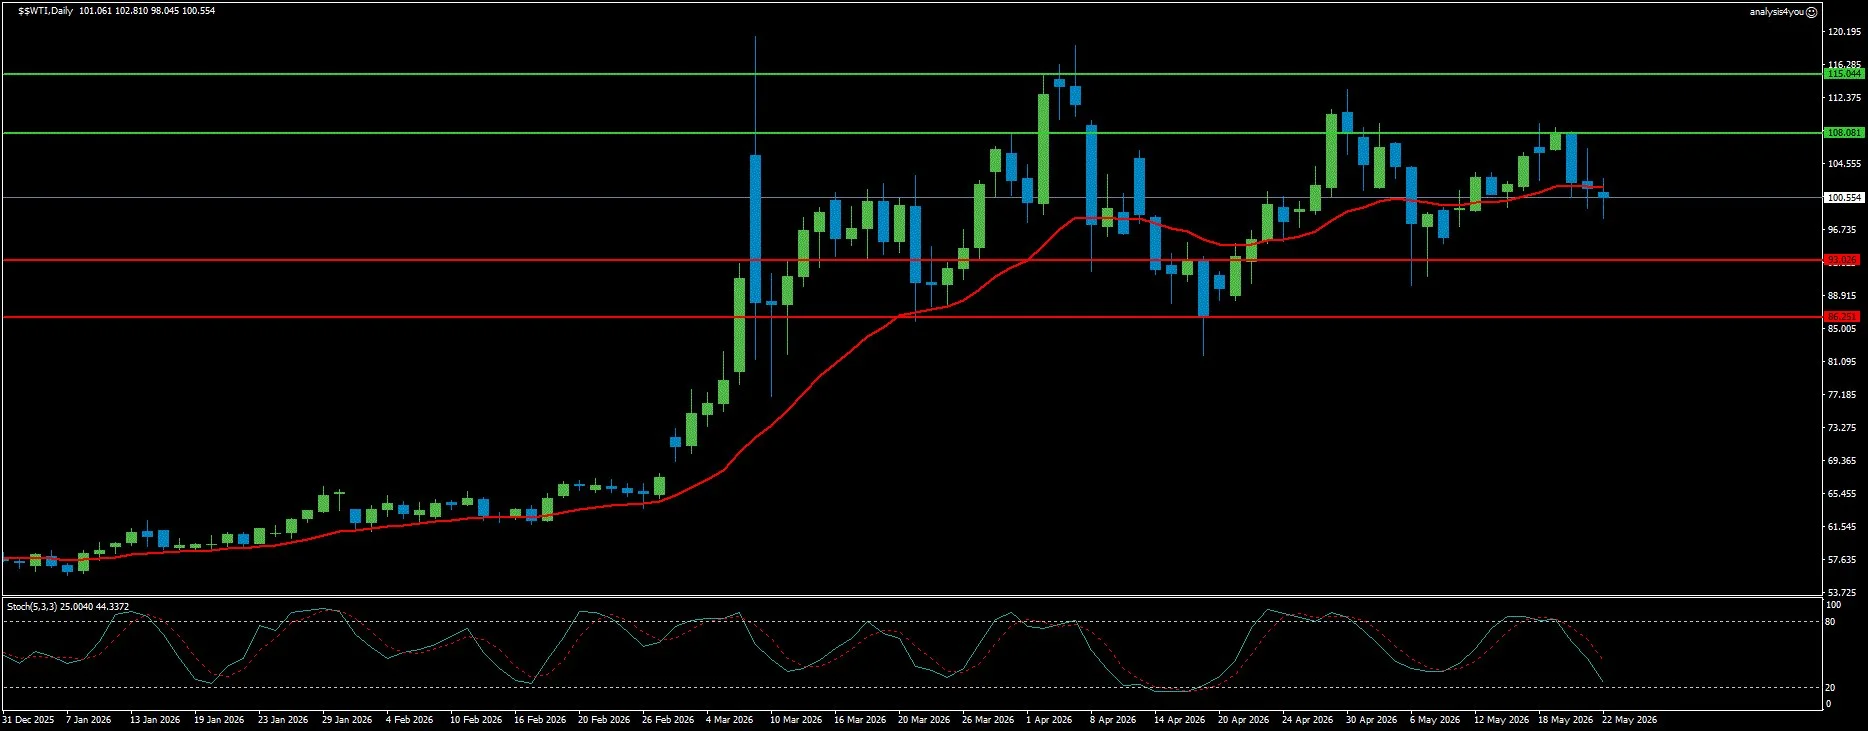
WTI Crude Oil: Peace Deal Is Most Explosive Downside Catalyst in War’s History (100.55)
Current Trend: Bearish
Resistance: 108.08 | 115.04
Support: 93.03 | 86.25
WTI crude oil declined approximately 9% during the prior week (its worst weekly performance in over a month) as Iran peace deal hopes dominated. The Iran deal weekend announcement (Trump stating the deal is largely negotiated) is the most explosive potential downside catalyst for WTI in the entire three-month war. A confirmed peace deal would remove the primary supply disruption narrative. The supply picture is more complex. The ADNOC executive’s warning is the most important structural context: even if the war ends now, full Hormuz flows will not return before Q1 or Q2 2027. Trump’s rejection of Iran’s toll proposals is consistent with the emerging framework that Rubio described as completely open straits and without tolls. Saudi Aramco CEO Amin Nasser’s warning that the global market is losing roughly 100 million barrels of supply each week establishes the magnitude of what a genuine reopening would mean. The Stochastic at 25.00/44.34 is approaching oversold territory in a downtrend with a neutral signal.
Support levels have been adjusted significantly lower (new support at 93.03 and 86.25). Technically, WTI is at approximately $100.55. The Stochastic at 25.00/44.34 is approaching oversold in a downtrend. Resistance at 108.08 / 115.04. Support at 93.03 / 86.25.
Crypto
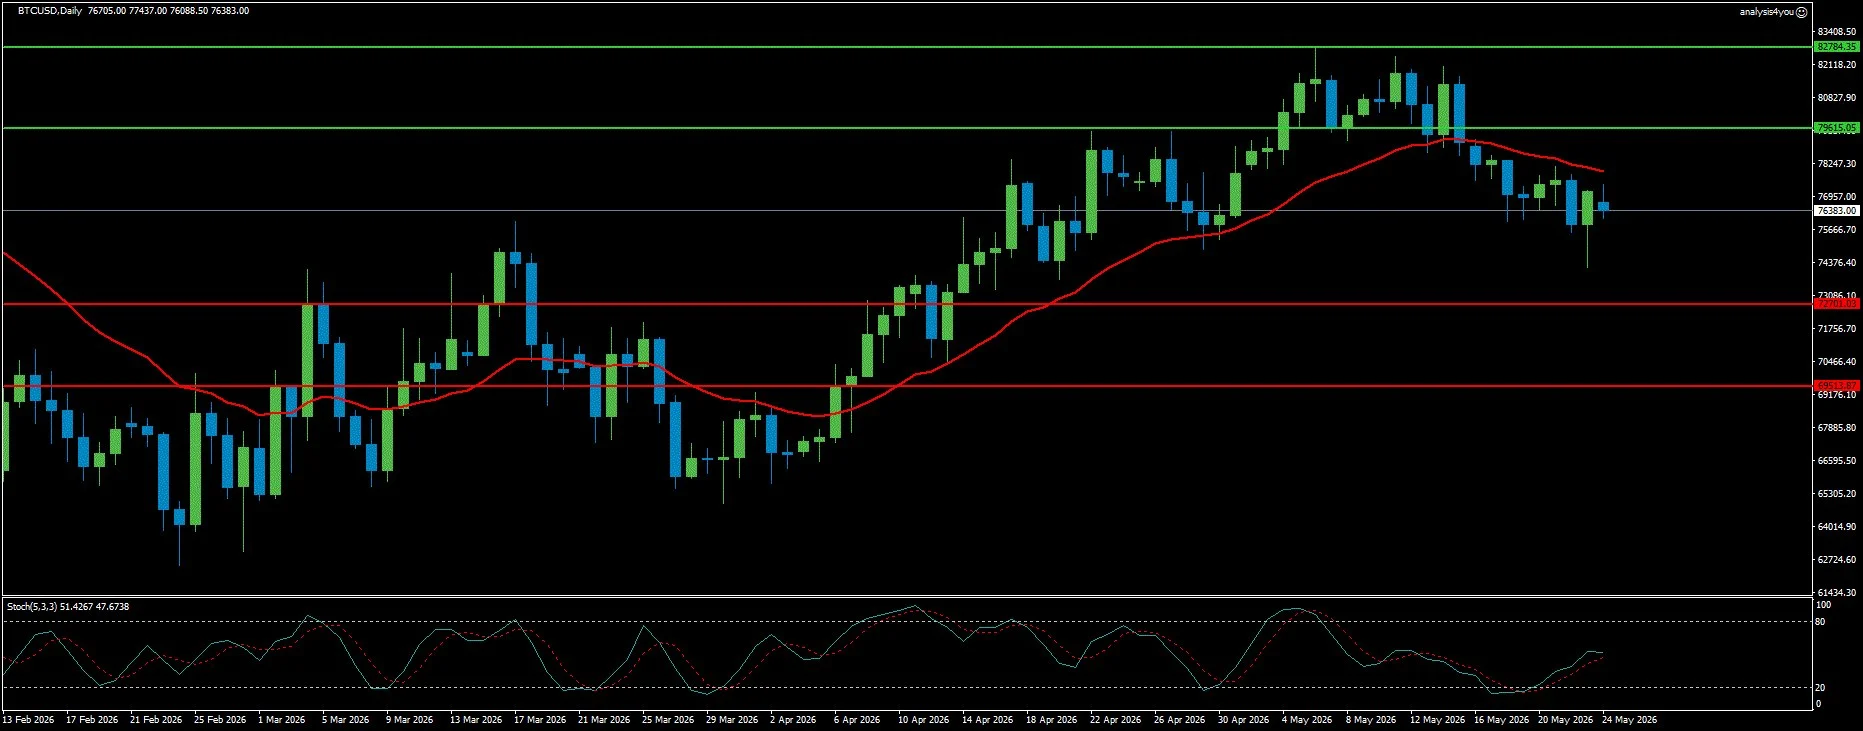
Bitcoin: Below All Three MAs, Second Consecutive Week of Billion-Dollar ETF Outflows (76,383)
Current Trend: Bearish
Resistance: 79,615 | 82,784
Support: 72,701 | 69,514
Bitcoin has broken below all three major moving averages simultaneously (MA 20, MA 50, and MA 200) for the first time since the war began. At $76,383, BTC is now in the most technically vulnerable position of the entire war period. The second consecutive week of over $1 billion in ETF outflows ($1.15 billion through Thursday) is the institutional signal. CryptoQuant’s on-chain assessment provides the most comprehensive bearish framework. Bitcoin’s overall demand has flipped into net contraction. The April rally was mostly driven by perpetual futures demand (a speculative rather than fundamental driver). Spot apparent demand is now contracting. US-based spot ETFs turned net sellers. The Coinbase Bitcoin Price Premium chart has remained negative. The macro environment adds further headwinds. The hawkish FOMC Minutes with 60% probability of at least one Fed rate hike creates a risk-off environment. The 10-year Treasury yield near 4.7% raises the opportunity cost. The two structural positives are the medium-term CLARITY Act and Iran’s Hormuz Safe Bitcoin-backed insurance service. Technically, BTC is at $76,383, below MA 20, MA 50, and MA 200 simultaneously. The Stochastic at 51.43/47.68 is in mid-range with a downtrend and neutral signal. Resistance at $79,615 / $82,784. Support at $72,701 / $69,514.
Key Events (May 25-29, 2026)
Weekend (May 23-25): Trump announced Saturday that the US-Iran peace deal is largely negotiated. The Monday Asian open (with US markets closed for Memorial Day) is the first market response.
Monday, May 26: US MARKETS CLOSED (Memorial Day). Asian and European markets open to the weekend Iran deal news.
Tuesday, May 27: US markets reopen. US Conference Board Consumer Confidence May. UK employment data.
Wednesday, May 28: Germany preliminary May HICP. UK CPI for April.
Thursday, May 29: US April PCE Price Index (THE WEEK’S DEFINING DATA EVENT). US Q1 GDP second estimate. US Initial Jobless Claims.
Friday, May 30: US Michigan Consumer Sentiment May final. Canada GDP.
Week Ahead Outlook
The week of May 25 to 29 is defined by a single binary event: whether the Iran peace deal announced by Trump on Saturday is confirmed or collapses.
Scenario 1: Iran Peace Deal Confirmed, Hormuz Reopens (approximately 35%): Sunday or early Monday brings a confirmed memorandum. WTI crashes toward $86.25. EUR/USD bounces toward 1.1740. GBP/USD extends toward 1.3563. DXY reverses toward 98.15. Gold surges toward $4,600. S&P 500 gaps higher toward 7,618. BTC recovers toward 79,615.
Scenario 2: Deal Stalls, Negotiations Continue (approximately 45%): No formal announcement. Markets open Monday with mixed signals. DXY holds 98.80 to 99.40 range. EUR/USD stabilizes 1.1509 to 1.1660. WTI holds $93 to $108. Gold holds $4,375 to $4,600. Thursday PCE becomes the defining catalyst. This is the most likely base case.
Scenario 3: Deal Collapses, Re-escalation (approximately 20%): Framework collapses. WTI spikes above $108. DXY surges above 100.02. EUR/USD breaks below 1.1509. S&P 500 pulls back toward 7,320. BTC breaks below $72,701.
Bottom line: Twelve weeks into the Iran war, the market may be approaching its most significant turning point. The weekend announcement that the deal is largely negotiated is the most credible peace signal of the entire war. The technical setups reflect a market that has partially priced de-escalation, while the EUR/USD, GBP/USD, and Gold bullish Stochastic divergences show that the counter-Dollar trade is beginning to reassert itself. This is the week where the twelve-week Iran war chapter may finally reach its resolution.

