NFP 57K Demolishes September Hike, Gold Snaps Four-Week Losing Streak, Iran Talks Resume
Market Sentiment Overview
The week of July 6 to 10 opens in the wake of the single biggest data shock since the war began: June Nonfarm Payrolls came in at just 57,000 jobs, against a consensus expectation of 110,000 and a prior reading of 172,000 that was itself revised down to 129,000. April and May combined revisions subtracted a further 74,000 jobs, meaning the labor market added 131,000 fewer jobs over two months than initially reported. The miss was decisive enough to shift the market’s entire Fed rate hike timeline. The probability of a July hike fell to approximately 15%. The September hike probability (which had been running near 72% just days earlier) was repriced sharply lower. Markets are now debating between zero and one hike for all of 2026 (a dramatic reversal from the two-hike scenario priced as recently as mid-June). The Dollar sold off sharply on Thursday following the NFP release, compounding a move that had already begun when the Japanese Yen surged more than 100 pips against the Dollar in minutes (widely attributed to Bank of Japan or Ministry of Finance intervention, as USD/JPY had been hovering near multi-decade highs above 161). EUR/USD recovered to around 1.1440 to 1.1450. GBP/USD gained over 1% to close near 1.3350. Gold snapped its four-week losing streak, rising more than 2% on Thursday alone and closing near 4,175. The S&P 500 recovered strongly, gaining 1.76% to close at 7,483. Bitcoin recovered from its 21-month low of 57,800 to close near 62,500. At the ECB Forum in Sintra, Fed Chair Warsh delivered a moderately hawkish message (scoring 5.6 out of 10 on the FXStreet Speechtracker). He reiterated that inflation remains too high, acknowledged risks have eased slightly with lower oil prices, and refused all forward guidance. On the war front, Ayatollah Ali Khamenei’s funeral processions run through July 9 (no formal US-Iran peace talks will take place before that date). Qatar’s Foreign Ministry confirmed that Doha talks produced positive progress, with Trump saying Iran accepted nearly everything required on nuclear issues. The Strait of Hormuz traffic continues to recover but remains far below the pre-war level of 160 vessels per day. The FOMC Minutes on Wednesday July 8 are the most important scheduled event of the week. The July 14 CPI is already casting its shadow over all of this week’s trading.
Currencies
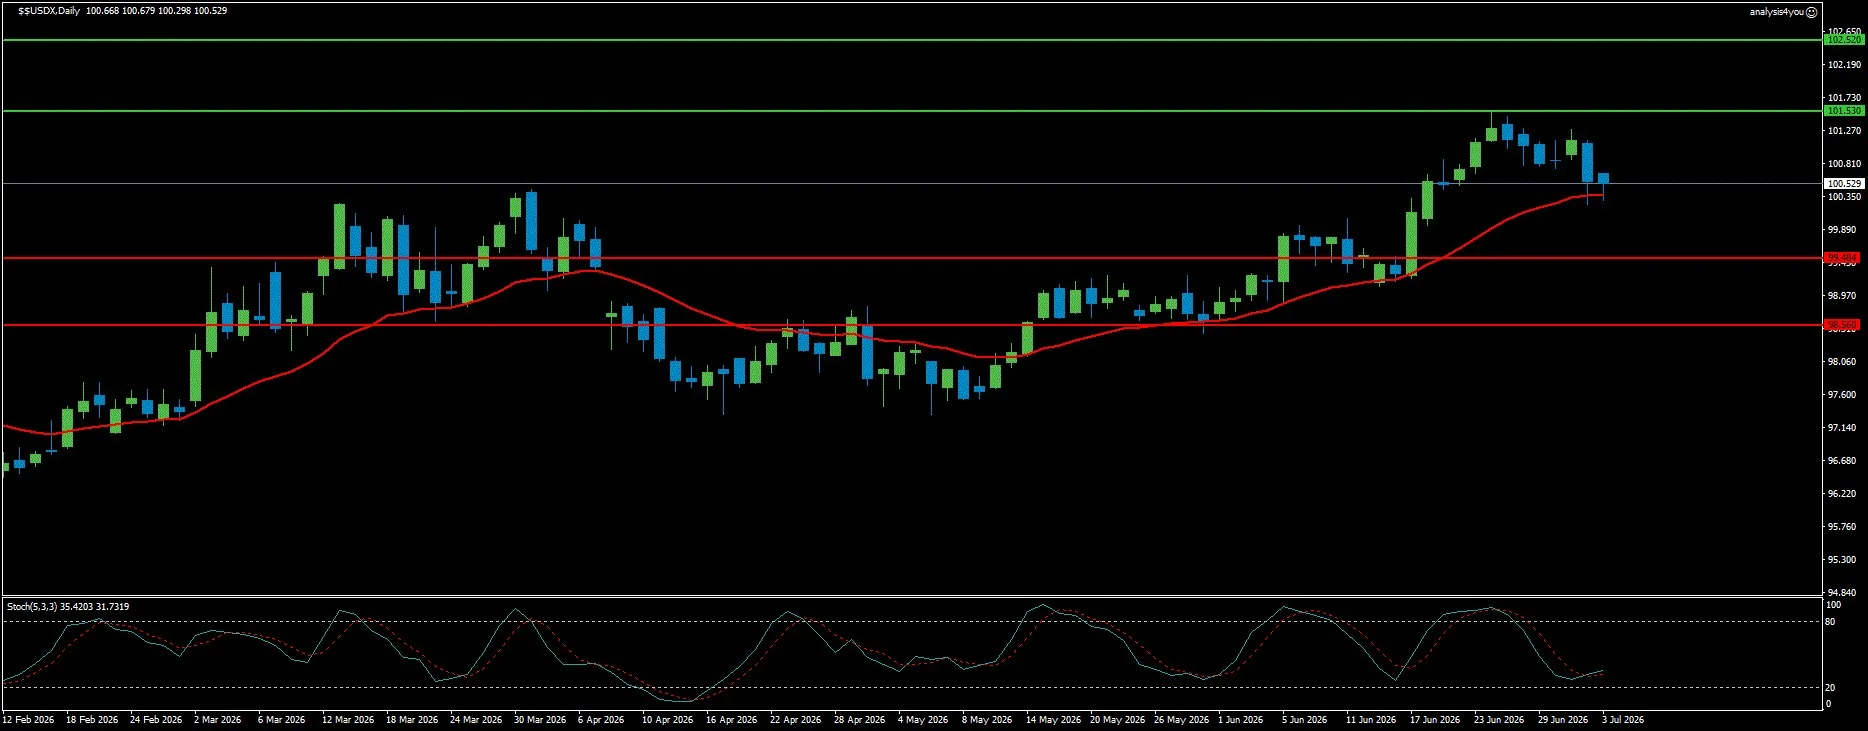
USD Index: NFP-Driven Reversal in Progress, FOMC Minutes Wednesday Are the Decider (100.53)
Current Trend: Neutral to Bearish
Resistance: 101.53 | 102.52
Support: 99.48 | 98.56
The Dollar Index reversed its two-week rally sharply following the June NFP miss, closing the week at 100.53 after having peaked near 101.50 midweek. The broader context is important: the Warsaw hawkish repricing drove the Dollar to 13-month highs, but the 57,000 NFP print erased a significant portion of that move in a single session. CFTC speculative positioning had risen to 13,200 net long contracts (the most bullish in over a year), but the conviction behind those longs was based entirely on the rate-hike narrative. With September hike expectations now sharply reduced, some of that positioning will need to be unwound. The NFP miss was compounded by the sharp USD/JPY move attributed to Japanese intervention, which amplified the Dollar’s downside across all pairs. Technically, the DXY is above all three moving averages, with the MA still trending upward. The current bar is at the middle Bollinger Band and bearish (consistent with a pullback within a broader uptrend rather than a full trend reversal). Stochastic is in an uptrend and overbought. RSI is bearish. For Week 18, the Dollar’s direction will be determined first by the ISM Services PMI on Monday and then decisively by the FOMC Minutes Wednesday. A minutes document showing strong internal consensus toward hiking would restore some of the Dollar’s lost ground. A document showing significant internal division would confirm the dovish repricing that followed NFP. The July 14 CPI is the next major scheduled catalyst, meaning this week may be one of consolidation rather than directional commitment. Resistance at 101.53 / 102.52. Support at 99.48 / 98.56.
EUR/USD: Two Consecutive Weeks of Gains, Bearish Trend Not Yet Broken
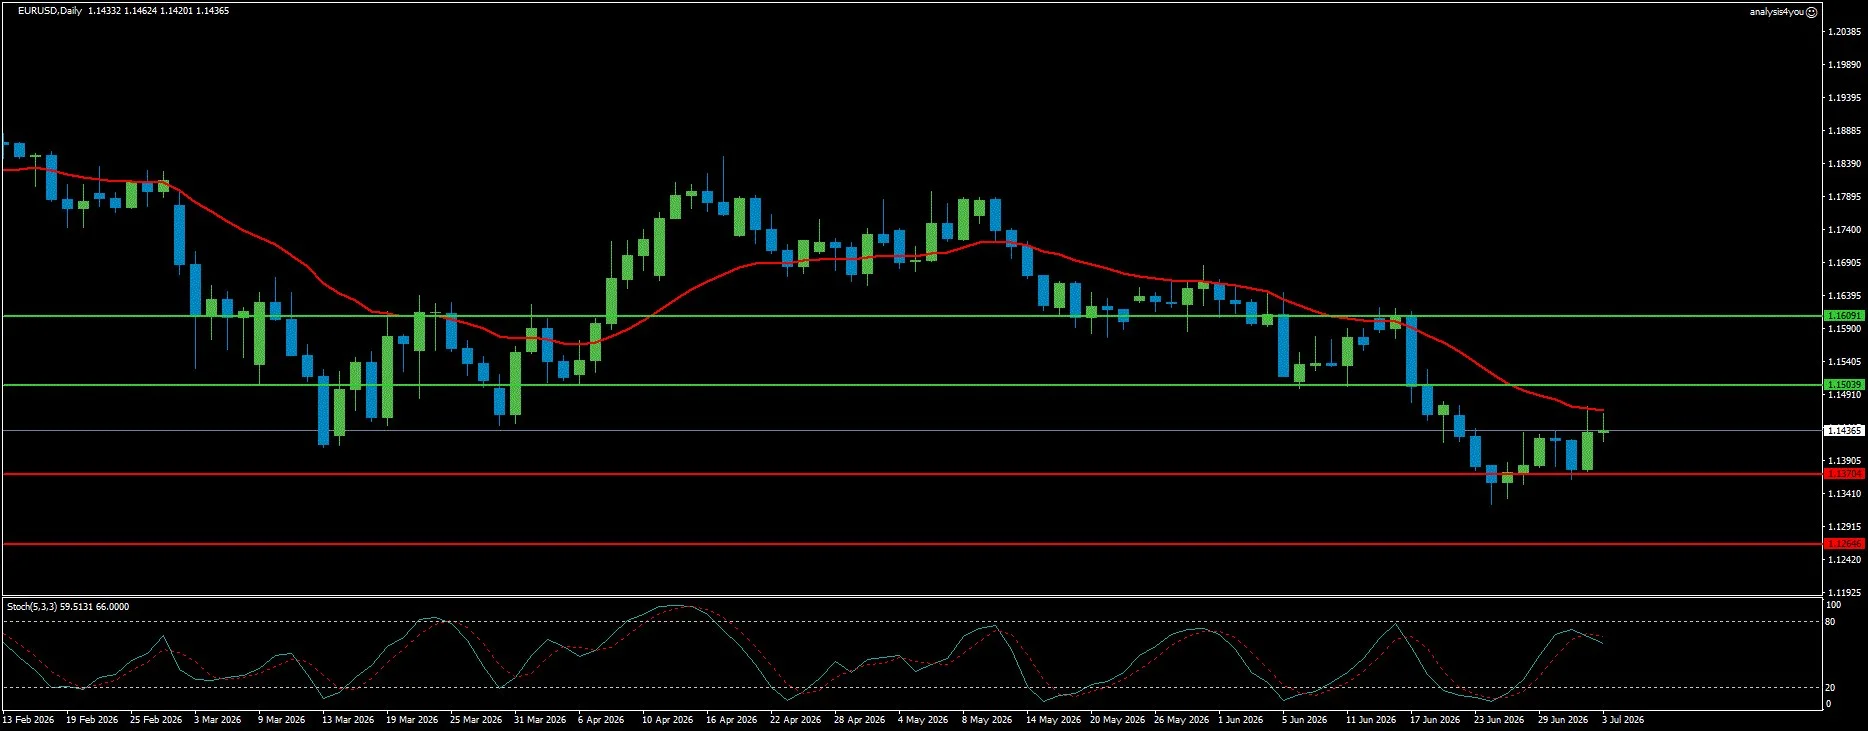
(1.1437)
Current Trend: Cautiously Bullish
Resistance: 1.1504 | 1.1609
Support: 1.1370 | 1.1265
EUR/USD has posted two consecutive weeks of gains from the June 25 low of 1.1324, recovering to close near 1.1437. The NFP miss was the primary driver of the recovery (softer US rate expectations weaken the Dollar and mechanically support the Euro). The Eurozone side also improved: Eurozone preliminary June HICP came in at 2.8% YoY (below the previous 3.2% and below market expectations). German CPI softened to 2.3%. These readings reduced ECB tightening pressure, with markets now expecting the ECB to hold rates rather than hike further. Critically, the reduction in ECB hike odds has been more than offset by the reduction in Fed hike odds, leaving the rate differential moving in the Euro’s favor for the first time since the conflict began. EUR/USD remains below all three moving averages. The current bar is at the middle Bollinger Band and bullish (the pair is recovering into the moving average cluster rather than breaking through it). Stochastic is in a downtrend despite being in overbought territory (a bearish signal overlaid on a tactical bounce). RSI is bullish but from a low base. The 1.1504 resistance is the first critical test (this is where the 20-day MA sits and where prior recovery attempts have stalled). A sustained close above 1.1504 would be the first technical sign that the downtrend is losing momentum. The FOMC Minutes on Wednesday are the key event: if they reveal a committee on the cusp of hiking, the Dollar will recover and EUR/USD will retreat toward 1.1370 support. If minutes show internal division, EUR/USD could push through 1.1504 toward 1.1609. Resistance at 1.1504 / 1.1609. Support at 1.1370 / 1.1265.
GBP/USD: Strongest Recovery of Major Currencies, MA20 Reclaimed, Burnham Fiscal Risk (1.3350)
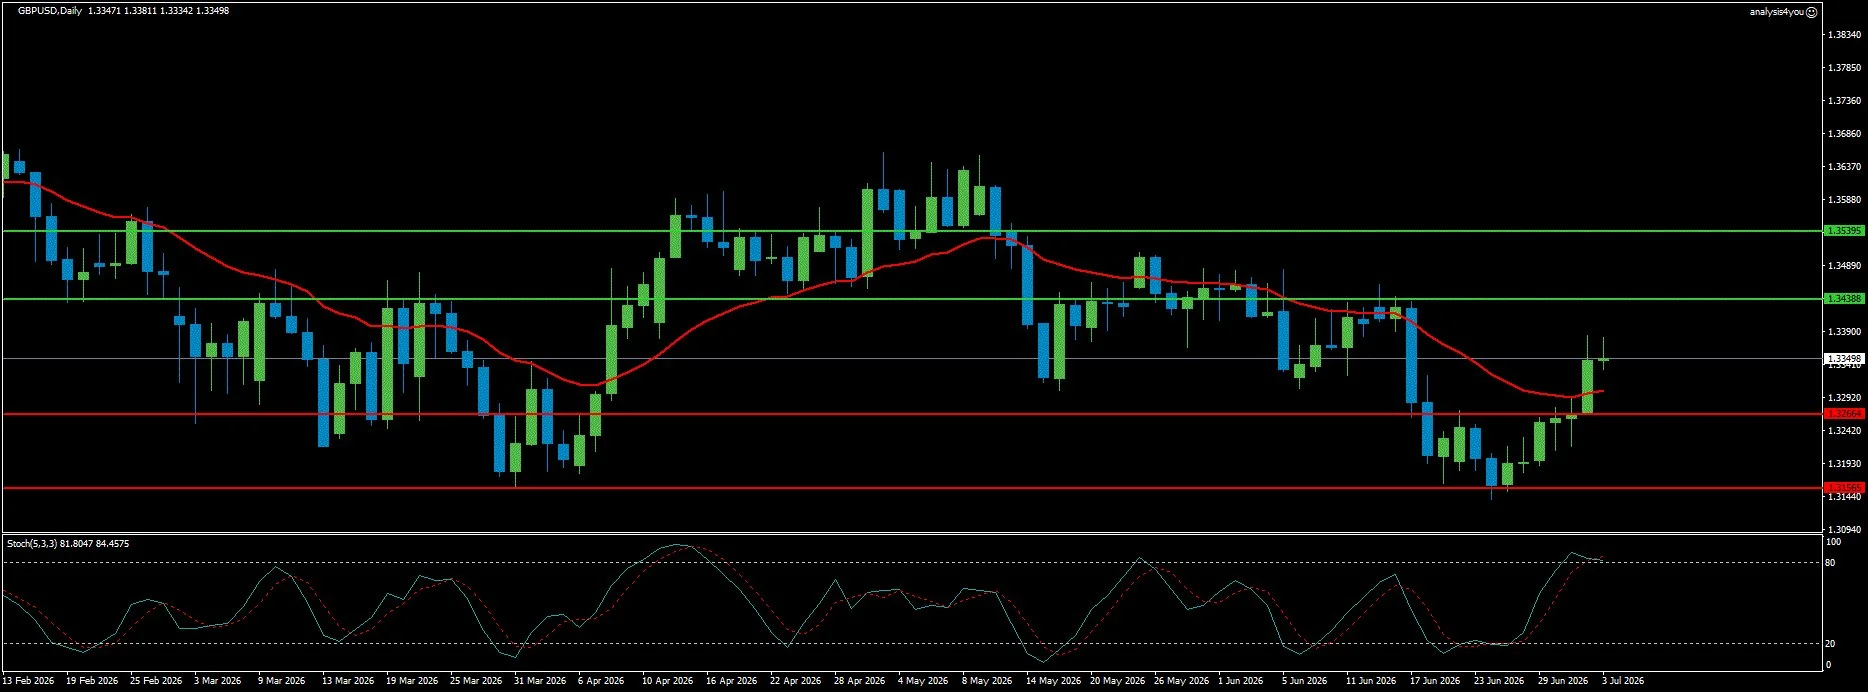
Current Trend: Cautiously Bullish
Resistance: 1.3439 | 1.3540
Support: 1.3266 | 1.3156
Sterling posted the strongest recovery of all major currencies in Week 17, gaining over 1% to close near 1.3350. GBP/USD has reclaimed its MA20 for the first time since the mid-June sell-off (a meaningful technical development that separates it from EUR/USD, which remains below all its moving averages). Two factors drove the outperformance. First, the NFP miss reduced Fed hike expectations more aggressively than BoE hike expectations (money markets still price a 70% probability of a BoE rate hike by year-end, compared to only 46% for the Fed). This rate differential shift is supportive of Sterling. Second, incoming Prime Minister Andy Burnham reaffirmed his commitment to the current fiscal rules, reducing the immediate fear premium that had weighed on the Pound. However, the recovery remains fragile. The UK Services PMI deteriorated further in June (falling from 49.3 to 48.8, with new orders declining for a fourth consecutive month). The BoE faces the same stagflationary dilemma as every major central bank: inflation expectations at their highest since 2009, a weakening services sector, and a new government whose full fiscal agenda is not yet clear. BoE Governor Bailey speaks this week and his tone will be closely monitored. Technically, GBP/USD is above its MA20 but still below MA50 and MA200. The current bar is at the middle Bollinger Band and bullish. Stochastic is neutral despite being in overbought territory (a sign of momentum pause). RSI is bullish. The 1.3439 resistance is the immediate target. Resistance at 1.3439 / 1.3540. Support at 1.3266 / 1.3156.
Stocks
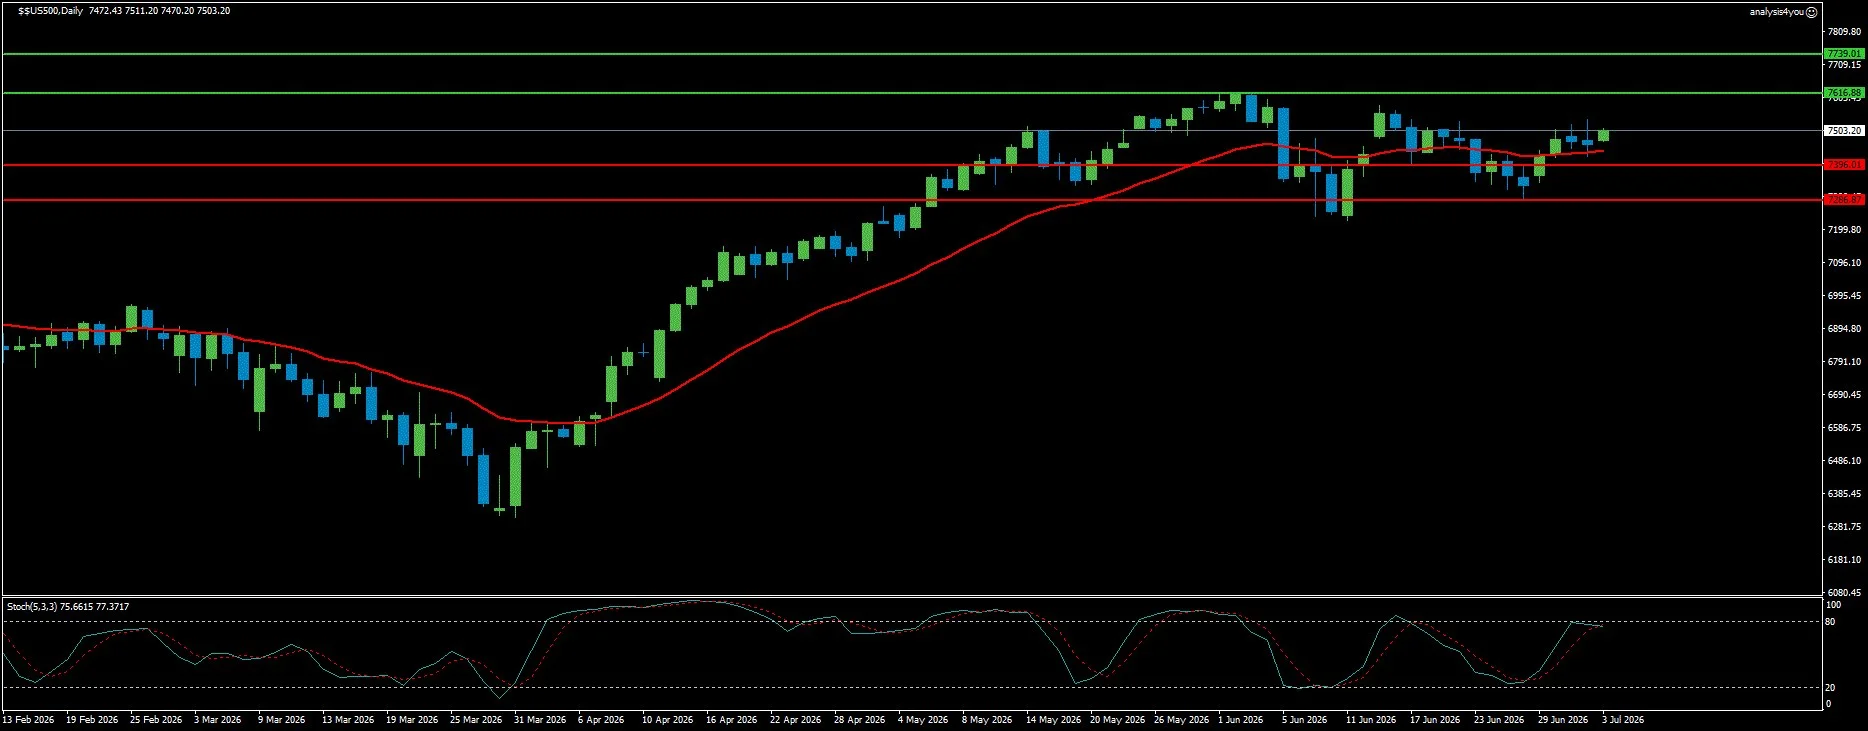
S&P 500: Back at Record Territory Proximity, FOMC Minutes and Early Earnings Define Week (7,503)
Current Trend: Bullish
Resistance: 7,617 | 7,739
Support: 7,396 | 7,287
The S&P 500 recovered strongly in Week 17, gaining 1.76% to close at 7,503 (putting it back within 1.5% of its June 2 record closing high). The recovery was driven by the NFP miss (paradoxically, weaker employment data is bullish for equities when the primary fear was over-tightening by the Fed). The reduced probability of a September hike immediately compressed the rate risk premium embedded in equity valuations, particularly for growth and tech stocks that had been hardest hit by the June sell-off. JPMorgan raised its 2026 S&P 500 target from 7,200 to 7,800 (implying approximately 4% further upside from current levels). Earnings season is just beginning (PepsiCo Thursday and Delta Air Lines Friday provide the first Q2 read). The chart shows the S&P 500 back above all three moving averages following the V-shaped recovery from the late-June lows. The current bar is at the upper Bollinger Band and is a bullish candle. Stochastic is neutral from overbought and RSI is bullish. The 7,617 resistance is the immediate target (just above the current price). A close above that level would confirm a fresh breakout toward the 7,739 all-time high zone. For Week 18, equities face a supportive macro backdrop but a critical test from FOMC Minutes and early earnings. If minutes confirm the hawkish dot plot was near-unanimous, equities would face renewed selling pressure as September hike bets return. If minutes show the committee was divided, the rally can extend toward 7,617 and beyond. Resistance at 7,617 / 7,739. Support at 7,396 / 7,287.
Commodities
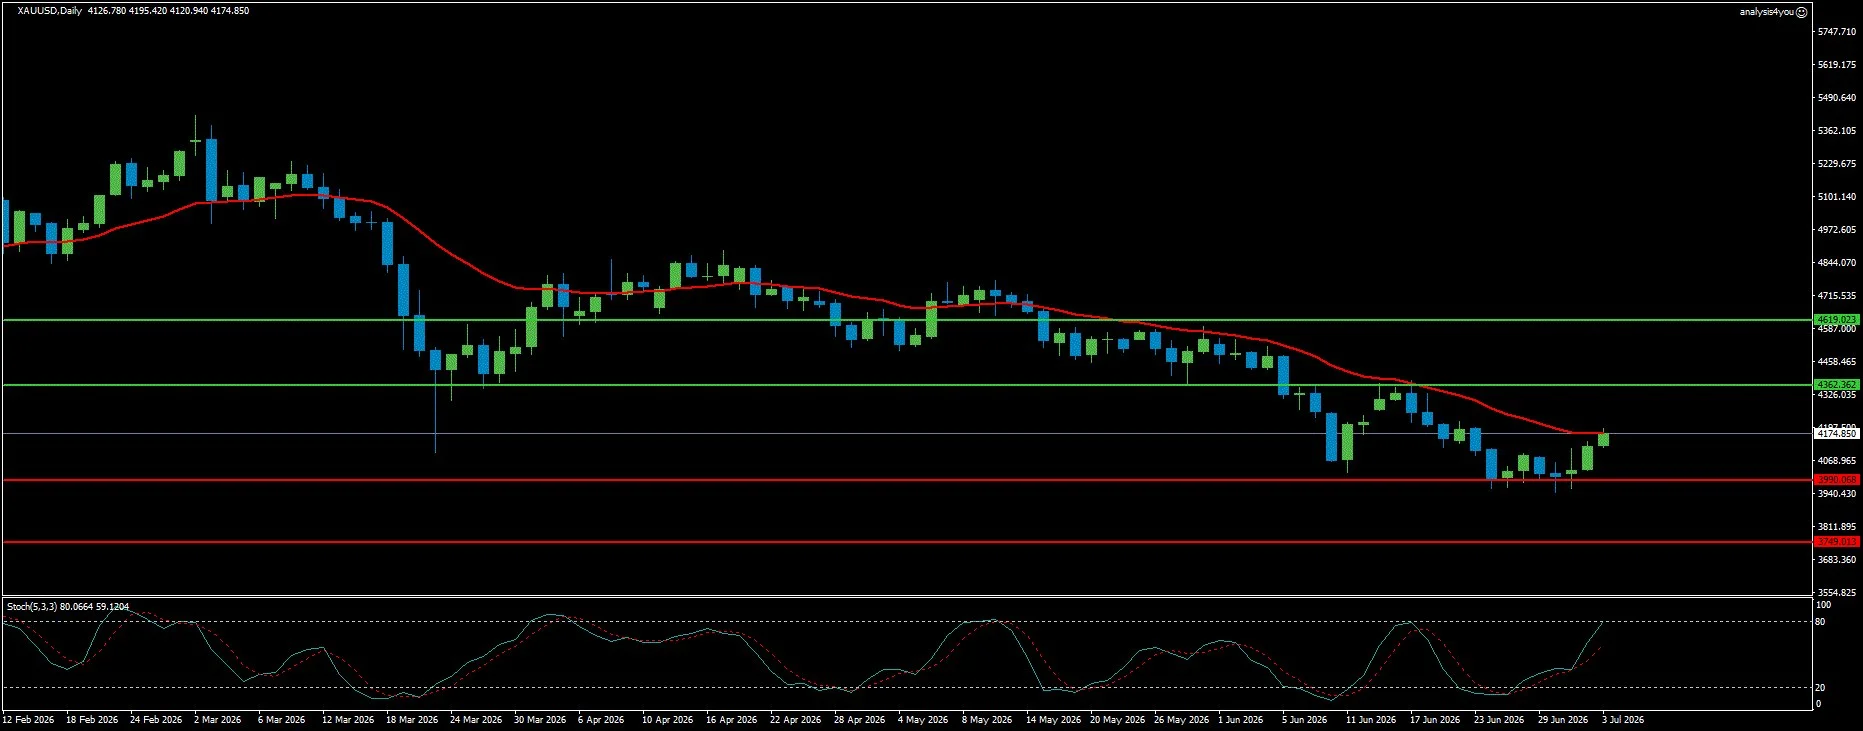
Gold: Four-Week Losing Streak Snapped, MA20 Reclaimed, FOMC Minutes Are Catalyst (4,175)
Current Trend: Bullish
Resistance: 4,362 | 4,619
Support: 3,990 | 3,749
Gold delivered the most significant technical development of the week: it snapped a four-week losing streak and crossed back above its 20-day moving average for the first time since the January highs. The closing price of 4,174.85 represents a recovery of over 2% from the prior week’s close, with the Thursday NFP session alone accounting for most of that move. The fundamental logic is straightforward (weaker US employment data reduces the probability of a near-term Fed hike, which reduces real yields and the opportunity cost of holding non-yielding Gold, and weakens the Dollar). TD Securities targets 4,280 in the near term, while the World Gold Council’s Mid-Year Outlook identifies central bank reserve diversification as the structural driver that sets a floor under prices. Gold is now above its MA20 for the first time in weeks, though still below the MA50 and MA200. The current bar is at the middle Bollinger Band and bullish. Stochastic is in an uptrend and overbought with a bullish signal (momentum is building). RSI is bullish. The critical inflection point is the descending trend line converging near 4,200. A daily close above 4,200 confirmed by RSI climbing above 50 would technically confirm a bullish reversal. For Week 18, a dovish FOMC Minutes document would be the most powerful catalyst for a sustained Gold rally through 4,200 toward 4,362. A hawkish minutes document that re-anchors September hike expectations would push Gold back toward 3,990. Any deterioration in the Strait situation generates a Gold bid regardless of the rate outlook. Resistance at 4,362 / 4,619. Support at 3,990 / 3,749.
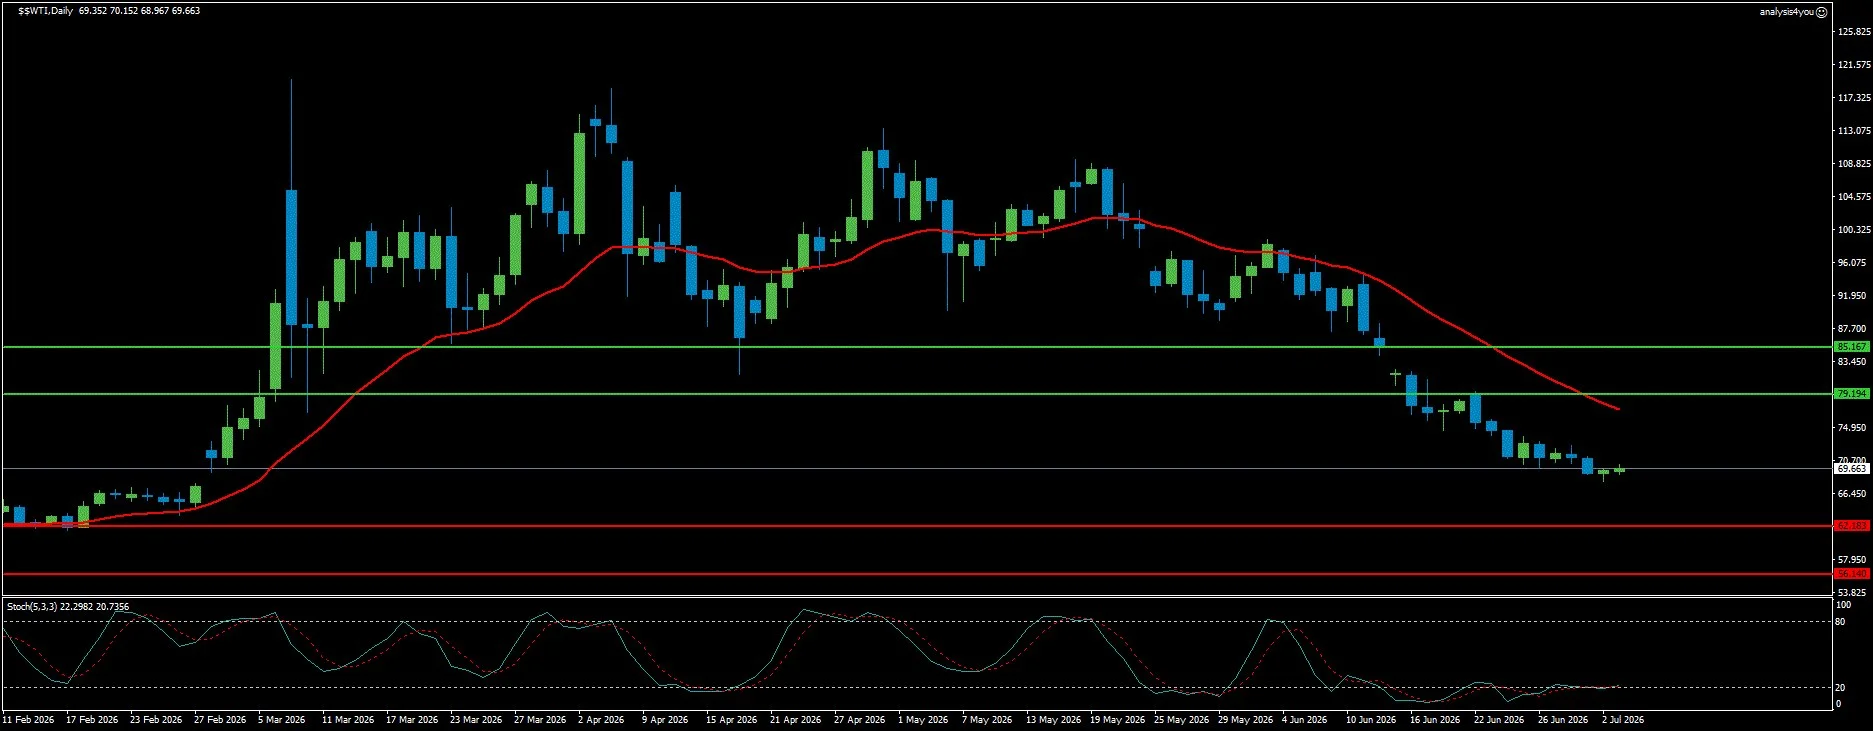
WTI Crude Oil: Pre-War Level Reclaimed, Hormuz Talks Resume, Technical Bounce Overdue (70.73)
Current Trend: Bearish/Volatile
Resistance: 79.19 | 85.17
Support: 62.18 | 56.14
WTI Crude Oil closed the week at 70.73, completing what is arguably the most dramatic round-trip in the history of this conflict: from pre-war levels near 65 to 70 in early February, spiking to above 115 at the war’s peak in March, and returning now to essentially pre-war territory after the MOU was signed and Hormuz flows resumed. The market is pricing near-full normalization of supply, but Commerzbank has clearly noted this reflects expectations of a future supply surplus rather than evidence of an actual oversupplied market. Tanker transit through the Strait remains well below the pre-war level of 160 vessels per day. The 60-day MOU window expires in mid-August, meaning the assumed supply normalization is conditional on a final deal being struck. The chart shows WTI below all three moving averages, at the lower Bollinger Band. Stochastic is in uptrend from deeply oversold territory and is bullish (a technical bounce is overdue). RSI is neutral. The 79.19 resistance is the first meaningful ceiling. Below current levels, 62.18 is the next key support. For Week 18, WTI is hostage to two narratives simultaneously. The technical oversold condition argues for a bounce toward 79.19 in the absence of negative headlines. Any reported breakdown in the Doha talks or IRGC activity in the Strait would spike prices sharply higher. A deal framework extending the MOU would be bearish, potentially opening the path toward 62.18. Resistance at 79.19 / 85.17. Support at 62.18 / 56.14.
Crypto
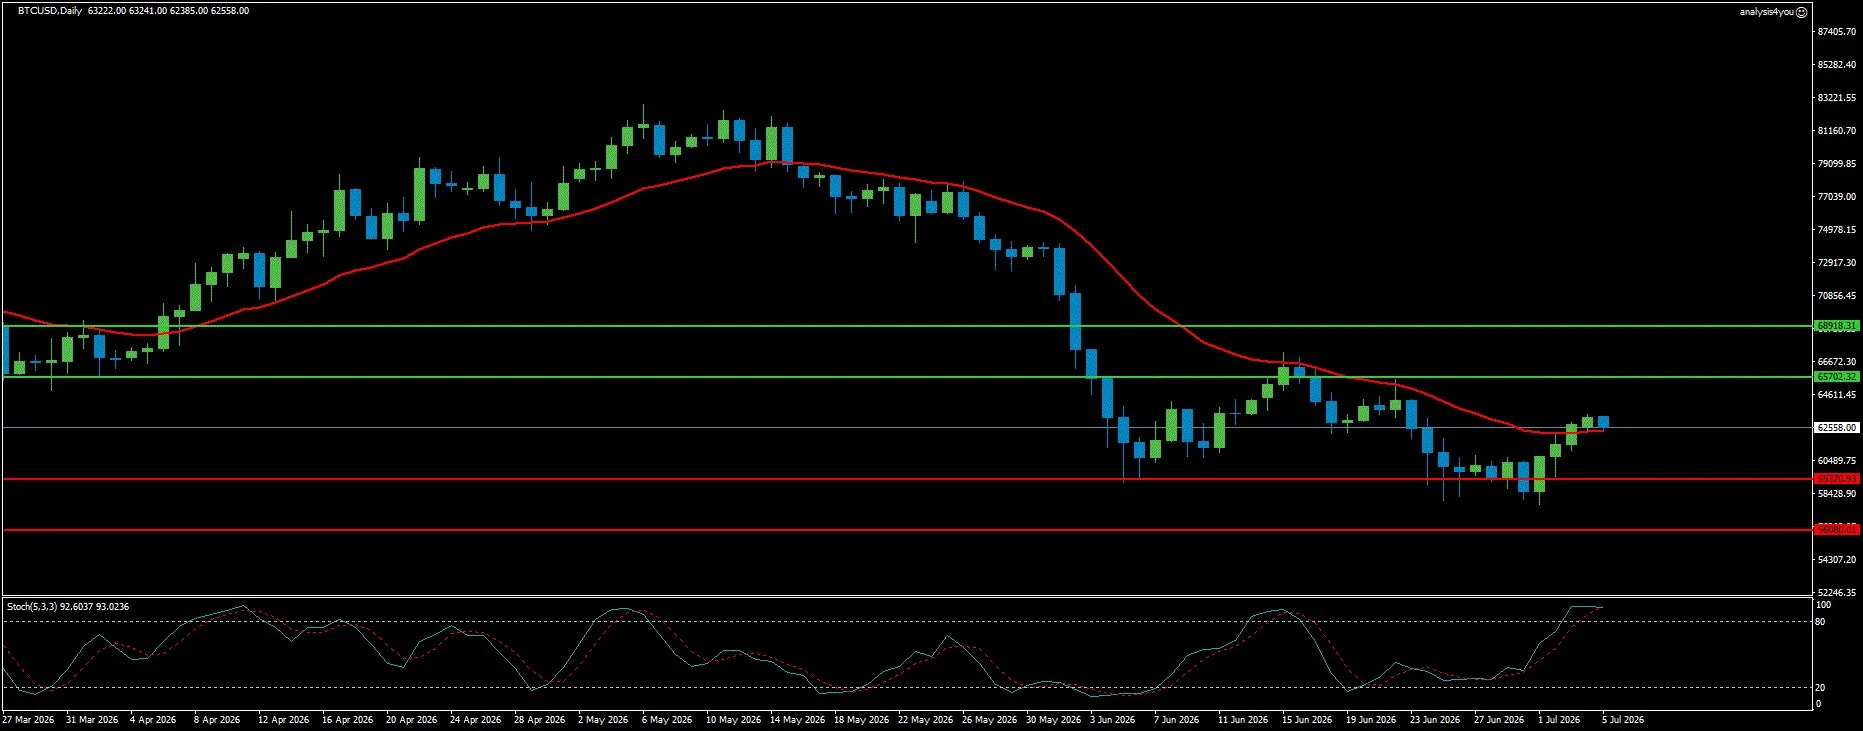
Bitcoin: Tentative Recovery, MA20 Reclaimed, Eight Consecutive Weeks of ETF Outflows (62,558)
Current Trend: Tentatively Bullish
Resistance: 65,702 | 68,918
Support: 59,320 | 56,080
Bitcoin recovered from its 21-month low of 57,800 to close near 62,558, reclaiming the 20-day moving average for the first time since mid-May. The recovery was driven by the same macro catalyst as all risk assets: the NFP miss reduced Fed hike expectations, weakened the Dollar, and improved the appeal of non-Dollar assets including crypto. Quarter-end rebalancing provided an additional mechanical tailwind. The eighth consecutive week of spot ETF outflows ($526 million through Thursday) confirms that institutional demand has not yet turned, but the pace of outflows appears to be moderating. The chart shows Bitcoin above its MA20 but still below the MA50 and MA200 (which are declining steeply and represent significant overhead supply). The current bar is at the middle Bollinger Band and bearish (the recovery bounce is losing momentum at first resistance). Stochastic is in a downtrend despite being in overbought territory (a bearish signal suggesting the recovery may be short-lived). RSI is neutral. The key technical reference is the ascending trendline from January 2023 lows, which provided support near 58,000 last week. A sustained close above 65,702 would be the first signal that the MA50 resistance is being challenged. Below, 59,320 is the critical support (a break there would reopen the path toward the 57,800 recent low). For Week 18, Bitcoin’s trajectory mirrors equities: dovish FOMC Minutes and continued de-escalation in the Strait are the two most supportive catalysts available. K33 Research’s analysis of quarter-end rebalancing patterns suggests the tailwind from this effect typically extends three trading days into the new month. The test of whether this is a genuine reversal or another bear market bounce will be the ability to hold above 62,000 for a full week. Resistance at 65,702 / 68,918. Support at 59,320 / 56,080.
Key Events (July 6-10, 2026)
Monday, July 6: ISM Services PMI for June (the first major data point of the week). The Employment subindex will be scrutinized carefully given the weak NFP print (a reading below 45 would signal accelerating contraction in service sector payrolls).
Wednesday, July 8: FOMC Minutes from the June meeting (THE MOST IMPORTANT SCHEDULED EVENT OF THE WEEK). Markets will parse every line for indications of how close officials were to unanimous support for a hike, whether any members flagged downside labor market risks, and how the committee views the inflation trajectory if energy prices continue falling.
Thursday, July 9: Khamenei’s funeral concludes (earliest possible date for US-Iran talks to formally resume). Initial Jobless Claims for the week ending July 4 (expected to rise modestly from 215,000 to around 219,000).
Friday, July 10: Federal Reserve Monetary Policy Report. Early Q2 earnings including Delta Air Lines. The following week’s US CPI on July 14 is already casting its shadow over all of this week’s trading.
Week Ahead Outlook
The base case for Week 18 is cautious risk-on consolidation as markets digest the NFP shock and await the FOMC Minutes.
Base Case (approximately 45%): The Dollar stabilizes near 100.50. EUR/USD and GBP/USD hold their recovery gains but struggle to break through key resistance levels ahead of Wednesday. Gold trades in the 4,100 to 4,280 range, supported by softer rate expectations but capped by the technical resistance at 4,200. The S&P 500 consolidates near 7,500, within reach of the record highs. WTI stabilizes near 70 as the technical oversold condition prevents further immediate downside. Bitcoin holds the 62,000 level as the quarter-end rebalancing tailwind extends into early July.
Bull Case for Risk Assets (approximately 30%): If the FOMC Minutes reveal a committee that was significantly divided on the pace of tightening, the dovish repricing initiated by NFP would be confirmed and extended. The Dollar falls toward 99.48. EUR/USD pushes through 1.1504 toward 1.1609. GBP/USD tests 1.3540. Gold rallies through 4,200 toward the TD Securities target of 4,280 and then 4,362. The S&P 500 breaks to a new record above 7,617. Bitcoin tests 65,702. This scenario is further supported if the ISM Services Employment Index on Monday confirms the labor market deterioration implied by Friday’s NFP.
Bear Case: Hawkish Minutes Restore Hike Expectations (approximately 25%): If the FOMC Minutes from June show a committee that was near-unanimous in its readiness to hike, September hike odds recover toward 60 to 70%. The Dollar rallies back toward 101.53. EUR/USD retreats to 1.1370. GBP/USD falls toward 1.3266. Gold is pressed back toward 3,990. Equities sell off from near-record levels as the rate premium returns.
Bottom line: Eighteen weeks into the Iran war, the market has received its first genuine labor market warning signal. The 57,000 NFP print represents the kind of data that can fundamentally shift the Fed’s calculus, but the June meeting’s dot plot (showing nine officials projecting at least one hike) was compiled before this data landed. The FOMC Minutes on Wednesday will reveal whether that dot plot represented genuine conviction or pre-emptive hawkishness that the data has now undermined. The resumption of US-Iran talks following the Khamenei funeral creates a binary catalyst for oil and risk assets simultaneously. The July 14 CPI shadow hangs over every position taken this week.


