Iran MOU Confirmed But Unratified, PCE at 3.8%, May CPI and NFP Define June
Market Sentiment Overview
The week of June 1 to 6 opens at what may be the most consequential juncture of the entire three-month Iran war for financial markets. A tentative Memorandum of Understanding between the US and Iran (extending the ceasefire for 60 days, opening the Strait of Hormuz, and committing to the start of nuclear talks) has been confirmed by multiple news outlets and the White House itself. But critically, President Trump has yet to give his final approval, and Iran’s top negotiator Qalibaf delivered the week’s most important diplomatic statement on Friday: only actions are the measures, no action will be taken before the other side acts. Trump stated Friday that the naval blockade will be lifted and ships caught in the Strait may start the process of heading home (the closest thing to an operational ceasefire extension short of a formal signature). The market’s response to the MOU news was dramatic and immediate. WTI crude oil fell approximately 12% for the week (its sharpest weekly decline since the Hormuz reopening announcement weeks earlier), closing near $87 to $90. The S&P 500 posted its ninth consecutive weekly advance, closing at a fresh all-time high of 7,580.06 (up 5% for May and the best May performance in years). The Nasdaq gained 8% for May (its best monthly performance since late 2024). Dell Technologies surged 32.8% after reporting AI server revenue of $16.1 billion, up 757% year over year. The inflation picture simultaneously intensified. April PCE accelerated to 3.8% YoY (the highest level in roughly two years) while core PCE came in at 3.3%. Q1 GDP was revised down to 1.6% from the initial 2.0% estimate. The stagflation ghost now hovers explicitly over the policy discussion. The FOMC meets June 16 to 17 in Warsh’s first meeting as Chair, with the market pricing 90% probability of rates remaining unchanged but intense focus on whether the Committee drops its easing bias.
Currencies
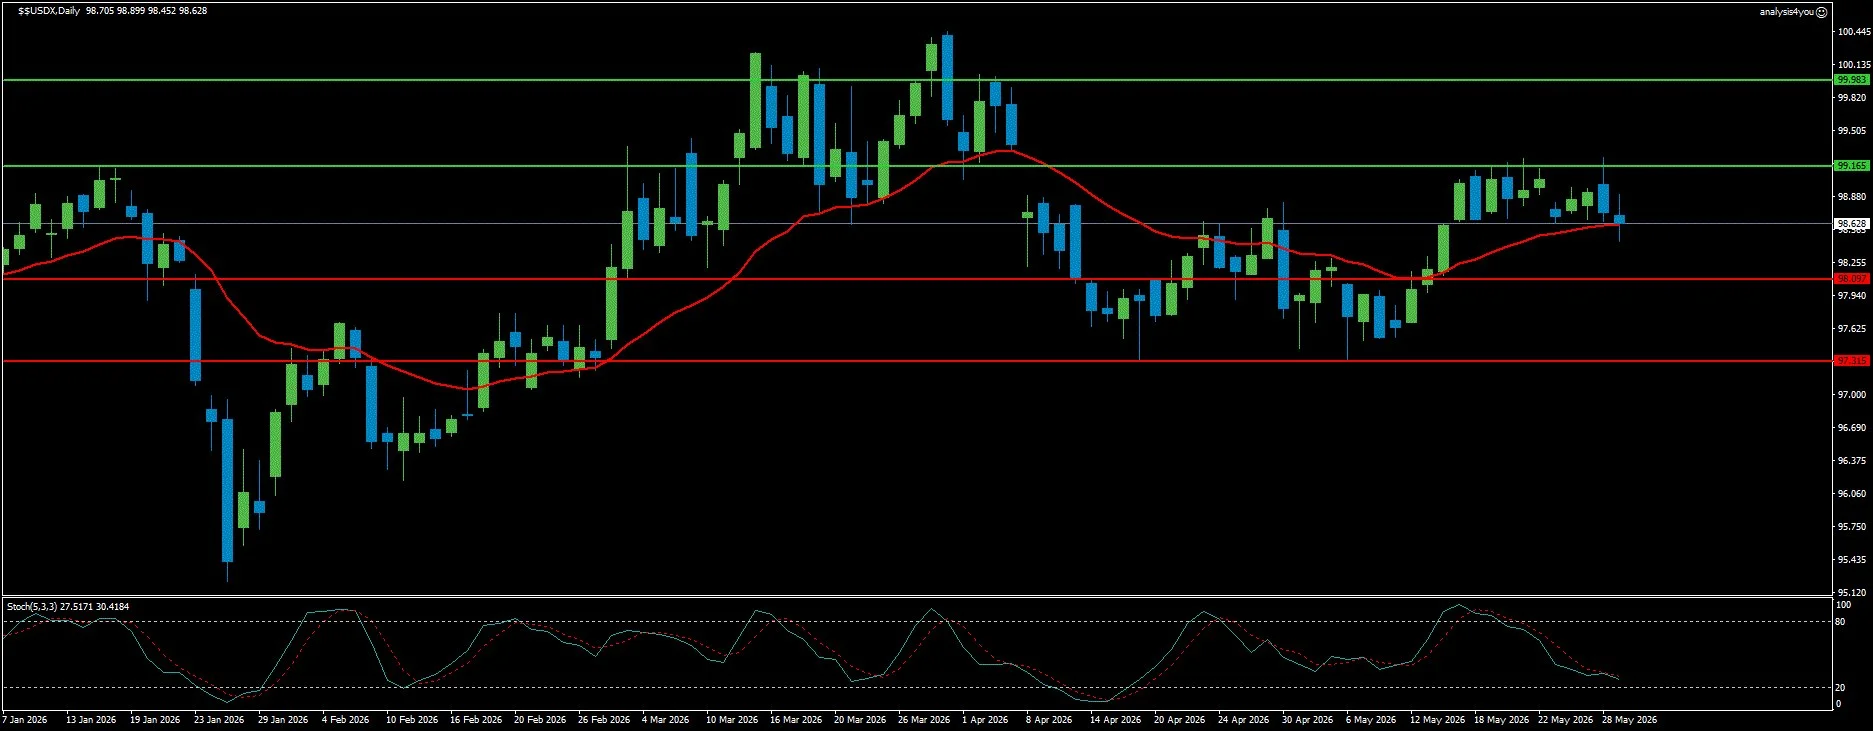
USD Index: Lost 200-Day MA, Iran Deal Erodes War Premium (98.63)
Current Trend: Bearish
Resistance: 99.17 | 99.98
Support: 98.10 | 97.32
The US Dollar has given back the 200-day MA that it briefly reclaimed two weeks ago. At 98.63, DXY is now above MA 20 and MA 50 but below MA 200 (the same configuration that defined the Dollar’s structural weakness during the war’s prior de-escalation phases). The Iran MOU news is systematically dismantling the war premium that had driven the Dollar higher through the combined CPI/PPI inflation shock of three weeks ago.
The fundamental picture is genuinely complex. The inflation data (PCE at 3.8%, core PCE at 3.3%) should be Dollar-supportive by reinforcing rate hike expectations. But the Iran MOU is simultaneously reducing the oil-driven inflation argument that underpins those rate hike expectations. The oil price decline is helping to ease some of those worries, while cautioning that inflation moving further from the Fed’s 2% target could push policymakers to shift away from their easing bias at the June meeting.
Warsh’s reform agenda (winding down forward guidance, shrinking the balance sheet) introduces Dollar uncertainty that markets have not yet fully priced. The Stochastic at 27.52/30.42 is approaching oversold territory in a downtrend with a bearish signal (the most bearish DXY Stochastic configuration since the Dollar was at its war-period lows).
The week’s primary USD catalysts are Thursday’s May CPI and Friday’s NFP. A hot May CPI above 3.8% would revive rate hike expectations and support the Dollar toward 99.17. A softer CPI with slowing energy component could send DXY through 98.10 toward 97.32.
Technically, DXY is at 98.63, below the 200-day MA but above MA 20 and MA 50. The Stochastic at 27.52/30.42 is approaching oversold in a downtrend with a bearish signal. Resistance at 99.17 is the key ceiling. Support at 98.10 / 97.32.
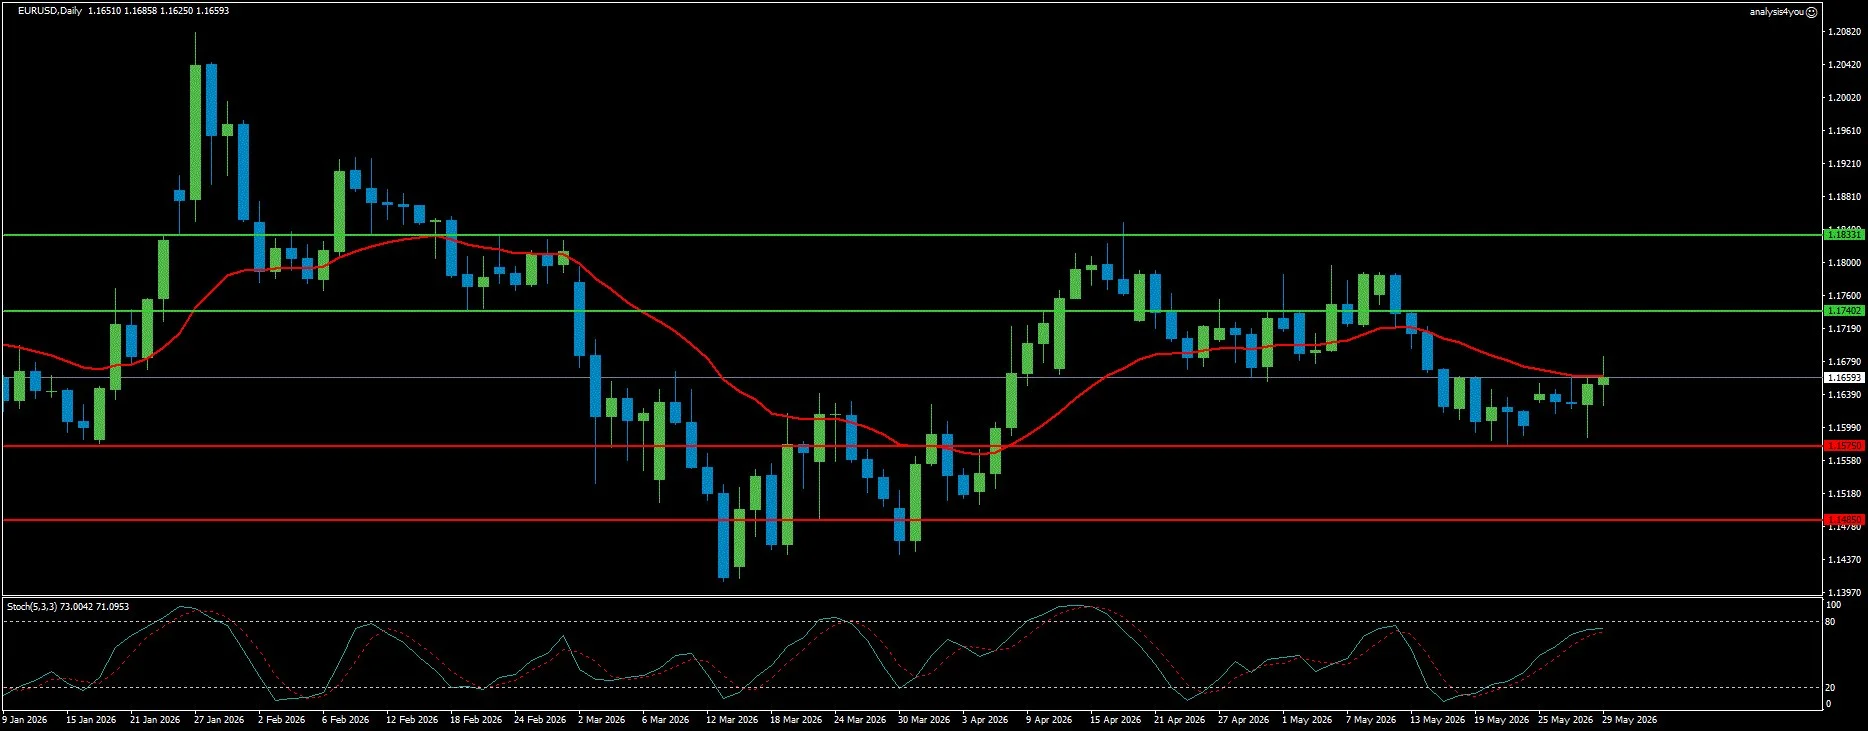
EUR/USD: Dramatic Stochastic Reversal, Divergence Bounce Confirmed (1.1636)
Current Trend: Cautiously Bullish
Resistance: 1.1740 | 1.1833
Support: 1.1575 | 1.1485
EUR/USD has confirmed the bullish Stochastic divergence that three consecutive weeks of analysis identified as the bounce setup. The Stochastic has reversed from 7.74 (the most deeply oversold reading of the entire war series) to 73.00 this week (the most dramatic single-indicator reversal of any instrument across the entire week series).
The pair recovered from the 1.1576 multi-week low to 1.1636, a 60-pip gain that brought price back above the 200-day SMA. The fundamental picture is captured precisely: the USD shed some ground on the back of Iran deal hopes, but losses were limited by persistent speculation that the Fed will have no choice but to hike interest rates before year’s end.
The critical balance for EUR/USD is between the ECB June 11 rate hike (supportive, the first ECB hike in years) and the Fed’s rate hike probability (Euro-negative through the Dollar channel). Eurozone May HICP is expected at 3.3% YoY (after 3.0% in April), providing the ECB with its June hike justification.
If the Iran deal removes the energy shock, the ECB’s June hike rationale paradoxically weakens (which could be EUR-negative by removing a key support narrative). The overbought Stochastic warns that the bounce may face selling pressure at the SMA resistance cluster.
Technically, EUR/USD is at 1.1636. The Stochastic at 73.00/7.10 is in the overbought zone with an uptrend and bullish signal. Back above the 200-day SMA, the SMA resistance cluster at 1.1675 to 1.1699 is the primary ceiling. Resistance at 1.1740. Support at 1.1575 / 1.1485.
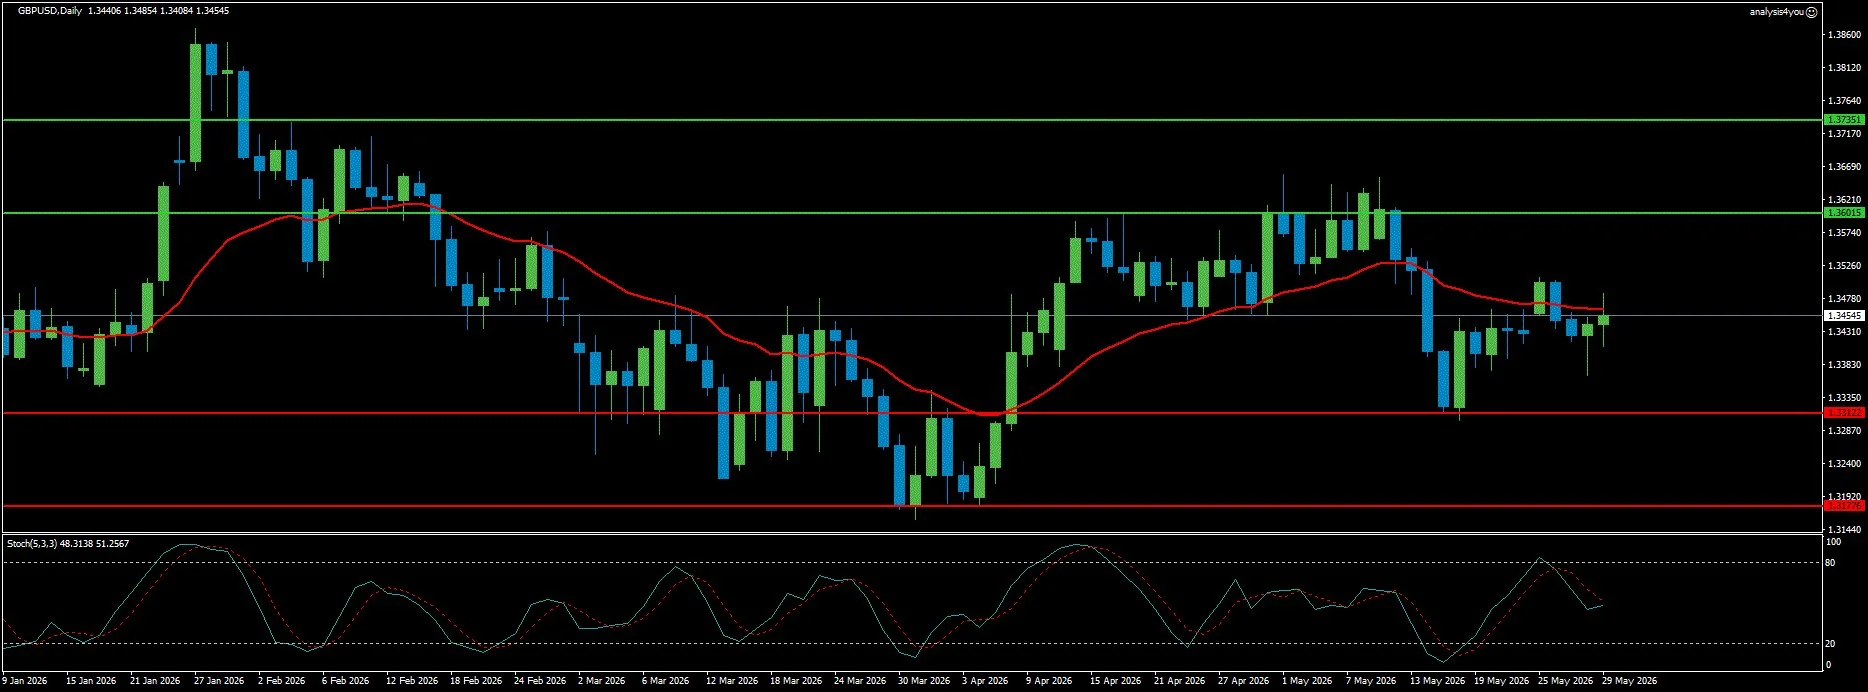
GBP/USD: Consolidating Above 200-Day MA, Bailey and NFP Are Binary Catalysts (1.3455)
Current Trend: Neutral
Resistance: 1.3601 | 1.3735
Support: 1.3312 | 1.3178
GBP/USD is in constructive consolidation above the 200-day SMA at approximately 1.3422, recovering gradually from the devastating 2% weekly loss three weeks ago. At 1.3455, the pair is building a base (but 1.3500 remains a tough nut to crack for buyers). The pair yo-yoed within a 150-pip range during the prior week (from 1.3367 on Iran re-escalation strikes to 1.3510 on MOU news) before settling near the 200-day MA.
This volatile intraday price action perfectly illustrates GBP’s high-beta sensitivity to the Iran geopolitical narrative. The BoE hawkish backdrop (8-1 hold with Pill dissenting for a hike, Bailey warning against waiting for second-round effects, BoE projecting UK inflation to breach 5%) provides structural GBP support from the rate divergence angle.
But UK political instability (70+ Labour MPs urging Starmer to resign, UK by-election on June 18) is a persistent discount applied to Sterling. BoE Governor Bailey’s testimony and the US May NFP on Friday will shape the week’s direction.
A hawkish Bailey testimony combined with a weak NFP would be the most bullish scenario for GBP/USD (potentially breaking 1.3500 decisively and targeting 1.3601). Technically, GBP/USD is at 1.3455, above the 200-day SMA at 1.3422 but capped by a tight band of overhead resistance (50-day, 100-day, and 20-day SMAs between roughly 1.3447 and 1.3482).
The Stochastic at 48.31/51.26 is in mid-range with an uptrend and neutral signal. Resistance at 1.3601. Support at 1.3312 / 1.3178.
Stocks
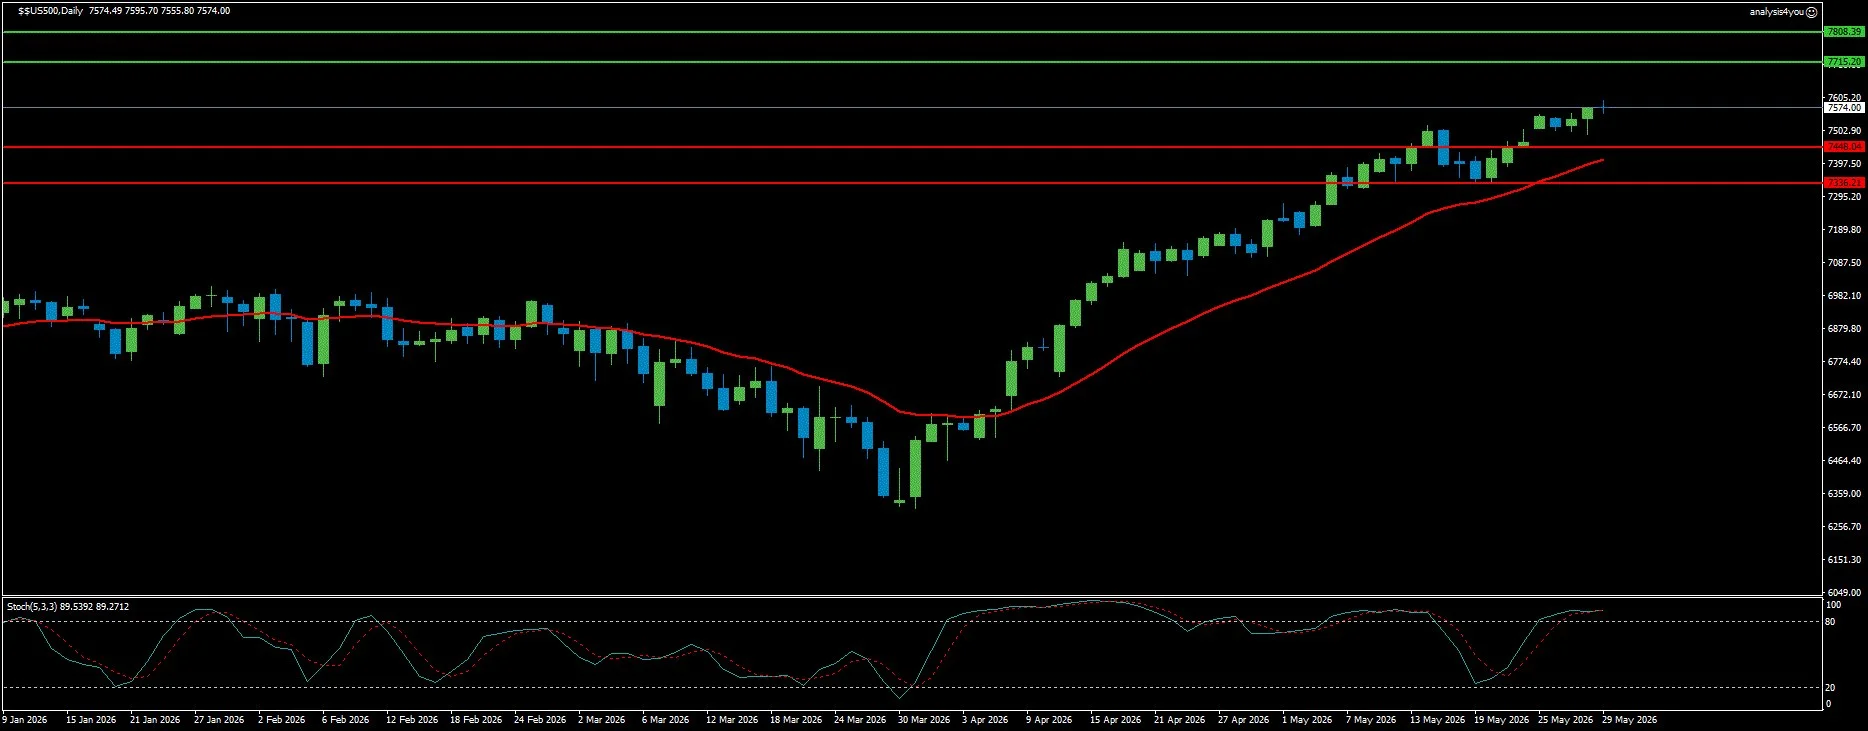
S&P 500: Ninth Consecutive Weekly Gain, ATH at 7,580, AI Earnings Revolution (7,574)
Current Trend: Bullish
Resistance: 7,715 | 7,808
Support: 7,448 | 7,336
The S&P 500 closed May at a fresh all-time high of 7,580.06 (up 5% for the month), posting its ninth consecutive weekly advance, the longest winning streak since 2023. The Nasdaq gained 8% for May (its best monthly performance since late 2024).
Three distinct forces drove the historic May performance: Iran peace progress, Dell’s once-in-a-generation earnings report (Q1 revenue up 88% to $43.8 billion, AI server revenue up 757% to $16.1 billion, record AI order backlog of $51.3 billion), and broader tech strength (Micron crossing $1 trillion, AMD up approximately 90% over the past month).
Bank of America warned investors to brace for a potential summer correction (pointing to weakening market breadth and diverging momentum signals). However, both Bank of America and Goldman Sachs still forecast the S&P 500 reaching 8,000 by year-end 2026.
The week’s primary S&P 500 catalysts are the Iran MOU’s fate and Thursday’s May CPI. If May CPI shows significant disinflation (reflecting the oil price crash), rate hike expectations could be rapidly repriced lower (a powerful bullish equity catalyst). The market’s patience may be tested if a deal is not agreed by early June.
The 90% probability of a Fed hold at the June 16–17 FOMC is stable, but whether the easing bias is dropped is the critical policy signalling event.
Technically, the S&P 500 is at 7,574, essentially at the all-time high. The Stochastic at 89.54/89.27 is deeply overbought in an uptrend with a neutral signal. Resistance at 7,715 / 7,808. Support at 7,448 / 7,336.
Commodities
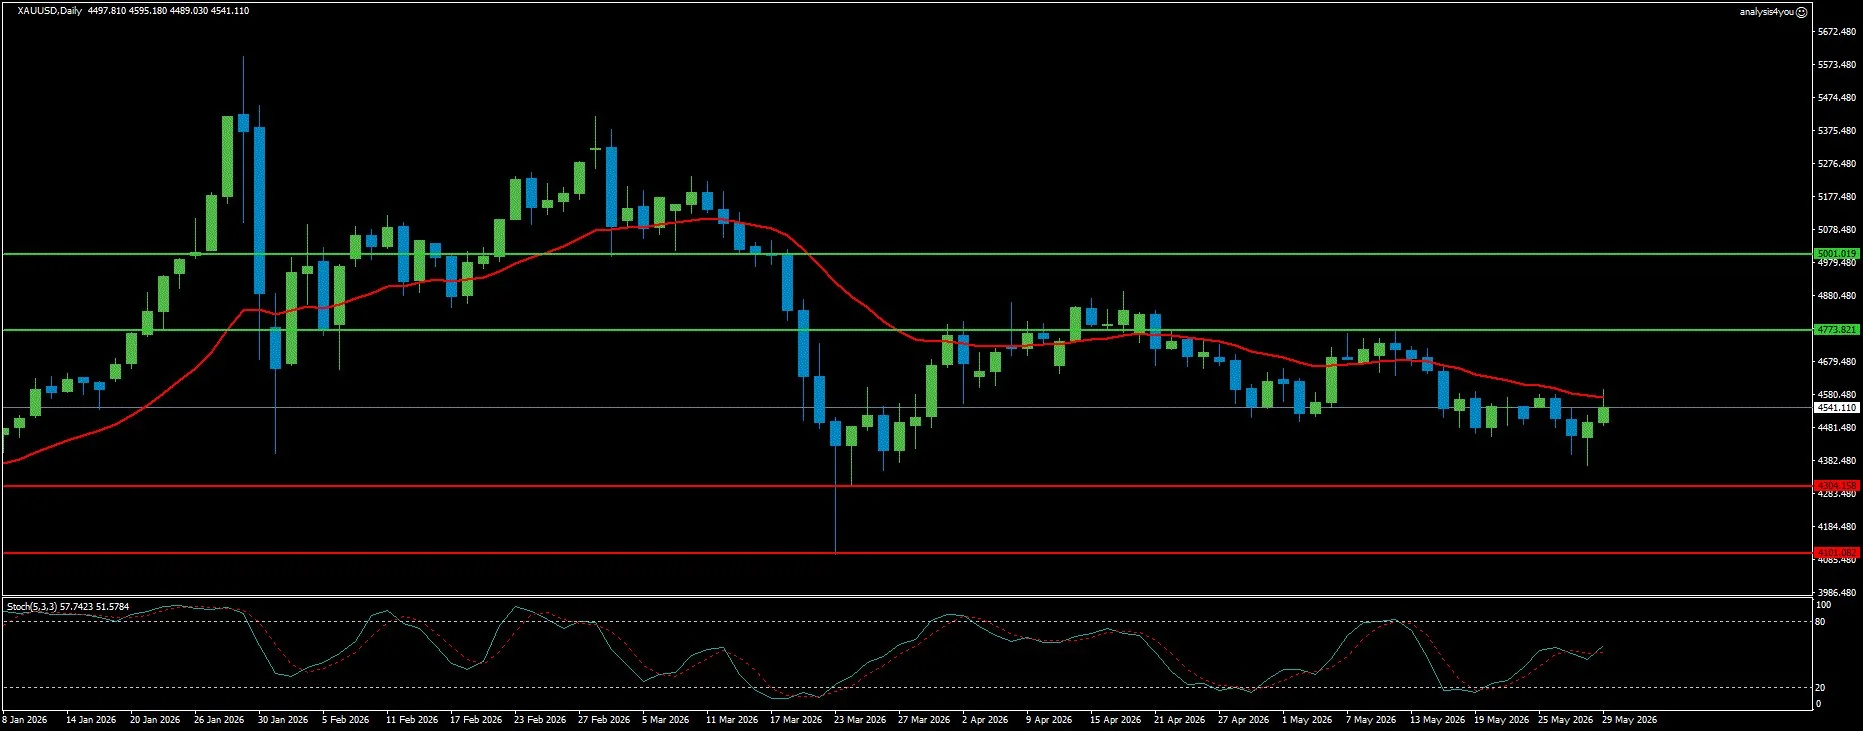
Gold: Bounced From 200-Day SMA Support, CPI and NFP Define Next Direction (4,541)
Current Trend: Cautiously Bullish
Resistance: 4,774 | 5,001
Support: 4,304 | 4,101
Gold staged a technically significant recovery during the prior week. The intraday low below $4,370 on Thursday (testing both the 200-day SMA and the bottom line of the descending triangle pattern) held. The bounce was decisive and closed the day in positive territory, with Gold recovering above $4,500 and ending the week near $4,541.
This is the most important technical development for Gold since the descending triangle formed (the $4,380 to $4,400 support zone proved to be a valid and significant floor). The fundamental picture for Gold remains a binary outcome tied to the Iran MOU.
If the US and Iran officially sign the MOU and open the Strait of Hormuz, a steady decline in oil prices (already happening, with WTI down approximately 12%) could ease inflation fears over time and support XAU/USD. The Fed rate hike probability would still rise approximately 50%, which remains the primary bearish overlay.
A soft May CPI on Thursday that reflects the energy price decline would be the most Gold-bullish outcome of the week. The ISM Manufacturing Prices Paid (Monday) and ISM Services Prices Paid (Wednesday) are the week’s inflation-leading indicators before the May CPI.
Technically, Gold is at $4,541, having bounced from lower Bollinger Bands to middle Bollinger Bands. The Stochastic at 57.74/51.58 is in mid-range with an uptrend and bullish signal.
On the upside, the $4,560 to $4,585 zone is the next hurdle (descending trend line and 20-day SMA). On the downside, a break below $4,380 to $4,400 opens the path toward $4,240.
Resistance: 4,774 / 5,001
Support: 4,304 / 4,101
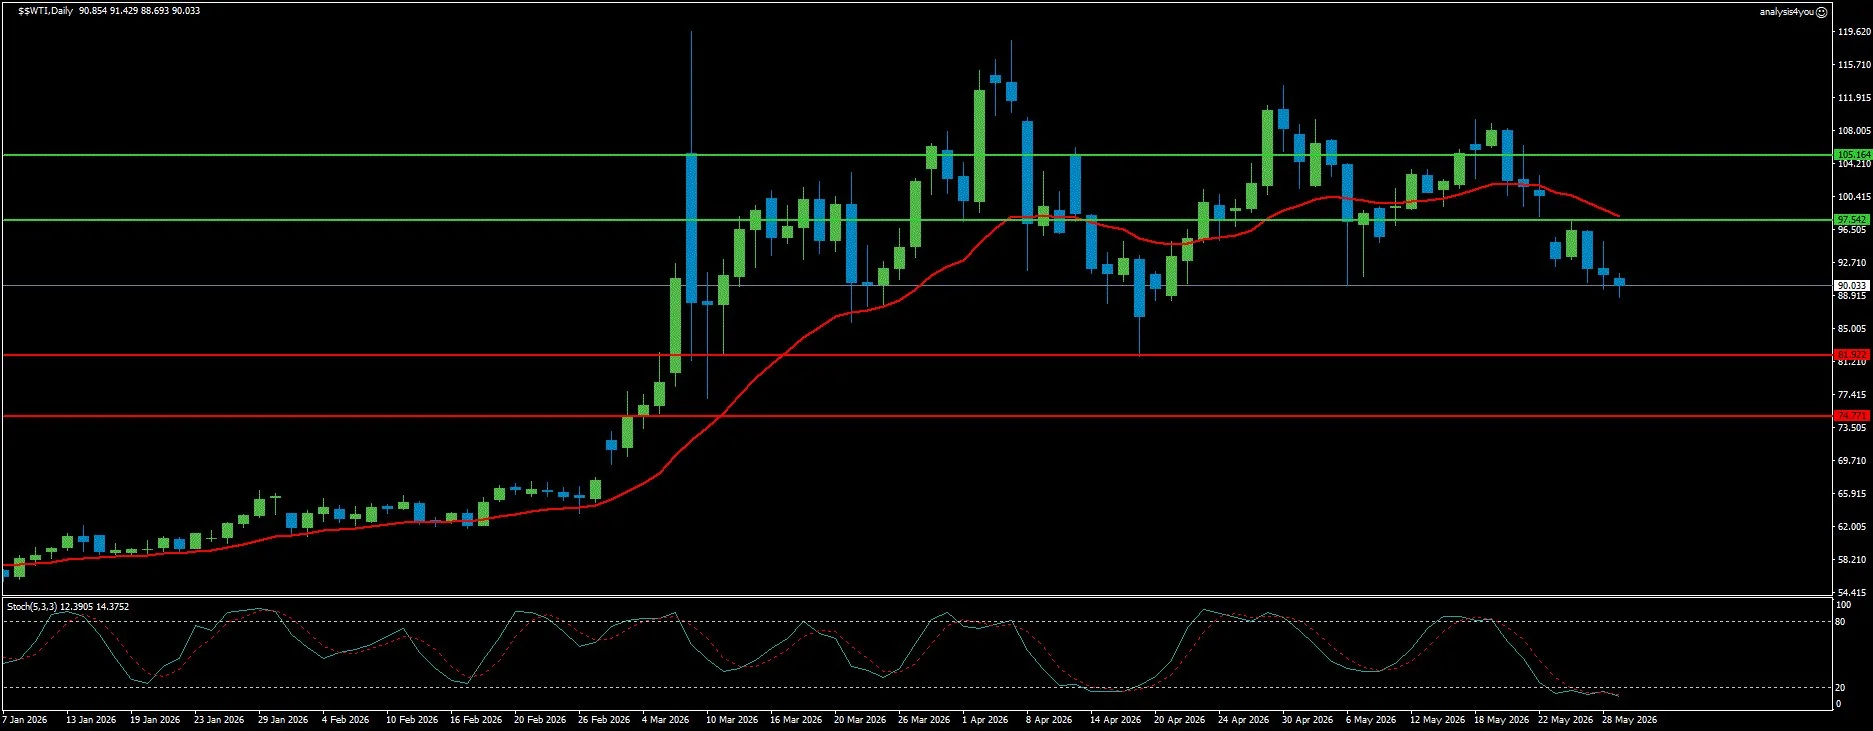
WTI Crude Oil: Most Oversold Reading of the Series, Iran MOU Is Structural Driver (90.03)
Current Trend: Bearish
Resistance: 97.54 | 105.16
Support: 81.92 | 74.77
WTI crude oil has experienced its most dramatic weekly collapse since the Hormuz reopening announcement, declining approximately 12% for the week. The Iran MOU (agreement to extend the ceasefire for 60 days and open the Strait of Hormuz) is the primary driver.
The technical picture is the most extreme of the entire series. WTI is now below MA 20 and MA 50 (and only barely above MA 200) with the current bar below lower Bollinger Bands. The Stochastic at 12.39/14.38 is deeply oversold in a downtrend with a bearish signal.
Even with the bearish trend, this is an extreme reading that historically generates technical bounces. The fundamental question is whether the Iran MOU translates into a genuine Hormuz reopening or another false dawn.
Trump’s statement Friday that the naval blockade will be lifted is the most concrete operational signal yet, but Qalibaf’s only actions are the measures adding Iranian conditionality.
The critical structural context: even if the peace deal is confirmed, full Hormuz flows will not return before Q1 or Q2 2027 (per ADNOC). The difference between $90 WTI and $60 WTI (pre-war levels) reflects both physical supply disruption and the risk premium. The peace deal may remove the risk premium (approximately $90 to approximately $75–$80) without immediately resolving the physical supply disruption.
Technically, WTI is at $90.03, below lower Bollinger Bands with the Stochastic at 12.39/14.38 (deeply oversold in a downtrend).
Resistance: 97.54 / 105.16
Support: 81.92 / 74.77
Crypto
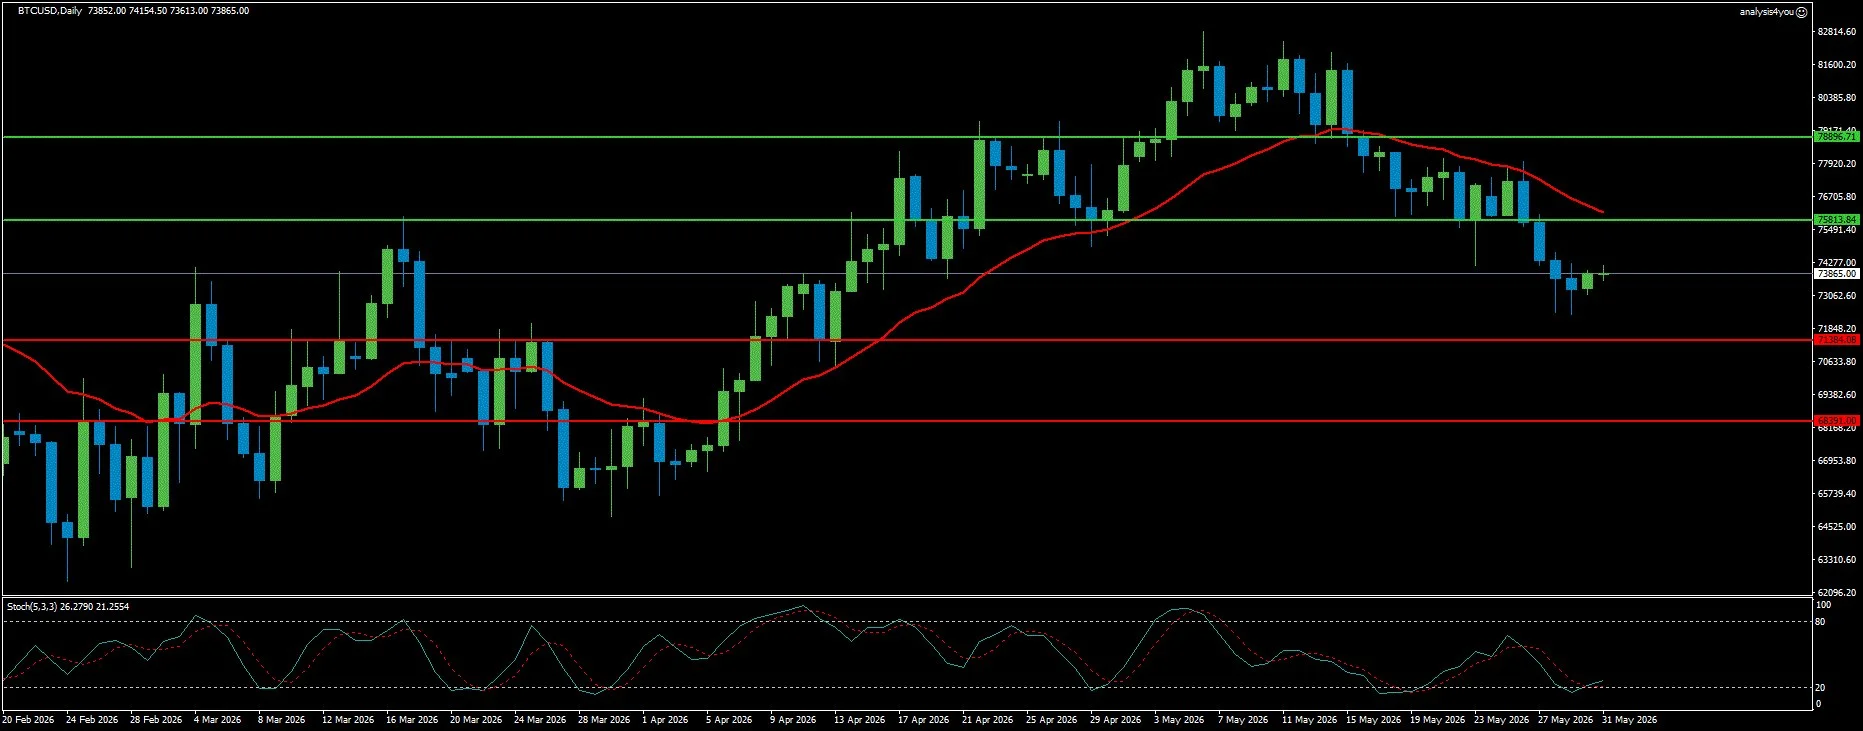
Bitcoin: Third Weekly Loss, Below 2025 Yearly Low, Bullish Stochastic Divergence Forming (73,865)
Current Trend: Bearish
Resistance: 75,814 | 78,897
Support: 71,384 | 68,391
Bitcoin has fallen into its most technically vulnerable position of the entire war period. At $73,865, it is now trading below the 2025 yearly low of $74,508, below MA 20, MA 50, and MA 200 simultaneously, and recorded its third consecutive week of over $1 billion in ETF outflows ($1.30 billion through Thursday).
The institutional sell-off that began when BTC was rejected from the 100-week EMA at $82,121 in mid-May has accelerated. The Coinbase Bitcoin Price Premium remains negative (confirming that US investor demand has not re-engaged) and CryptoQuant’s data shows both perpetual futures demand and spot ETF demand have flipped to net sellers.
The macro headwinds remain formidable. PCE at 3.8% YoY, core PCE at 3.3%, and Q1 GDP revised down to 1.6% reduce risk appetite while raising the opportunity cost of holding non-yielding assets like Bitcoin.
The most important technical signal entering this week is the bullish Stochastic divergence that has now formed. The Stochastic at 26.28/21.55 has shifted to an uptrend with a bullish signal while BTC is at lower Bollinger Bands. This is the identical pattern that preceded the EUR/USD bounce (from Stochastic 7.74 to 73.00) and the Gold bounce.
The Hormuz Safe Bitcoin-backed insurance service (Iran’s initiative charging $1 to $2 million per ship for transit coverage) adds a structural medium-term demand narrative.
Technically, BTC is at $73,865, with two consecutive lower Bollinger Band bars. Below MA 20, MA 50, and MA 200. The Stochastic at 26.28/21.55 is deeply oversold in an uptrend with a bullish signal.
If BTC closes below $74,508 on a weekly basis, the 200-week EMA at $68,708 becomes the next structural target.
Resistance: 75,814 / 78,897
Support: 71,384 / 68,391
Key Events (June 1–5, 2026)
Monday, June 2: ISM Manufacturing PMI (May). The Prices Paid component is the week’s first inflation-leading indicator.
Tuesday, June 3: JOLTS Job Openings (April). Former Fed Chair Jerome Powell appears publicly (his first remarks since leaving the Chair role).
Wednesday, June 4: ADP Employment Change (May, NFP preview). ISM Services PMI (May) with focus on the Prices Paid component. Eurozone May HICP preliminary (expected 3.3% YoY). Bank of England Governor Andrew Bailey’s testimony (most important GBP event of the week).
Thursday, June 5: US CPI (THE WEEK’S MOST IMPORTANT DATA RELEASE). The first inflation reading before the June 16–17 FOMC meeting. US Initial Jobless Claims.
Friday, June 6: US May Nonfarm Payrolls (THE WEEK’S HEADLINE DATA EVENT), following March’s 185K and April’s 115K readings. Canadian Employment Change is released simultaneously.
Week Ahead Outlook
The week of June 1–6 is the most employment- and inflation-concentrated week since the war began, arriving at a moment when both geopolitical and monetary policy regimes are simultaneously in transition.
Scenario 1: Iran MOU Confirmed + Soft May CPI + Weak NFP (≈25%)
Trump formally approves the MOU. Hormuz begins reopening. May CPI declines to 3.4% or lower. NFP below 100K. Fed rate hike probability falls from 50% to below 30%. DXY breaks below 98.10 toward 97.32. EUR/USD breaks above 1.1740. GBP/USD breaks above 1.3500 and 1.3601. S&P 500 advances toward 7,715. Gold breaks above $4,585. BTC rebounds toward 75,814.
Scenario 2: MOU Stalls + Mixed CPI + In-Line NFP (≈50%)
Iran and the US continue discussions without a formal signature. May CPI remains between 3.5% and 3.8%. NFP prints between 100K and 150K. DXY holds 98.10–99.17. EUR/USD trades between 1.1575 and 1.1740. GBP/USD remains in the 1.3312–1.3601 range. S&P 500 consolidates between 7,448 and 7,715. Gold holds $4,400–$4,585. BTC consolidates between 71,384 and 75,814.
Scenario 3: MOU Collapses + Hot CPI + Strong NFP (≈25%)
Trump rejects the MOU outright. Military tensions resume. WTI spikes back above $97.54. May CPI prints hot (headline above 4%). NFP exceeds 200K. Fed rate hike probability rises above 60%.
DXY advances toward 99.17 and 99.98. EUR/USD falls below 1.1575. GBP/USD breaks below 1.3312. Gold weakens as rising real yields outweigh safe-haven demand. BTC declines below 71,384.
Bottom line:
Thirteen weeks into the Iran war, markets appear to be entering a potential resolution phase, although no formal resolution has been reached. The Iran MOU is the first credible peace framework presented since the conflict began, but the market still requires a signed and implemented agreement before fully pricing in a durable outcome.Several technical signals are aligning across asset classes. The bullish Stochastic divergences in EUR/USD (confirmed), Gold (developing), and Bitcoin (forming) suggest that the inflation-driven US Dollar rally may be losing momentum and that some of the war-related risk premium could be unwinding.
WTI crude oil remains the most important confirmation indicator. The deeply oversold Stochastic reading (12/14), combined with price trading below the lower Bollinger Band, suggests conditions for a technical rebound. However, the broader trend remains bearish unless geopolitical developments reverse.
Meanwhile, the S&P 500 continues to demonstrate exceptional resilience, recording a ninth consecutive weekly gain while remaining near all-time highs. With Stochastic readings near 89/89 and major institutions warning of weakening breadth, June may become the first significant stress test for the current equity rally.

