War Erupts: US-Israel Strike Iran, Markets Brace for Monday Carnage

Market Sentiment Overview
Markets face an unprecedented crisis as Saturday’s coordinated US-Israel military strikes killed Iranian Supreme Leader Ayatollah Ali Khamenei and over 200 personnel, triggering Iran’s closure of the Strait of Hormuz—the chokepoint carrying 20% of global oil and 23% of LNG. At least 150 tankers have dropped anchor unable to transit, with WTI crude indicated to gap 9% higher to $73+ (from Friday’s $67.78 close) and Brent surging to $80 in over-the-counter trades. Sunday futures paint carnage: S&P 500 futures -0.43%, Dow -1.05%, Nasdaq -0.92%, projecting a 400+ point opening gap lower. The Dollar retreated to 97.36 despite remaining safe-haven bid, as the Supreme Court tariff ruling compounds geopolitical chaos—Trump announced new 15% global levies within hours of the court blocking his emergency authority. EUR/USD recovered to 1.1814 on Dollar confusion, while GBP/USD at 1.3476 faces BoE rate cut pressure amid UK political drama. Gold exploded to $5,280 (seventh consecutive monthly gain) targeting $6,000 as safe-haven flows intensify. Bitcoin languished at 66,306 on fifth consecutive month of losses—the longest correction streak since 2018. The week ahead features Broadcom (AVGO) earnings Wednesday (AI revenue doubling to $8.2B with 67% margin question), Friday’s NFP payrolls after January’s 130K surprise, and continuous headline risk as Iran retaliated with missiles on four Gulf nations while threatening decisive response.
Currencies
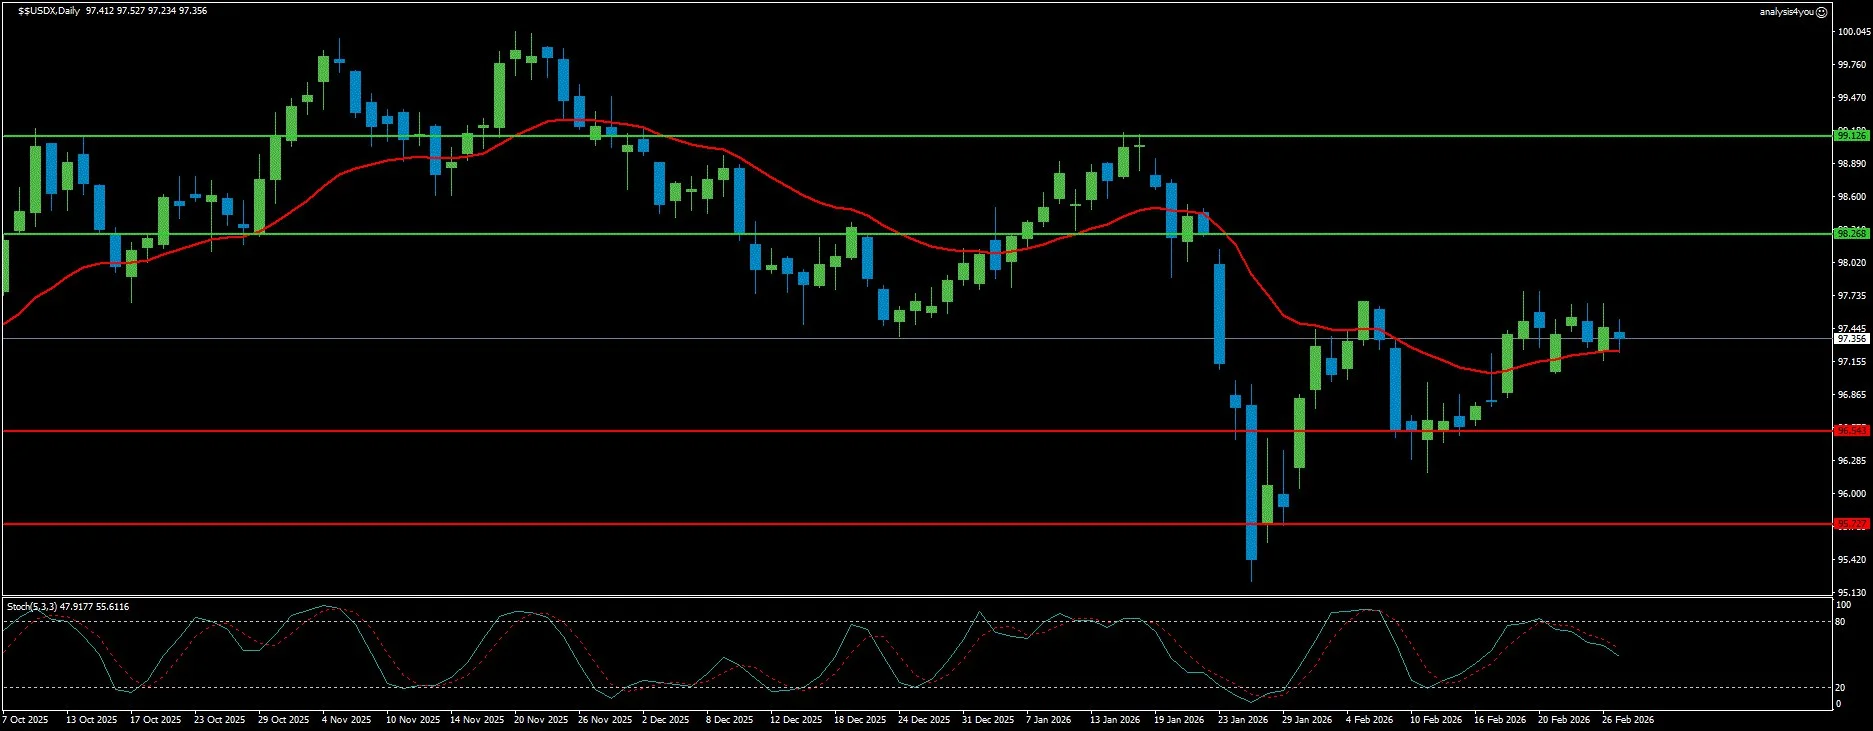
USD Index: Supreme Court Shock Meets Iran War Premium (97.36)
Current Trend: Mixed/Volatile
Market Sentiment: Confused (Safe-Haven vs Legal Uncertainty)
Resistance: 98.27 | 99.13
Support: 96.54 | 95.73
The Dollar Index trades at 97.36 in a state of complete confusion—simultaneously benefiting from safe-haven flows as war erupts in the Middle East while suffering from the Supreme Court’s Friday rejection of Trump’s tariff authority. The SCOTUS ruling struck down Trump’s use of the International Emergency Economic Powers Act (IEEPA), declaring he “checked the wrong statutory box” and lacked constitutional authority for sweeping global tariffs. Within hours, Trump announced new 15% global levies using alternative legal frameworks, specifically citing Section 301 of the Trade Act of 1974. CFTC positioning shows speculative net longs at approximately 330 contracts (first positive reading since summer 2025), but open interest falling to 26.6K for third straight week signals position reduction rather than bullish conviction. The transmission mechanism for Monday is straightforward: higher oil prices (Brent targeting $90-100 if Hormuz remains closed) compress margins, raise inflation expectations, and eliminate any remaining Fed cut probability. Core PPI already running at 3.6%—if Brent sustains above $90, headline CPI could hit 3.5-4.0% by summer, well above Fed’s 2% target. Markets price virtually zero chance of March cuts, only 80% probability for April. Resistance at 98.27 must break to signal war premium overcomes tariff ruling damage, with 99.13 required for sustainable recovery. Support at 96.54 provides floor, but break toward 95.73 would signal the legal uncertainty is overwhelming safe-haven demand and target the psychologically critical 95.41 recent low.
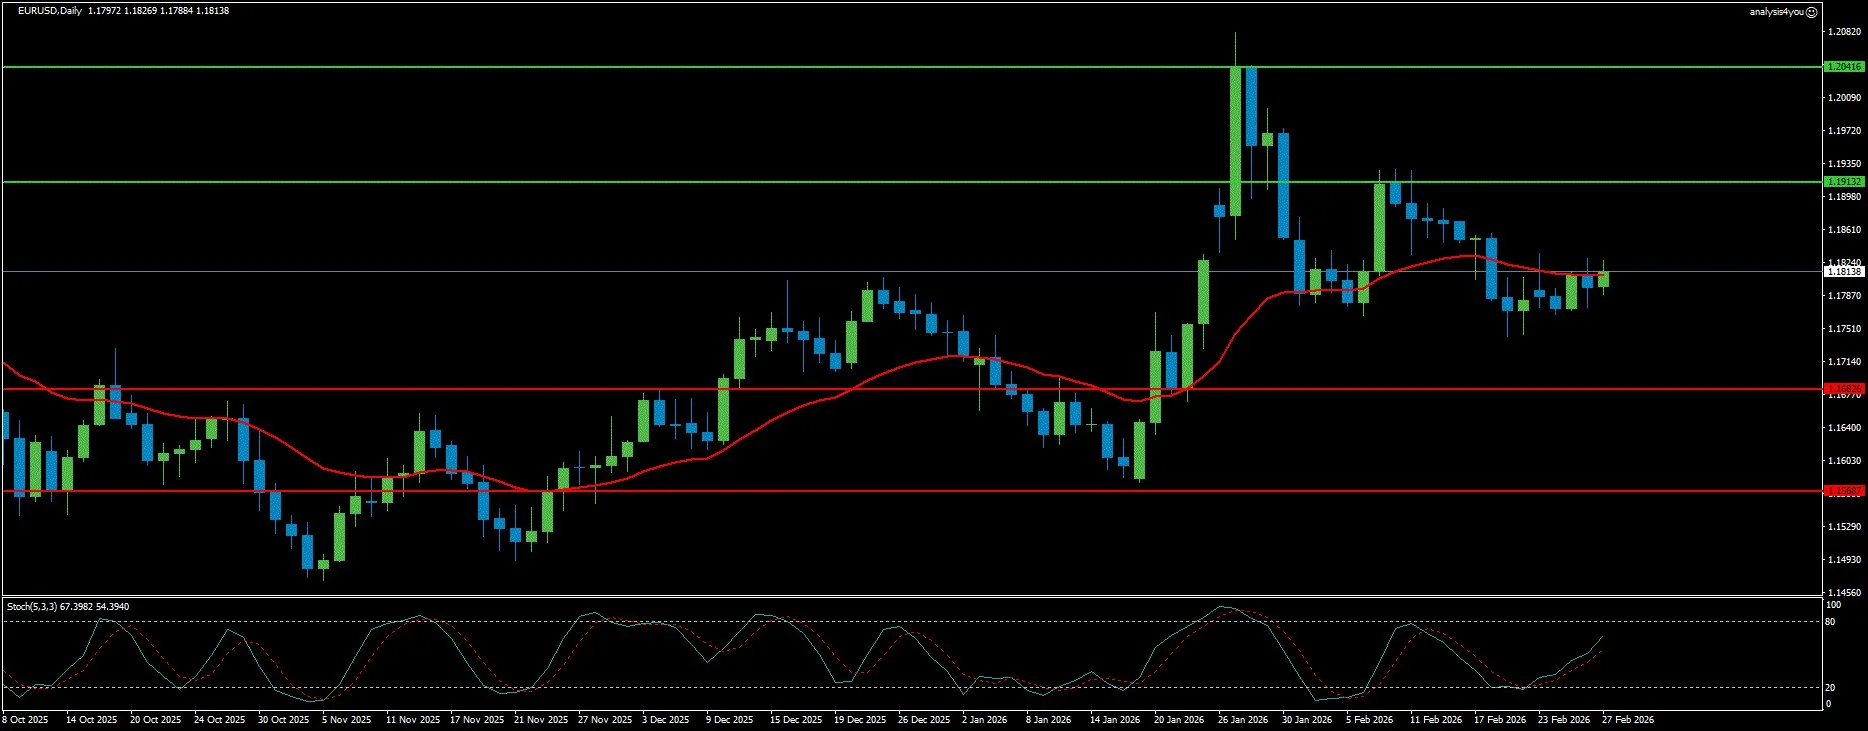
EUR/USD: ECB Holds Steady, Dollar Weakness Drives Recovery (1.1814)
Current Trend: Consolidative/Bullish Bias
Market Sentiment: Cautiously Positive
Resistance: 1.1913 | 1.2042
Support: 1.1683 | 1.1569
EUR/USD recovered to 1.1814, marking marginal weekly gains despite the pair’s inability to break convincingly above 1.1800 for most of the week. The ECB left rates unchanged as universally expected, with President Lagarde striking a confident but cautious tone in European Parliament testimony. Inflation projected to return to 2% over medium term, with wage pressures stabilizing and services inflation under close scrutiny. German preliminary CPI for February showed 1.9% YoY (down from 2.0%), confirming gentle cooling. However, speculative positioning reveals an interesting dynamic: net longs in the Euro have climbed to highest levels since 2020, while short positions have also risen sharply—when both sides increase exposure simultaneously, it signals conviction and tension rather than one-way bets. Open interest remains elevated, confirming this is a proper battle rather than thin, illiquid move. The fundamental picture remains mixed: Eurozone confirmed Q4 GDP at 0.3% quarterly with no surprises, leaving Euro fundamentally unattractive relative to resilient US data. What supports the pair is broad Dollar weakness from tariff ruling chaos and perception that “rates will eventually be lowered” under incoming Fed Chair Kevin Warsh. Iran war premium creates crosscurrents—safe-haven EUR demand versus Dollar strength. Resistance at 1.1913 needs clearing to challenge 1.2042 (January multi-year high). Support at 1.1683 should hold on minor Dollar strength, with 1.1569 as stronger floor—break below would signal renewed bearish momentum toward 1.1500 psychological level.
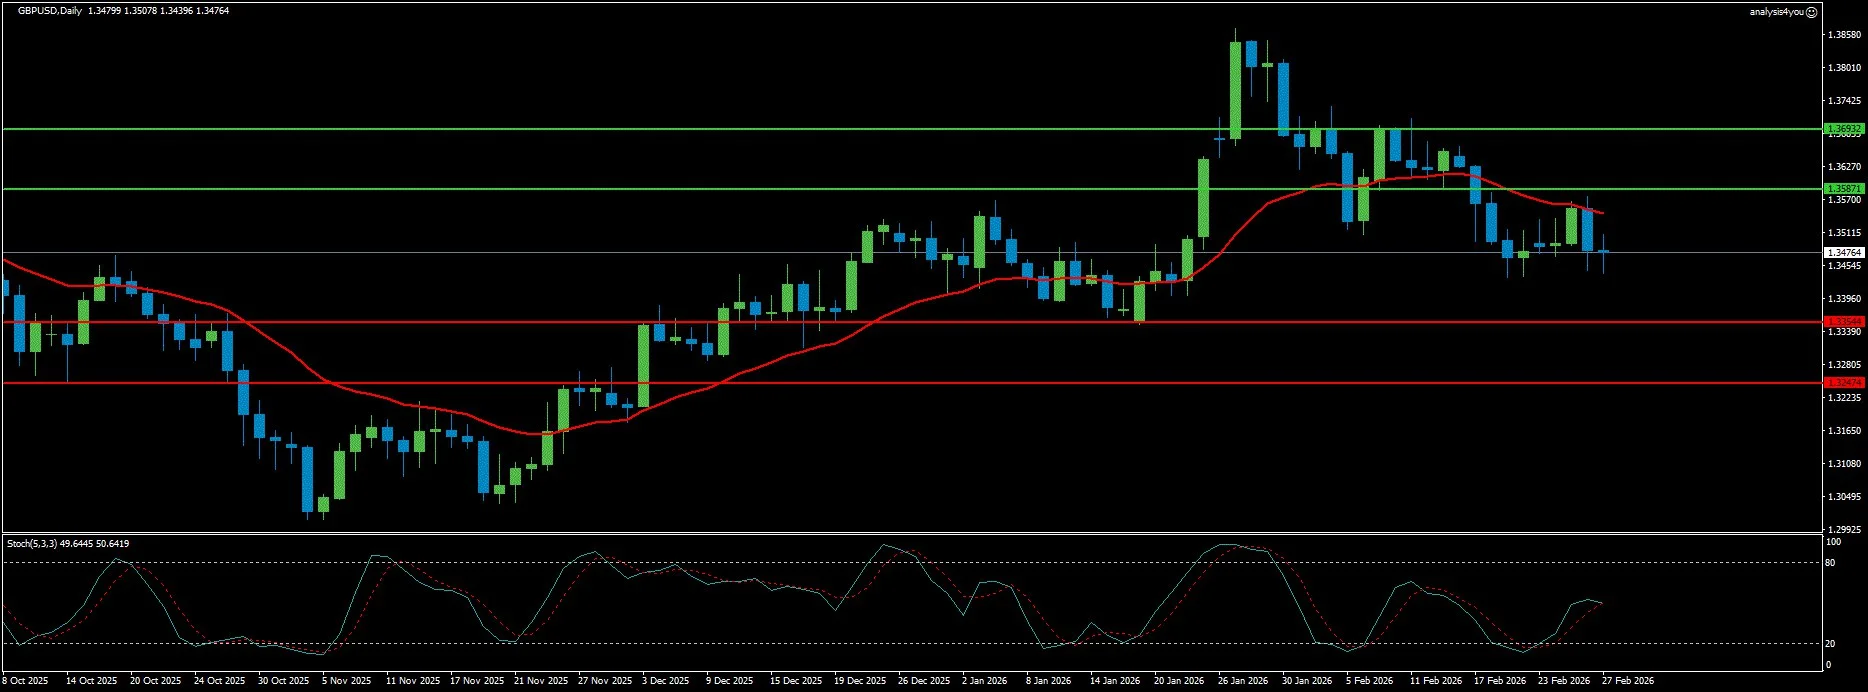
GBP/USD: Defending 200-Day SMA Amid Political Drama (1.3476)
Current Trend: Bearish Consolidation
Market Sentiment: Vulnerable
Resistance: 1.3587 | 1.3693
Support:1.3354 | 1.3247
The Pound settled at 1.3476 after testing the critical 200-day SMA near 1.3440 multiple times, successfully defending support but showing no conviction for recovery. UK political drama intensified Friday as the Green Party won the Gorton and Denton by-election—their first ever Westminster by-election victory—handing PM Keir Starmer’s Labour Party an embarrassing defeat amid allegations of illegal voting. BoE Governor Bailey’s Parliament testimony signaled “scope for rate cuts” with inflation expected to return to 2% target, reinforcing market expectations for May easing (potentially as early as March given the shocking dovish 5-4 vote split at February meeting where four members wanted immediate cuts). Economic data painted mixed picture: unemployment hit near five-year high of 5.2%, wage growth decelerated to 4.2% from 4.4%, but retail sales surged 1.8% monthly (vs 0.2% expected)—largest jump since May 2024. S&P Global UK Composite PMI rose to 53.9 in February from 53.7 (highest since April 2024), suggesting economic resilience despite cooling inflation. RSI at 41 signals fading momentum below 50 midline, reinforcing building downside pressure. US PPI Friday showed producer inflation rising 2.9% (above 2.6% consensus), allowing Dollar to hold ground into weekend and pressuring GBP/USD. Resistance at 1.3587 needs to be overcome to target 1.3693, but near-term bias favors sellers. Support at 1.3354 aligns with recent lows and must hold to maintain bullish structure, with stronger support at 1.3247 as deeper floor if dovish BoE signals intensify or UK political crisis deepens.
Stocks
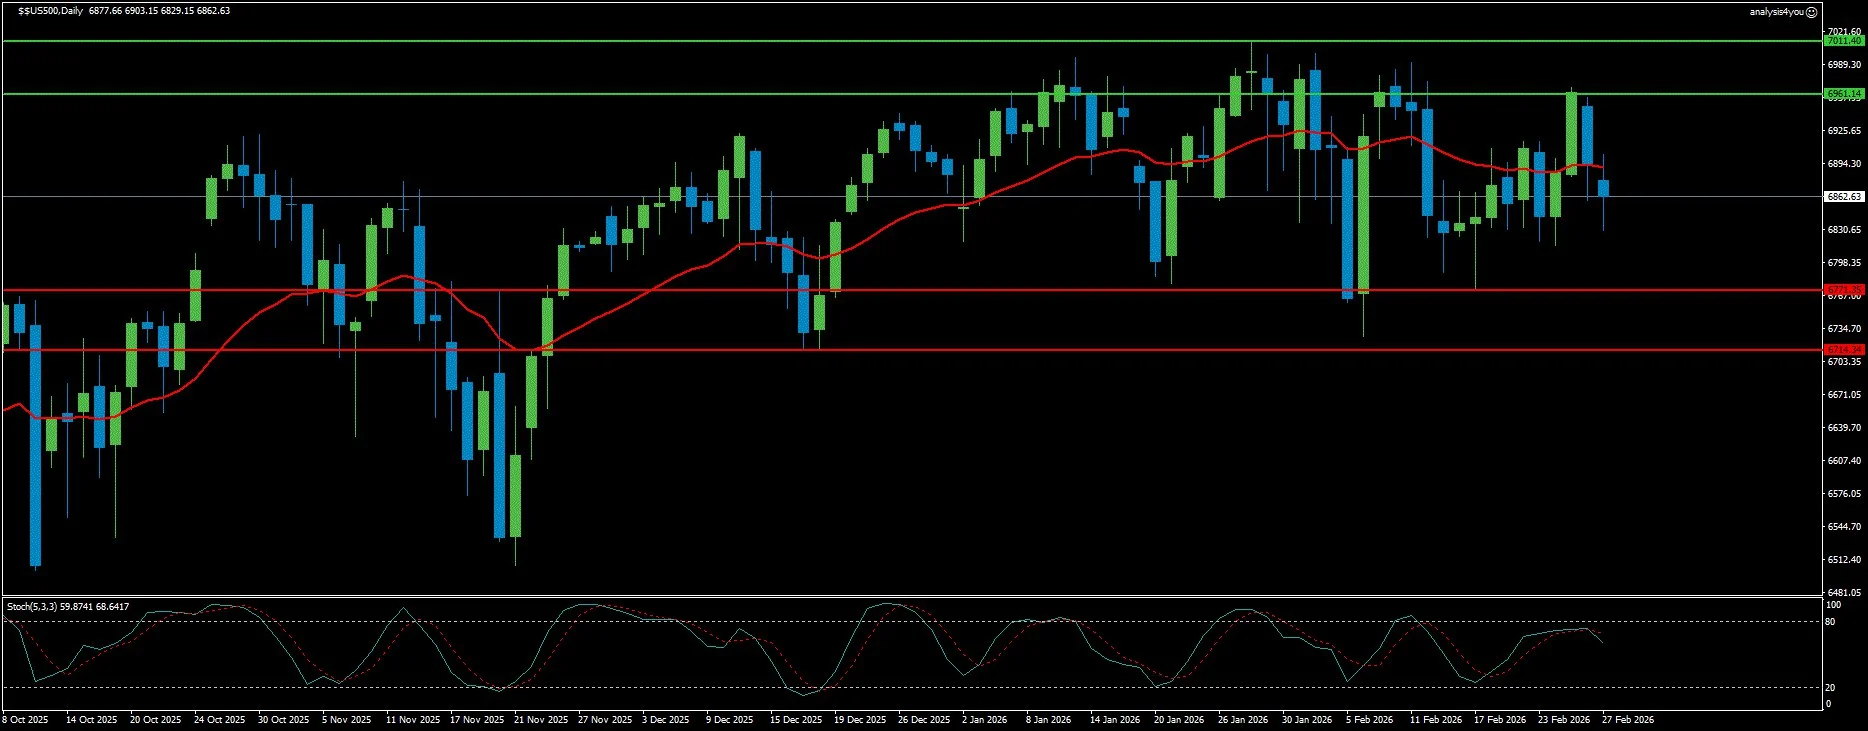
S&P 500: Coiled Spring Meets War Shock, Monday Gap to 6,800s (6,863)
Current Trend: Range-Bound (Breaking Lower on Iran)
Market Sentiment: Extremely Negative
Resistance: 6,961 | 7,011
Support: 6,771 | 6,714
The S&P 500 closed Friday at 6,863, posting its worst month since March 2025 with -0.93% February decline. Sunday futures at -0.43% project opening near 6,833, likely gapping through immediate support at 6,771 toward critical 6,714 make-or-break level. The index exhibits the tightest weekly Bollinger Bands since 2019—BTIG strategist Jonathan Krinsky’s “coiled for a significant move” warning is about to materialize, and Iran ensures the breakout is to the downside. The market faces the alarming divergence that’s been flashing warnings for weeks: defensive sectors (consumer staples, utilities, energy, materials) dramatically outperforming technology while index hovers near all-time highs—a leadership pattern that has preceded 10%+ corrections in 63% of historical instances. Currently, 63% of S&P 500 stocks outperform the index (highest since 2001). When consumer staples lead while markets sit near highs, corrections typically follow within weeks. Nvidia (NVDA) at $177.80 pre-market (after -4.2% Friday) symbolizes the AI rotation reversal—company beat earnings, raised guidance, and still collapsed because “excellence was already in the price.” The Shiller CAPE ratio above 40 matches dot-com bubble levels, raising serious valuation concerns. Simplify Asset Management’s $10B strategist Michael Green warns passive investing bubble creates 1929-style crash framework—global passive AUM soared 400% from 2012-2023, inflating valuations 15% annually through mechanical flows disconnected from fundamentals. Citrini Research models 40-60% drawdown scenarios driven by AI white-collar displacement, unemployment surge, and private credit stress (software accounts for 40% of PE-backed loans). Resistance at 6,961 becomes irrelevant if Iran gap breaks 6,771 support decisively. Critical support at 6,714 is make-or-break—breach exposes mid-6,600s and confirms defensive rotation signals genuine distribution rather than healthy broadening. Monday’s 400+ point Dow gap lower (-1.05% futures) suggests tech-heavy Nasdaq at -0.92% faces even worse damage.
Commodities
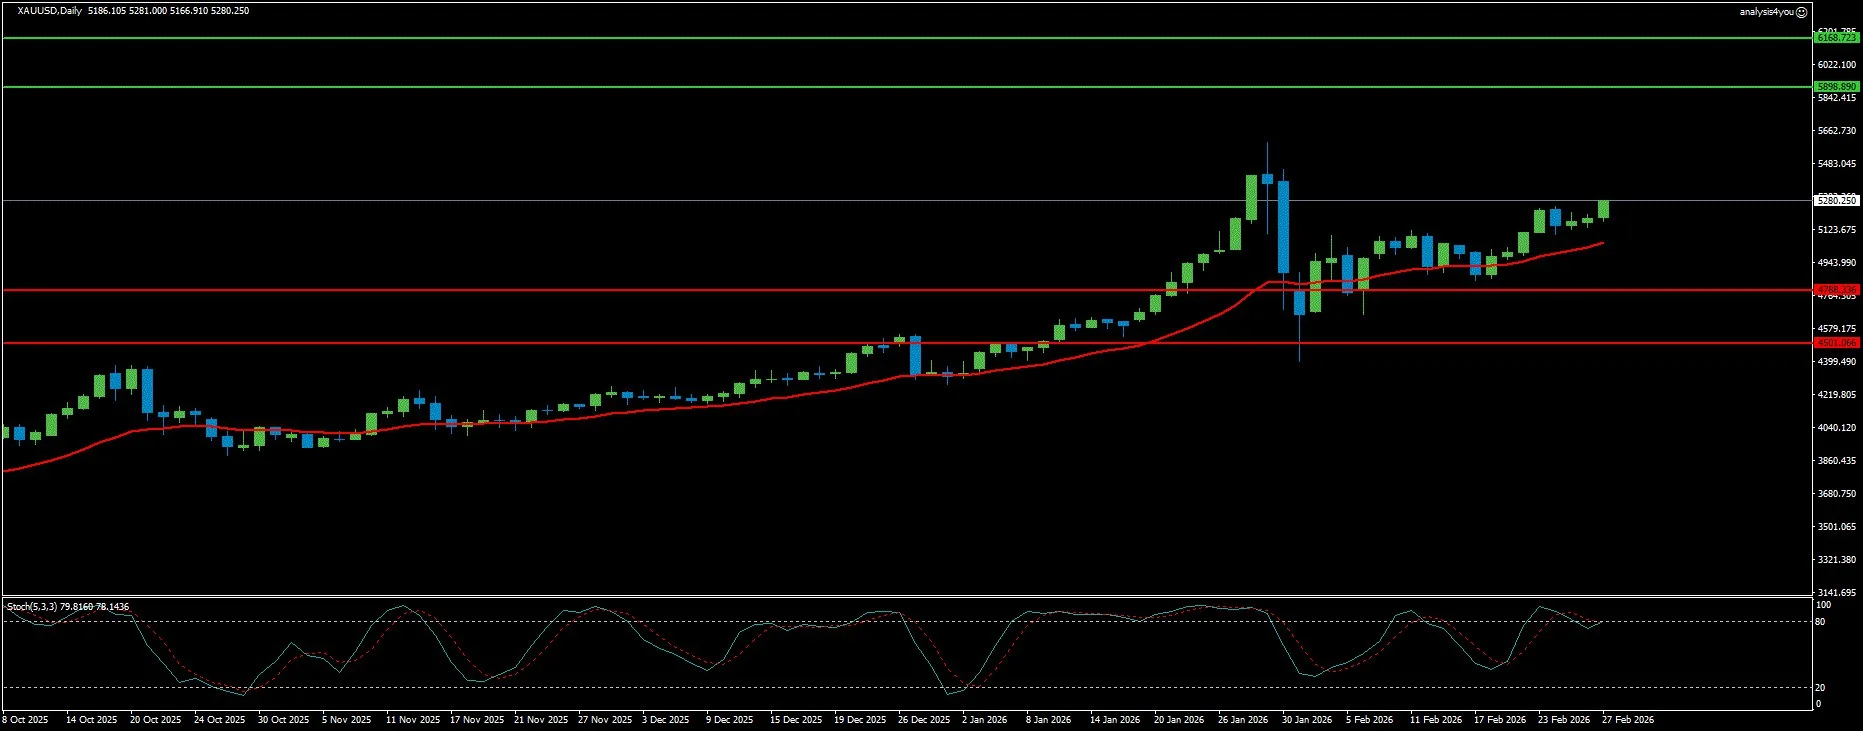
Gold: Seven Straight Monthly Gains, Iran Sends Bullion to $5,280 (5,280)
Current Trend: Strongly Bullish
Market Sentiment: Extremely Positive (War Premium)
Resistance: 5,899 | 6,169
Support: 4,788 | 4,501
Gold exploded to $5,280, marking its seventh consecutive monthly gain and fourth consecutive positive week as the ultimate safe-haven surged on the Iran war shock. The precious metal gapped higher Monday on Trump’s tariff response to SCOTUS ruling, climbed to fresh February high above $5,200 Tuesday, then extended gains relentlessly through week on escalating US-Iran tensions. Saturday’s coordinated strikes killing Supreme Leader Khamenei and Sunday’s Hormuz closure sent weekend over-the-counter trades toward $5,300+. The 10-year Treasury yield falling to 3.961% despite core PPI at 3.6% confirms the bond market is pricing growth collapse—a bull flattening signal that historically supports Gold even amid inflation concerns. CME margin hikes on Gold/Silver futures amid heightened volatility ironically helped prices Friday as forced selling eased. ING Commodities Strategist Ewa Manthey argues “structural drivers support Gold in near term—as long as geopolitical fragmentation persists, meaningful reversal in central bank gold demand looks unlikely.” With Fed expected to begin cutting rates in Q2 (despite current hawkish stance), “even modest easing cycle would support Gold, lowering real yields and reducing opportunity cost of holding non-yielding assets.” Immediate resistance at 5,899 represents first significant barrier, with extended target at 6,169 if momentum continues. RBC’s warning that Middle East leaders told Washington “$100-plus oil was clear and present danger” applies equally to Gold—if crude hits $100, Gold targets $6,000+. Support at 4,788 should hold given dovish BoE/ECB, US data uncertainty, Iran war, and Moody’s US credit downgrade. Critical support at 4,501 represents ultimate floor protecting bull trend. As long as Gold holds above 4,788, tactical bias favors buying dips with upside uncapped.
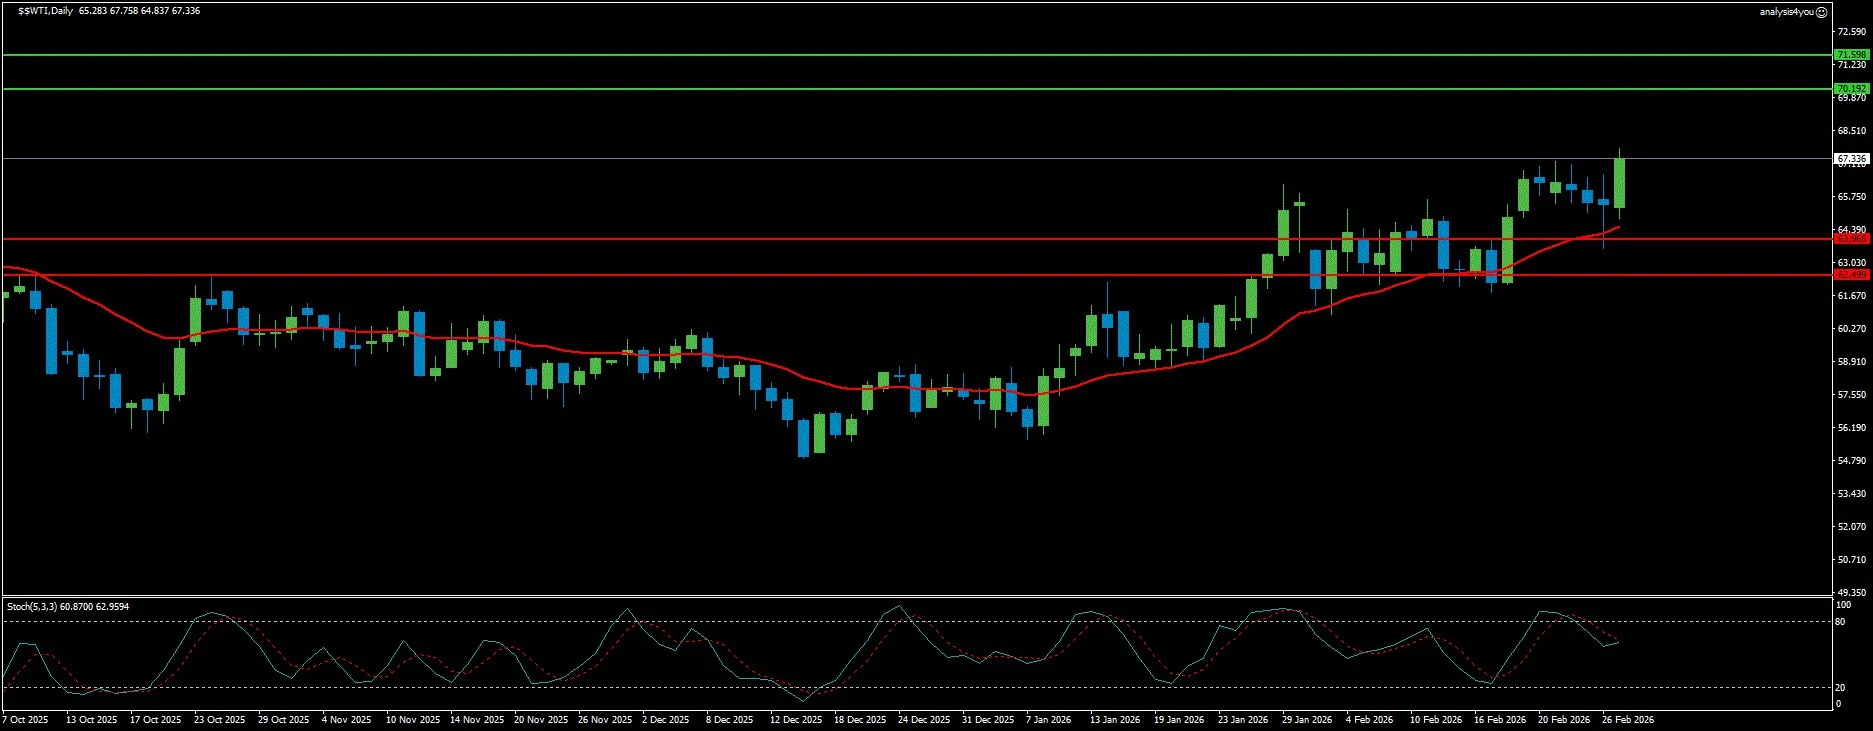
WTI Crude Oil: Hormuz Closed, Monday Gap to $73, Target $90-100 (67.34)
Current Trend: Strongly Bullish (War-Driven)
Market Sentiment: Extremely Positive
Resistance: 70.19 | 71.60
Support: 63.97 | 62.50
WTI crude closed Friday at $67.78 (highest since August 2025), up 23% from December lows. Then Saturday’s strikes changed everything. Iran’s Revolutionary Guards closed the Strait of Hormuz—carrying 20% of global oil and 23% of LNG, handling $500B annual energy trade. At least 150 tankers dropped anchor unable to transit. A Marshall Islands-flagged tanker was attacked off Oman Sunday. IG weekend markets show WTI opening 9% higher above $73. Private Brent trades jumped 10% to $80—highest since June 2025 previous Iran strike. The technical double-bottom at $55.15 already produced 23% breakout before war premium hit. WTI reclaimed 50-week and 100-week EMAs, ADX climbed to 17 (highest since August), RSI reached 55 without overbought conditions—textbook mid-cycle momentum with room for significant upside. OPEC+ added 206,000 bpd Sunday (50% more than planned 137,000), but barrels cannot reach market through closed strait. Saudi Arabia and UAE export through Hormuz—production increases are accounting exercises until shipping resumes. Barclays projects $80 on “material supply disruption” (already met). RBC warns “$100-plus oil is clear and present danger” based on regional leaders’ warnings to Washington before strikes. Mizuho flags 10-25% premium if turmoil widens ($80-90 range). Every $10 crude increase adds 0.3-0.4 percentage points to headline CPI over 3-6 months—Brent at $100 pushes US CPI toward 3.5-4.0% by summer, eliminating Fed cut window entirely. Resistance at 70.19 gets blown through Monday gap, with 71.60 next. Support at 63.97 and 62.50 irrelevant unless rapid de-escalation (low probability given Khamenei’s death). Target $80-85 if Hormuz remains closed 1-2 weeks (base case 45-50% probability). Target $90-100 if conflict broadens or closure extends beyond two weeks (20-25% probability rising daily).
Crypto
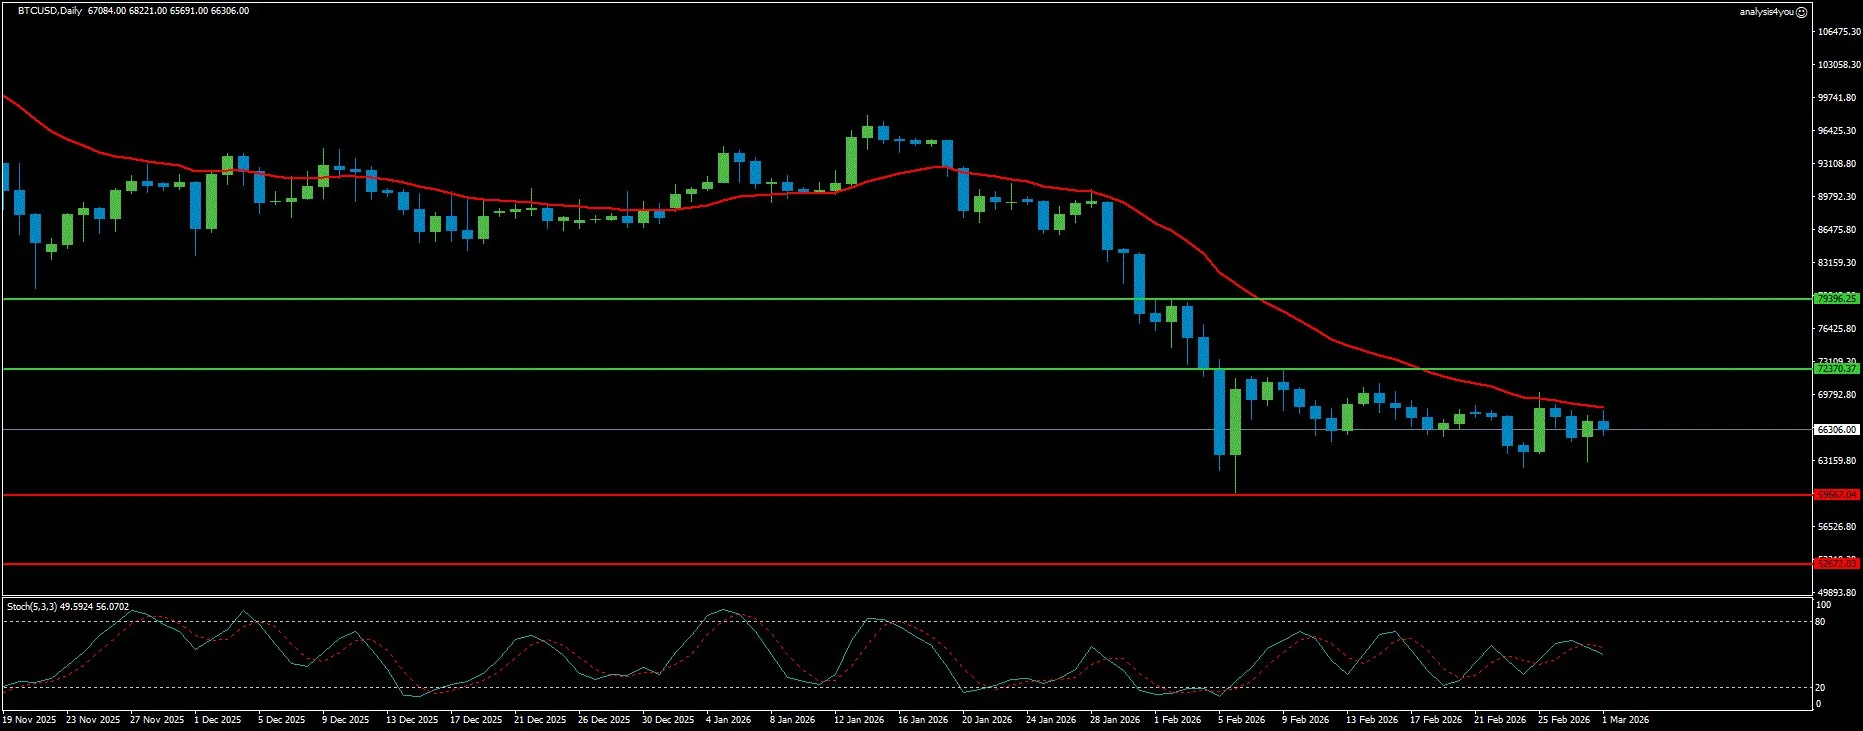
Bitcoin: Fifth Monthly Loss Since October, Iran Gap Risk to $60Ks (66,306)
Current Trend: Bearish (Incomplete Capitulation)
Market Sentiment: Extremely Negative
Resistance: 72,370 | 79,396
Support: 59,667 | 52,672
Bitcoin stabilizes around $66,306 Friday but faces fifth consecutive month of losses—longest correction streak since August-December 2018. February on track to close -14.51% after January’s -10.17%, marking rare consecutive monthly declines to start the year (historically happened only in 2014, 2018). However, institutional demand showed first signs of life: spot Bitcoin ETFs recorded $814.86M inflow through Thursday, breaking five-week outflow streak since January 23. Strategy (MSTR) purchased 592 BTC Monday (total 717,722 BTC at $76,020 average), though dramatically reduced from prior 2,486 BTC weekly pace. The relief may prove temporary—tariff uncertainty from Trump’s SCOTUS loss then immediate 15% global tariff announcement weighs on risk appetite. Iran war shock Monday likely gaps BTC toward $60,000-63,000 support zone as risk-off overwhelms crypto. CryptoQuant’s weekly report confirms market structure suggests “deleveraging and cooling conditions, but not market bottom.” CME futures yield curve slope trending lower mirrors pre-2018/2021 bear cycles, with slope remaining positive (indicating positioning stress hasn’t reached capitulation). Basis remains in contango rather than backwardation that marked historical bottoms. Monthly cumulative realized losses at just 0.3M BTC versus 1.1M BTC at 2022 bear bottom confirms incomplete capitulation. MVRV ratio outside extreme undervalued zone. Resistance at 72,370 must clear decisively to alleviate pressure, with 79,396 required for trend reversal. Critical support at 59,667 is make-or-break—breach exposes 52,672 and potentially CryptoQuant’s predicted $55K “ultimate bottom” based on realized price bands. RSI weekly at 27 (oversold) but daily at 42 (neutral) suggests short-term stabilization within longer-term downtrend. Iran gap Monday likely tests 59,667 support decisively.
Key Events This Week (March 2-6, 2026)
Geopolitical – DOMINATES EVERYTHING
- Ongoing: Strait of Hormuz closure (150+ tankers anchored, 20% global oil blocked)
- Throughout Week: US-Iran military developments after Khamenei killing
- Risk: Iran attacks on Gulf oil infrastructure, broader Middle East conflict
- Wildcard: US Navy establishing shipping corridor vs Iran escalation
Major Economic Releases
- Monday: ISM Manufacturing PMI (February), DP World suspends Jebel Ali operations
- Tuesday: ADP Private Employment (February estimate), ISM Services PMI
- Wednesday: Broadcom (AVGO) Earnings (AI revenue doubling to $8.2B, 67% margin question), Fed Beige Book, Apple product launches conclude
- Thursday: Weekly Jobless Claims, Costco, Marvell Tech, CrowdStrike earnings
- Friday: NFP Payrolls (critical after January’s 130K surprise), Unemployment Rate, Delayed January Retail Sales
Corporate Earnings – Make-or-Break Week
- Monday: MongoDB (MDB)
- Tuesday: CrowdStrike (CRWD), Target (TGT), Best Buy (BBY), Ross Stores (ROST), AutoZone (AZO)
- Wednesday: Broadcom (AVGO) – week’s most consequential event
- Thursday: Marvell Technology (MRVL), Costco (COST), Kroger (KR), JD.com (JD), Burlington (BURL)
- Friday: Consumer Credit data
Fed Speakers & Central Banks
- Tuesday: Fed’s Williams (NY), Kashkari (Minneapolis) – asked about Iran and inflation
- Throughout: Multiple Fed officials clarify hawkish stance amid war shock
- Note: Fed blackout begins March 7 ahead of March 17-18 FOMC meeting
Week Ahead Outlook
Monday opens with every US equity index gapping violently lower on the Iran war shock. Dow futures at -1.05% project 400+ point opening loss. Nasdaq futures at -0.92% compound AI rotation selloff with geopolitical risk-off. WTI crude indicated to gap 9% to $73+, Brent at $80 targeting $90-100 if Hormuz remains closed. The transmission mechanism is straightforward and brutal: higher oil prices compress margins, raise inflation expectations (core PPI already 3.6%), and eliminate any remaining Fed easing probability. If Brent sustains above $90, headline CPI could hit 3.5-4.0% by summer—well above Fed’s 2% target and far above any level where rate cuts are defensible.
The Supreme Court tariff ruling Friday adds legal uncertainty to geopolitical chaos. Trump’s immediate 15% global tariff announcement using Section 301 authority faces potential similar challenges, creating ongoing policy uncertainty. FedEx already sued for refund, with Costco, Revlon, and EssilorLuxottica filing claims. This compounds the Dollar’s confusion—simultaneously safe-haven bid from war while suffering legal/policy uncertainty.
Wednesday’s Broadcom (AVGO) earnings represent the week’s most consequential corporate event amid the chaos. AI revenue doubling to $8.2B with $162B backlog ($73B tied to AI orders within 18 months) makes AVGO the highest-conviction AI play. The 67% adjusted EBITDA margin guides is critical—Q4 precedent showed 3.18% revenue beat and 4.38% EPS beat produced 10%+ stock decline because margins disappointed. If HBM price surges (TrendForce reports 80-85% Q1 jump) pressuring costs more than guidance assumed, margins miss and AVGO revisits $290-300, accelerating the AI selloff. If 67%+ margins hold with double-beat, stock reprices toward $360-380 and lifts entire semiconductor complex. Iran strikes add Monday gap risk toward $310-315 zone. The 4.4:1 reward-to-risk argues for buying any war-driven weakness below $310.
Friday’s NFP payrolls decides the week’s second-half direction. January’s 130K jobs (double 70K consensus) beat but prior months revised lower. If February confirms labor resilience (unemployment at/below 4.3%, headline above 100K), Treasury’s growth warning gets pushed back and equities stabilize after war-driven selloff. If unemployment rises above 4.3% or headline prints below 80K, bond market’s bull flattening signal (10-year at 3.961% despite 3.6% core PPI) gets validated, Fed forced toward emergency easing posture, and S&P 500 breaks February low decisively. Delayed January retail sales arrives simultaneously—if consumer spending confirmed December stall, recession probability spikes.
The S&P 500’s position at 6,863 with tightest Bollinger Bands since 2019 guaranteed the coiled spring would release violently. Iran ensures the break is to downside. Defensive sector leadership (consumer staples, utilities leading near highs) has preceded 10%+ corrections in 63% of historical instances. Combined with CAPE above 40 and Michael Green’s passive bubble warning (400% AUM growth mechanically inflating valuations 15% annually), the setup argues extreme caution. Resistance at 6,961 irrelevant if Iran gap breaks 6,771. Critical support at 6,714 is make-or-break—break likely cascades toward mid-6,600s.
The Dollar at 97.36 faces impossible crosscurrents. Resistance at 98.27 must break to signal war premium overcomes tariff ruling, with 99.13 required to confirm recovery. Support at 96.54 provides floor, but 95.73 break suggests legal uncertainty overwhelming safe-haven demand. EUR/USD at 1.1814 needs 1.1913 clear to target 1.2042. GBP/USD at 1.3476 defending 200-day SMA is vulnerable to 1.3354-1.3247 if BoE accelerates cuts or UK politics deteriorates further.
Gold at $5,280 remains strong buy—support at 4,788 should hold, upside uncapped if conflict persists. Target 5,899 near-term, 6,169 extended. WTI at $67.34 Friday gaps to $73+ Monday, targeting $80-85 if Hormuz closure persists 1-2 weeks (base case), $90-100 if conflict broadens or extends beyond two weeks. Bitcoin at 66,306 likely gaps toward $60,000-63,000 support Monday as risk-off crushes crypto—59,667 support critical, breach exposes 52,672 and potential $55K capitulation.
Risk management is absolutely paramount. This week combines: (1) Active US-Iran war with Hormuz closed blocking 20% of global oil, (2) S&P 500 at tightest Bollinger Bands since 2019 breaking lower on war shock, (3) Defensive sector leadership flashing pre-correction warnings, (4) Broadcom earnings Wednesday deciding AI rotation, (5) NFP Friday after January surprise, (6) Supreme Court tariff ruling creating legal chaos, (7) Crude targeting $90-100 threatening stagflation, (8) Bitcoin fifth monthly loss with incomplete capitulation. Position sizes must be reduced, stops tight, prepared for gap risk and outsized moves. The coiled spring is releasing—and Iran ensures it’s explosive to the downside.

