Strong Jobs Meet Soft CPI: Dollar Defies Data as Japan Shock Dominates

Market Sentiment Overview
Markets entered the Presidents’ Day holiday week facing a paradox—blockbuster US employment data (130K NFP vs 70K expected, unemployment falling to 4.3%) and softer-than-expected inflation (CPI 2.4% vs 2.5% forecast) both failed to sustainably boost the Dollar, which tumbled to 96.59 near two-week lows despite fundamentally supportive prints. Instead, Japanese Prime Minister Sanae Takaichi’s landslide election victory triggered a “Buy Japan” wave that sent the Yen surging 2.8%—its strongest weekly advance since November 2024—crushing USD/JPY and dragging the entire Dollar complex lower. EUR/USD surged to 1.1868 for a third consecutive week above 1.1800, while GBP/USD held at 1.3655 ahead of critical Wednesday UK CPI. Gold experienced Thursday’s violent flash-crash (losing 3%+ in hours, Silver plunging 11%) before recovering to 5,043, while WTI crude slipped to 62.71 on oversupply fears despite Iran risks. Bitcoin dropped to 68,957 on fourth consecutive weekly ETF outflows ($375M), with CryptoQuant warning the structural bottom isn’t in yet. The S&P 500 slumped to 6,827, unable to hold above 6,900 as AI-driven software carnage overwhelmed strong macro data. The week ahead features Wednesday’s Fed Minutes, Friday’s Q4 GDP and core PCE deflator, plus February flash PMIs globally.
Currencies
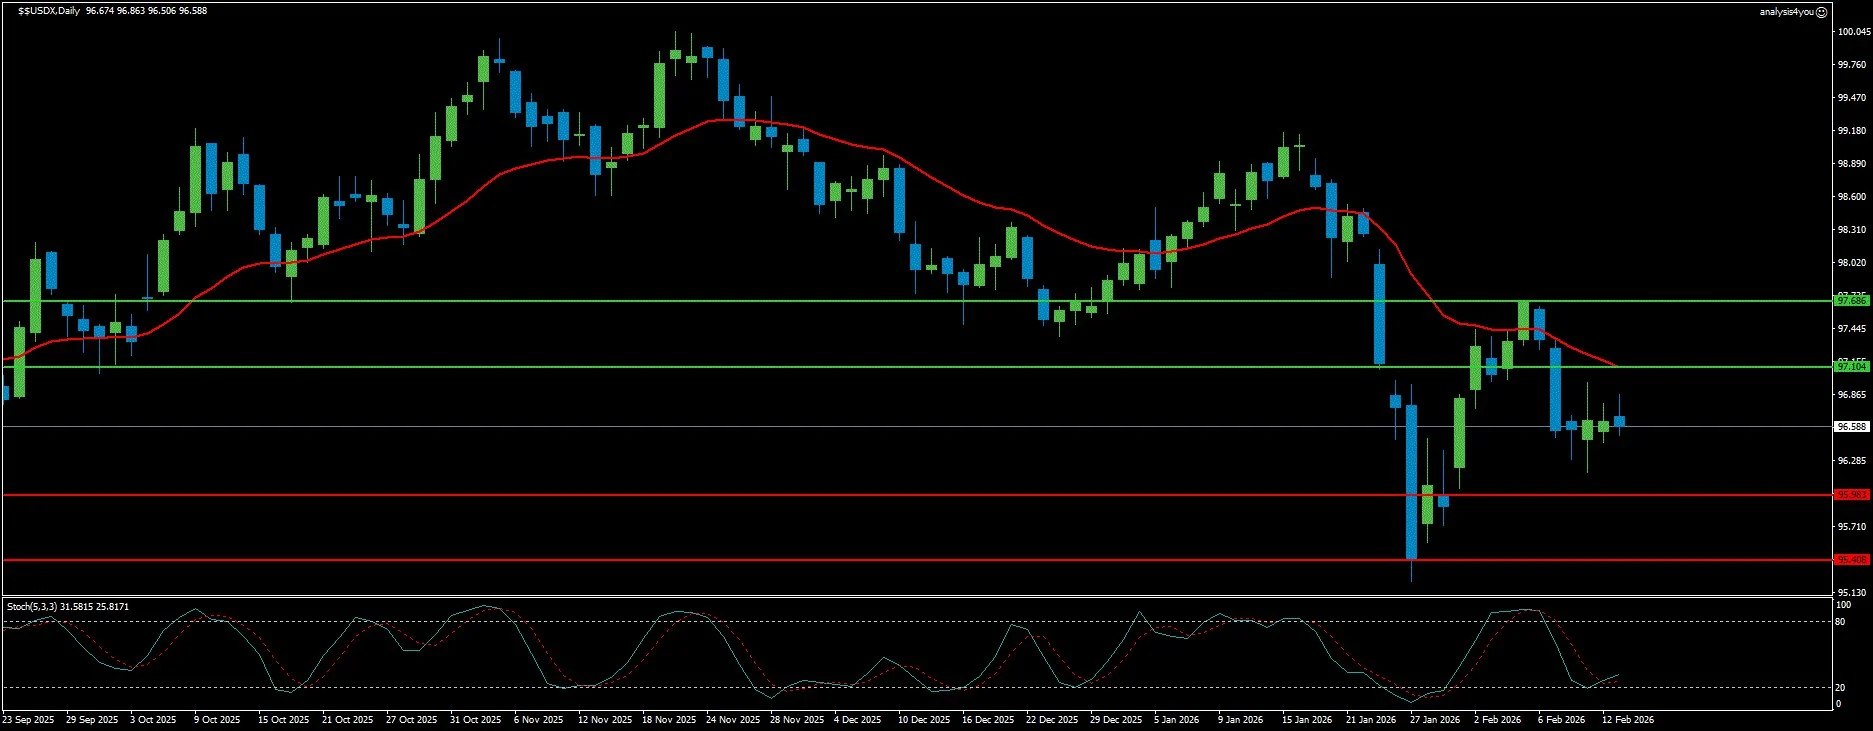
USD Index: “Big in Japan” Shock Overrides Strong Data (96.59)
Current Trend: Bearish Despite Fundamentals Market Sentiment: Confused/Negative
The Dollar Index cratered to 96.59 near two-week lows despite receiving what should have been powerfully supportive data. January NFP crushed expectations with 130K jobs added (nearly double the 70K consensus), unemployment ticking down to 4.3% from 4.4%, and hourly earnings holding steady at 3.7%—a Goldilocks print showing resilience without overheating. Then Friday delivered softer inflation with headline CPI falling to 2.4% YoY (from 2.7%, below 2.5% expected) and core CPI at 2.5%, with monthly readings of +0.2% headline and +0.3% core both meeting or beating expectations. This combination—strong labor market with easing inflation—historically sends the Dollar soaring. Instead, it collapsed. The reason: Japanese PM Takaichi’s Liberal Democratic Party landslide victory Sunday triggered forex intervention fears and a “Buy Japan” stampede that saw the Yen rally 2.8% for the week, its strongest advance since November 2024. Market participants shifted focus completely from Warsh Fed speculation to the implications of renewed Yen strength. Treasury yields accelerated declines to multi-month lows across maturities. CFTC data showed Dollar shorts trimmed to smallest since May 2025 (roughly 850 contracts) with open interest falling to 28.2K, suggesting position reduction rather than bullish conviction. Fed speakers remained divided: Stephen Miran pushing for “more than a full percentage point” of cuts annually, Lisa Cook more concerned about stalled inflation than labor weakness. Critical resistance at 97.10 must break to target 97.69 and relieve immediate downside pressure, while support at 95.98 provides near-term floor ahead of the psychologically important 95.41 level that would signal deeper structural damage.
Resistance: 97.10 | 97.69
Support: 95.98 | 95.41
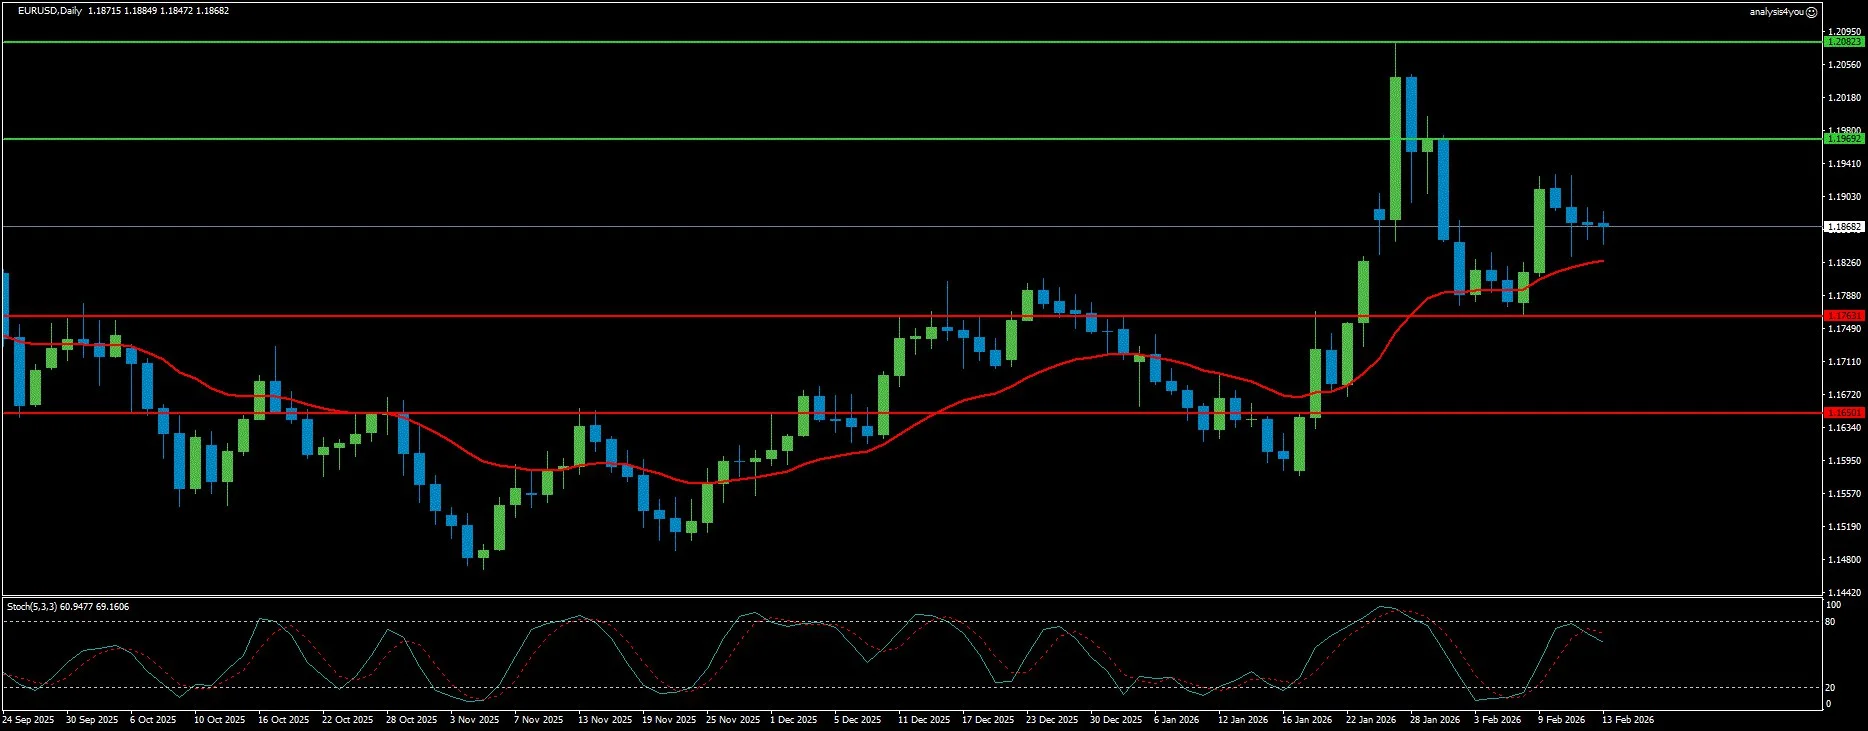
EUR/USD: Third Week Above 1.1800 Despite Dollar-Supportive Data (1.1868)
Current Trend: Range-Bound Bullish Market Sentiment: Neutral to Positive
EUR/USD closed at 1.1868, marking a third consecutive week above 1.1800 despite impressive US data that traditionally would crush the pair. The Euro remains fundamentally unattractive—Q4 GDP confirmed at 0.3% quarterly and 1.4% annualized with no surprises, and the ECB standing in its “good place” with no aims to modify monetary policy. What’s supporting the pair is Dollar weakness from the Japan shock and the perception that “the US economy is resilient and rates will eventually be lowered”—a combination that leaves the Greenback in “trend limbo.” The delayed NFP/CPI data (due to government shutdown) diminished relevance somewhat, but more importantly, the prints leave the door open for rate cuts even if no one anticipates Powell delivering before leaving in May. Markets are looking past Powell to June-July when Kevin Warsh takes over, with Trump choosing him specifically hoping he’ll take rates “well below” the current 3.50%-3.75% range. Analysts note: “If anything, what we learned is that the US economy is resilient and that rates will eventually be lowered. And that’s what counts for financial markets.” Resistance at 1.1969 must clear to challenge the key 1.2082 January multi-year high, while support at 1.1763 should hold on minor Dollar strength, with 1.1650 as stronger floor. The pair’s positioning near the upper end of its recent range suggests the path of least resistance remains toward 1.2000 unless US data dramatically shifts Fed expectations.
Resistance: 1.1969 | 1.2082
Support: 1.1763 | 1.1650
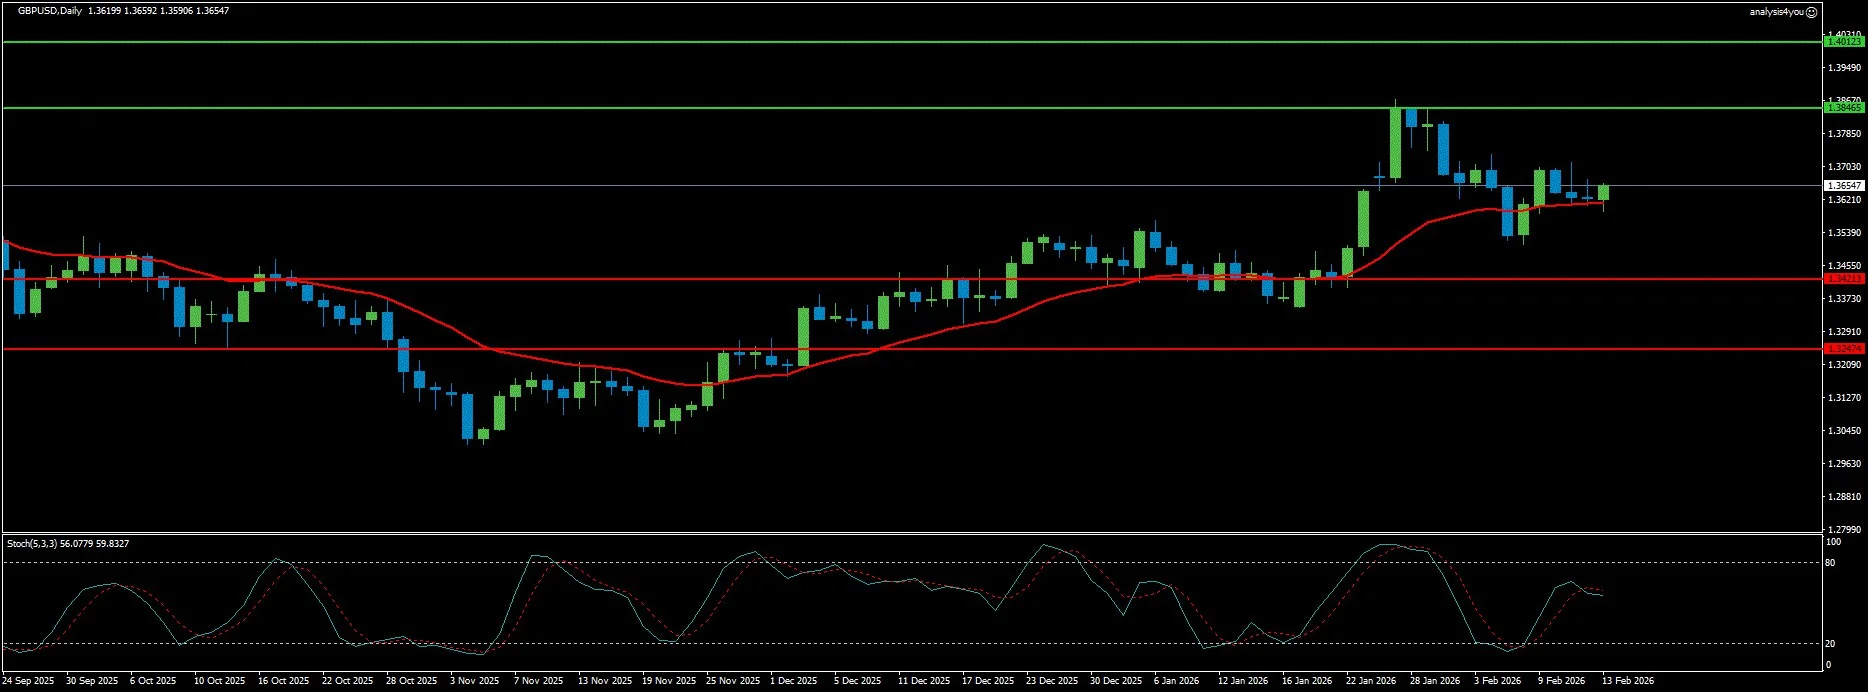
GBP/USD: Below 1.3700 Ahead of Wednesday CPI Crucial Test (1.3655)
Current Trend: Consolidating Bullish Market Sentiment: Mixed/Uncertain
GBP/USD settled at 1.3655 after facing rejection at 1.3700 but with buyers refusing to give up. Sterling showed resilience despite renewed USD/JPY weakness that outweighed the positive NFP surprise. UK Q4 GDP disappointed at just 0.1% growth (vs 0.2% expected), undermining Sterling alongside simmering political tensions—PM Keir Starmer’s position appeared shaky after Epstein files disclosures triggered criticism of Peter Mandelson’s US ambassador appointment, prompting senior resignations and speculation about political survival. The week ahead is critical: Tuesday brings UK employment data in a holiday-shortened week (US closed Monday for Presidents’ Day, China away for Lunar New Year), then Wednesday’s UK CPI could reaffirm expectations of a March BoE rate cut after the shocking dovish 5-4 vote split at February meeting (four members wanting immediate cuts). Expectations of “sharp drops in inflation in coming months” drive dovish sentiment, but if CPI comes in hotter it could scramble March cut odds and rescue Sterling. BoE Governor Bailey’s earlier Sunday appearance and Chief Economist Pill’s Friday fireside chat bracket the data releases. Resistance at 1.3846 blocks the path to 1.4012 and the July high near 1.3793, while immediate support at 1.3421 (61.8% Fibonacci) must hold to maintain bullish structure, with 1.3247 as deeper floor if dovish BoE signals intensify.
Resistance: 1.3846 | 1.4012
Support: 1.3421 | 1.3247
Stocks
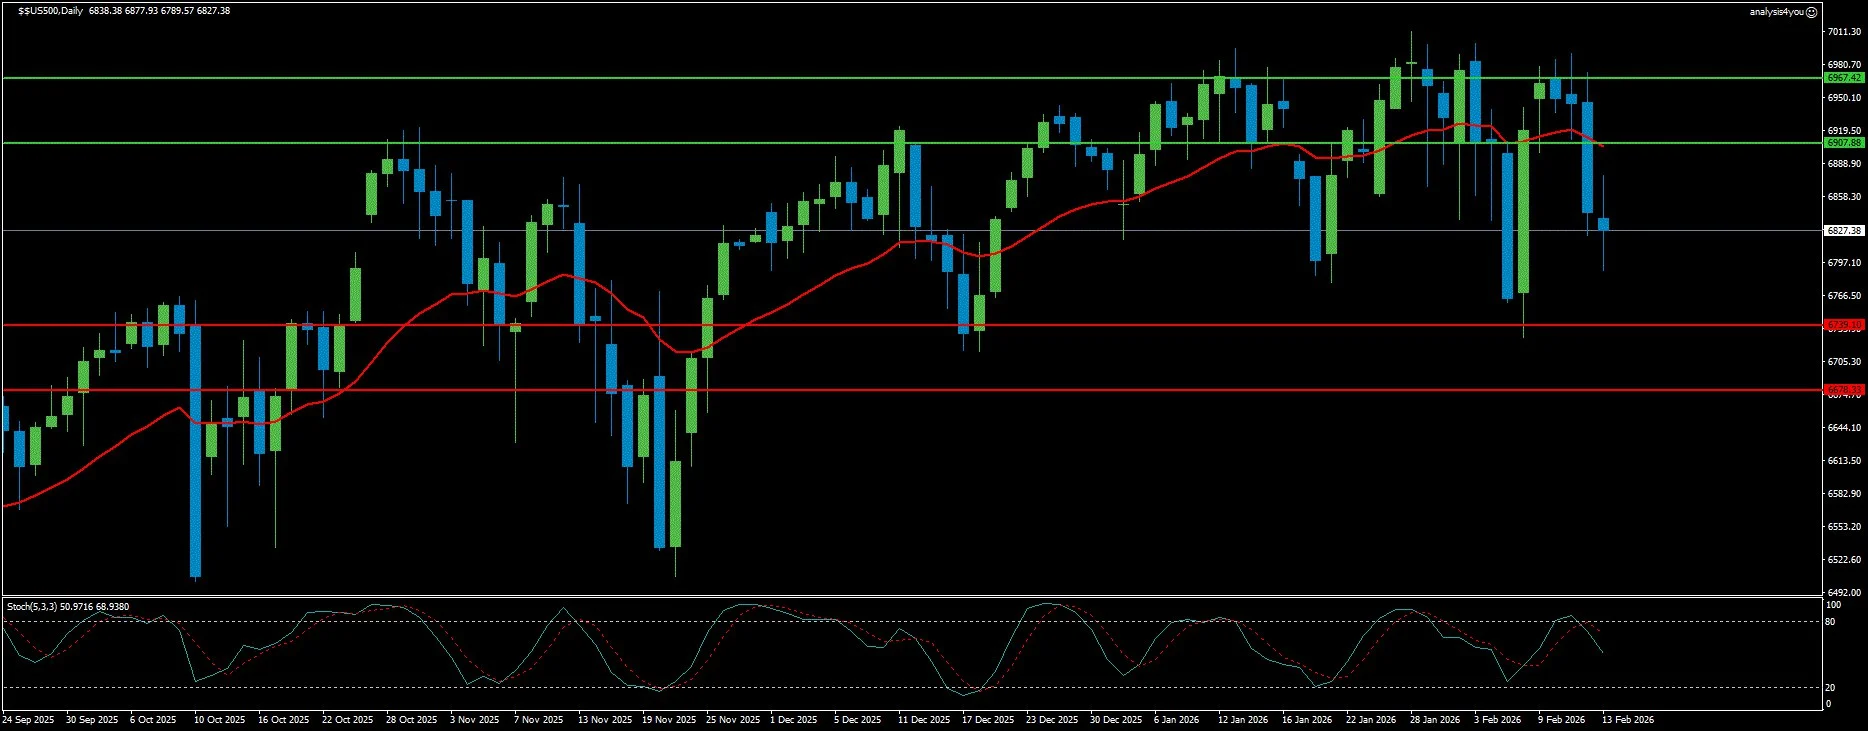
S&P 500: AI Shock Overwhelms Strong Macro Data (6,827)
Current Trend: Bearish Below Key Support Market Sentiment: Cautious/Vulnerable
The S&P 500 slumped to 6,827, breaking below the critical 6,850-6,900 support zone despite strong NFP (130K vs 70K expected) with unemployment falling to 4.3% that should have supported equities. The index remains trapped below resistance at 6,907, unable to reclaim the psychologically important 6,900 level, with stronger resistance at 6,967 capping any meaningful recovery attempts. The dominant narrative overwhelming positive macro data is the AI “doom loop”—mega-cap tech names perceived as disrupted rather than enabled by AI have suffered 20-40% drawdowns. Microsoft sliding 10-12% post-earnings, pullbacks in Alphabet, Amazon and Meta, and breaks of 50-day moving averages signal the trade has flipped from “buy any AI dip” to “sell first, think later.” The iShares Expanded Tech-Software ETF (IGV) rallied 2%+ Friday in relief bounce after brutal year-to-date losses, with Salesforce, Workday, ServiceNow, Moody’s and S&P Global posting 2-4% gains—but this looks like short-covering, not durable uptrend. Support at 6,739 provides immediate floor, with critical support at 6,678 representing make-or-break level—a decisive break below would expose deeper correction toward 6,600s and confirm the technical damage is more serious than temporary consolidation. The burden of proof sits with bulls to demonstrate sustainable breadth improvement and reclamation of the 6,900 level.
Resistance: 6,907 | 6,967
Support: 6,739 | 6,678
Commodities
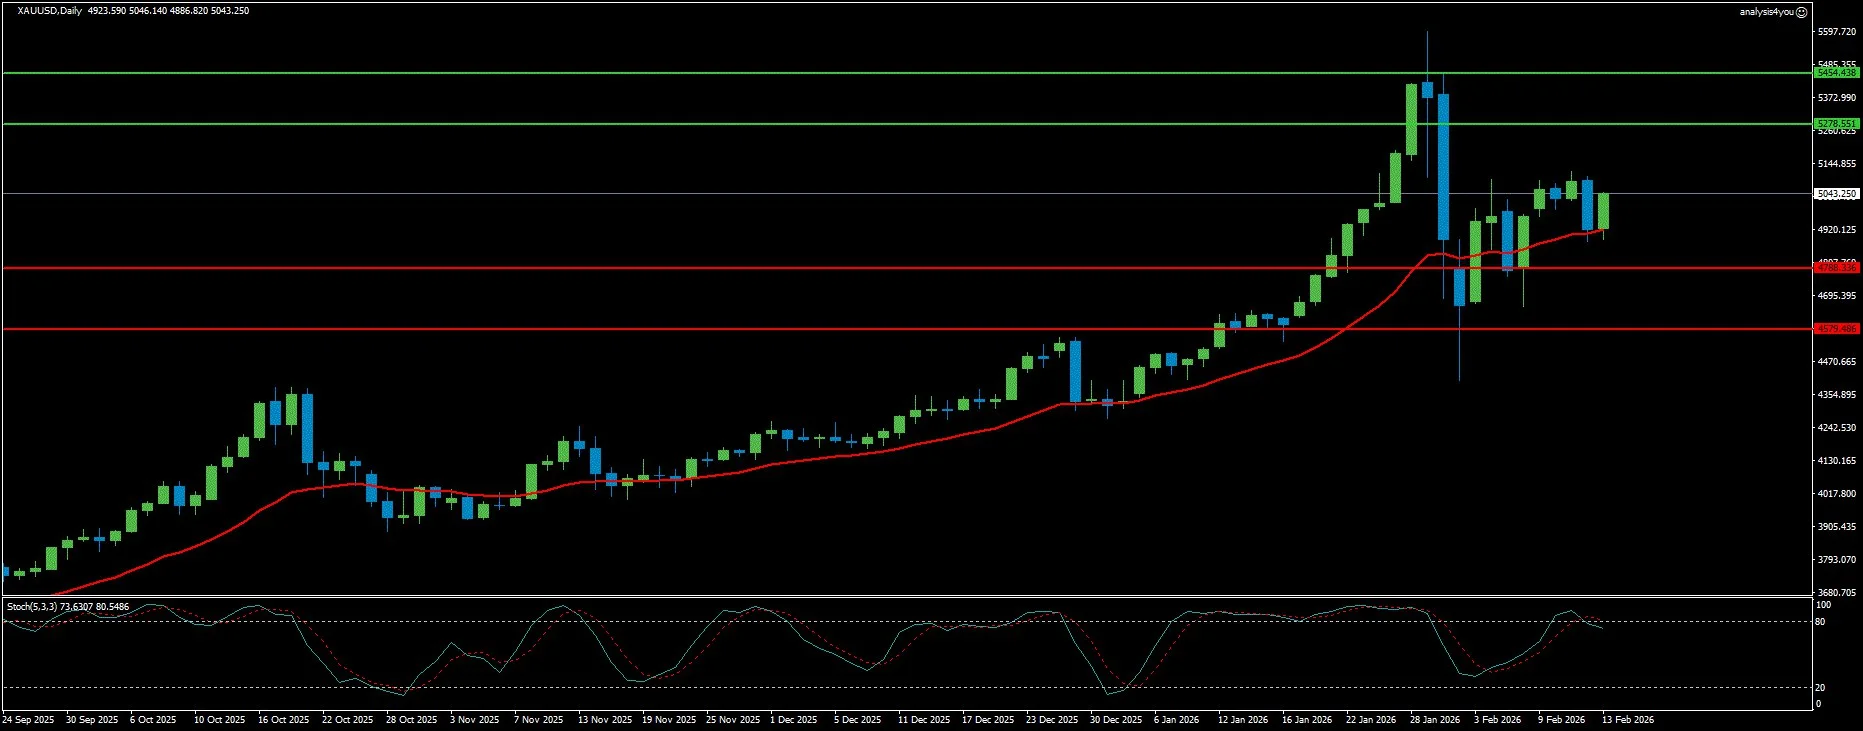
Gold: Thursday Flash-Crash Then Recovery Above $5,000 (5,043)
Current Trend: Violently Volatile (Bullish) Market Sentiment: Cautious After Shock
Gold recovered to 5,043 after experiencing one of the most violent weeks in years, starting bullish above $5,000 Monday (aided by Japanese election uncertainty and Chinese regulators verbally advising financial institutions to curb US Treasury holdings), then suffering Thursday’s chaos when the metal plunged more than 3% in hours during American trading as “concerns about AI spurred selloff across financial markets with algorithmic traders appearing to amplify the precious metal’s sudden drop,” per UOB analysts. Silver crashed over 11% Thursday, Copper fell 2%+ on LME. Friday brought recovery as softer CPI (2.4% vs 2.5%) made it difficult for USD to preserve strength, allowing Gold to retrace portion of Thursday’s slump and close above the psychological $5,000 level. CME’s repeated margin hikes on Gold/Silver futures amid heightened volatility ironically helped prices rebound Friday as forced selling eased. Resistance at 5,278 represents the first significant barrier, with extended target at 5,454 if momentum resumes toward the prior $5,600 spike high territory. Support at 4,788 should hold barring major geopolitical de-escalation or hawkish US data surprises, with critical support at 4,579 representing the floor that must hold to keep the structural bull trend intact. The precious metal remains sensitive to tech-driven market volatility with strengthening positive correlation to Nasdaq—bullish equity action helps Gold, while tech selloffs trigger commodity liquidations.
Resistance: 5,278 | 5,454
Support: 4,788 | 4,579
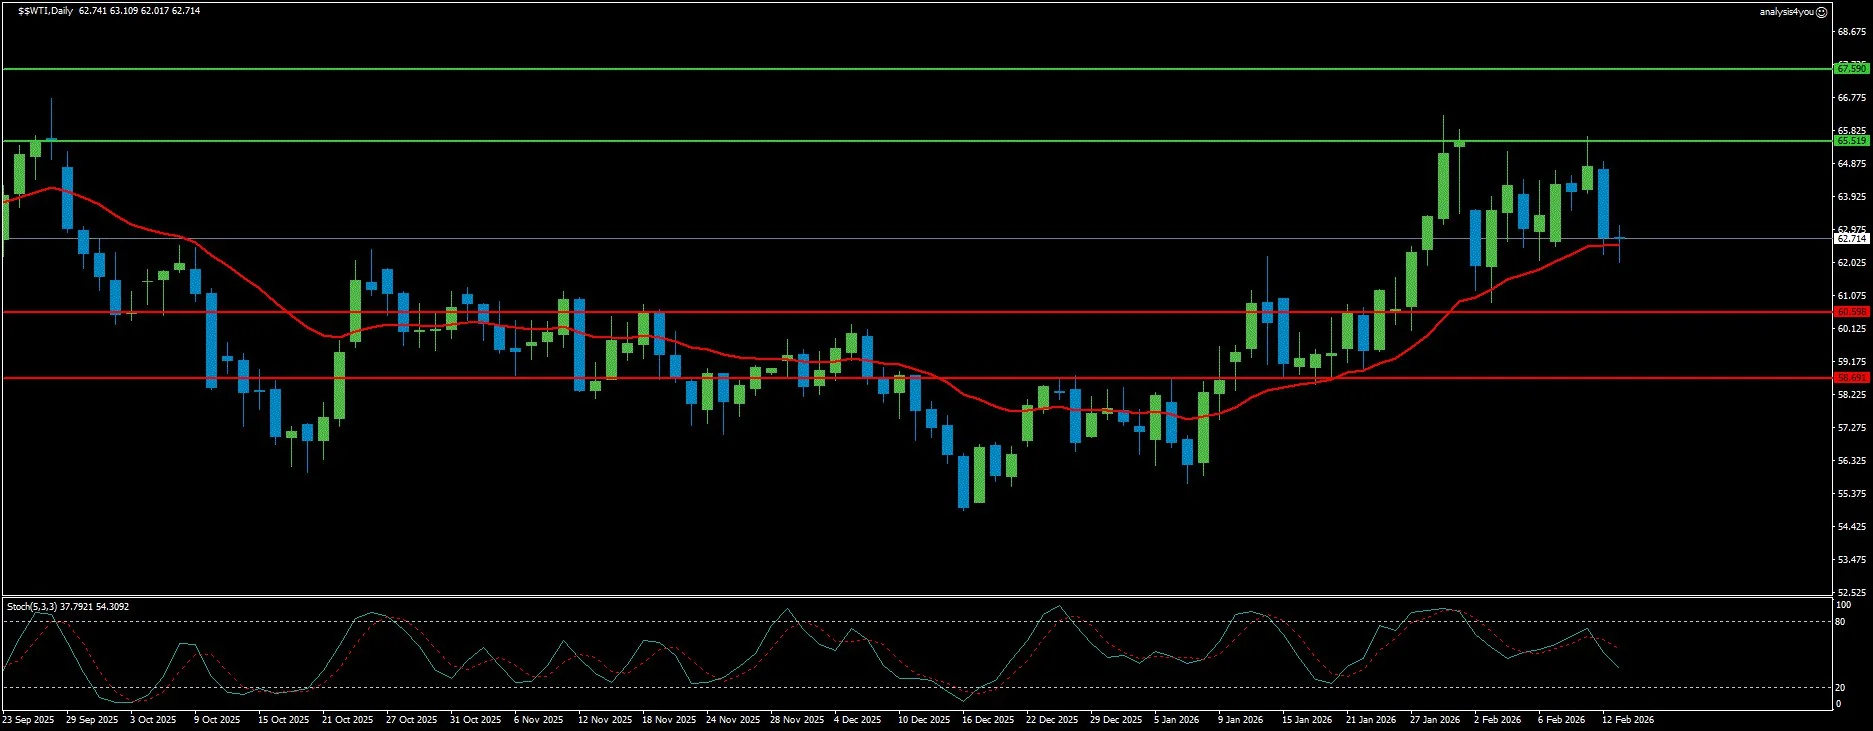
WTI Crude Oil: Oversupply Narrative Dominates Despite Iran Risks (62.71)
Current Trend: Bearish Bias Market Sentiment: Weak Fundamentals
WTI crude slipped to 62.71, reflecting profound structural weakness despite maintaining a geopolitical premium. Recent US inventory data showed crude stocks rising 8.5M barrels in single week to ~429M barrels—a build significantly above consensus. Combined with IEA’s projection of 3.7M bpd global surplus in 2026 (nearly 4% of total consumption), the oversupply signal is unmistakable. OPEC+ sits on meaningful spare capacity and openly discusses additional barrels from April—internal data shows demand for OPEC crude easing in Q2, creating small surplus even before additional hikes. Venezuela sanctions relief has opened door for Chevron, BP, Eni, Shell and Repsol to scale activity, meaning gradual return of Venezuelan medium-sour crude into Atlantic Basin. Add rising non-OPEC supply from US, Brazil and Guyana, and the IEA’s oversupply story reinforces bearish bias. The $5-7/barrel geopolitical premium (Russia infrastructure attacks, Iran tensions, shipping disruptions) provides floor but fundamentals overwhelm it. OPEC+ March 1 meeting looms as critical—any decision to resume output increases from April is structurally bearish unless deep cuts appear elsewhere. Resistance at 65.52 represents immediate ceiling where previous rebounds stalled, with stronger resistance at 67.59 capping any rally attempts. Support at 60.60 provides near-term floor, with critical support at 58.69 representing the level where emergency OPEC+ action might finally be triggered. Softer US inflation (gasoline prices fell 3%+ MoM) reflects adequate supply, not surging demand.
Resistance: 65.52 | 67.59
Support: 60.60 | 58.69
Crypto
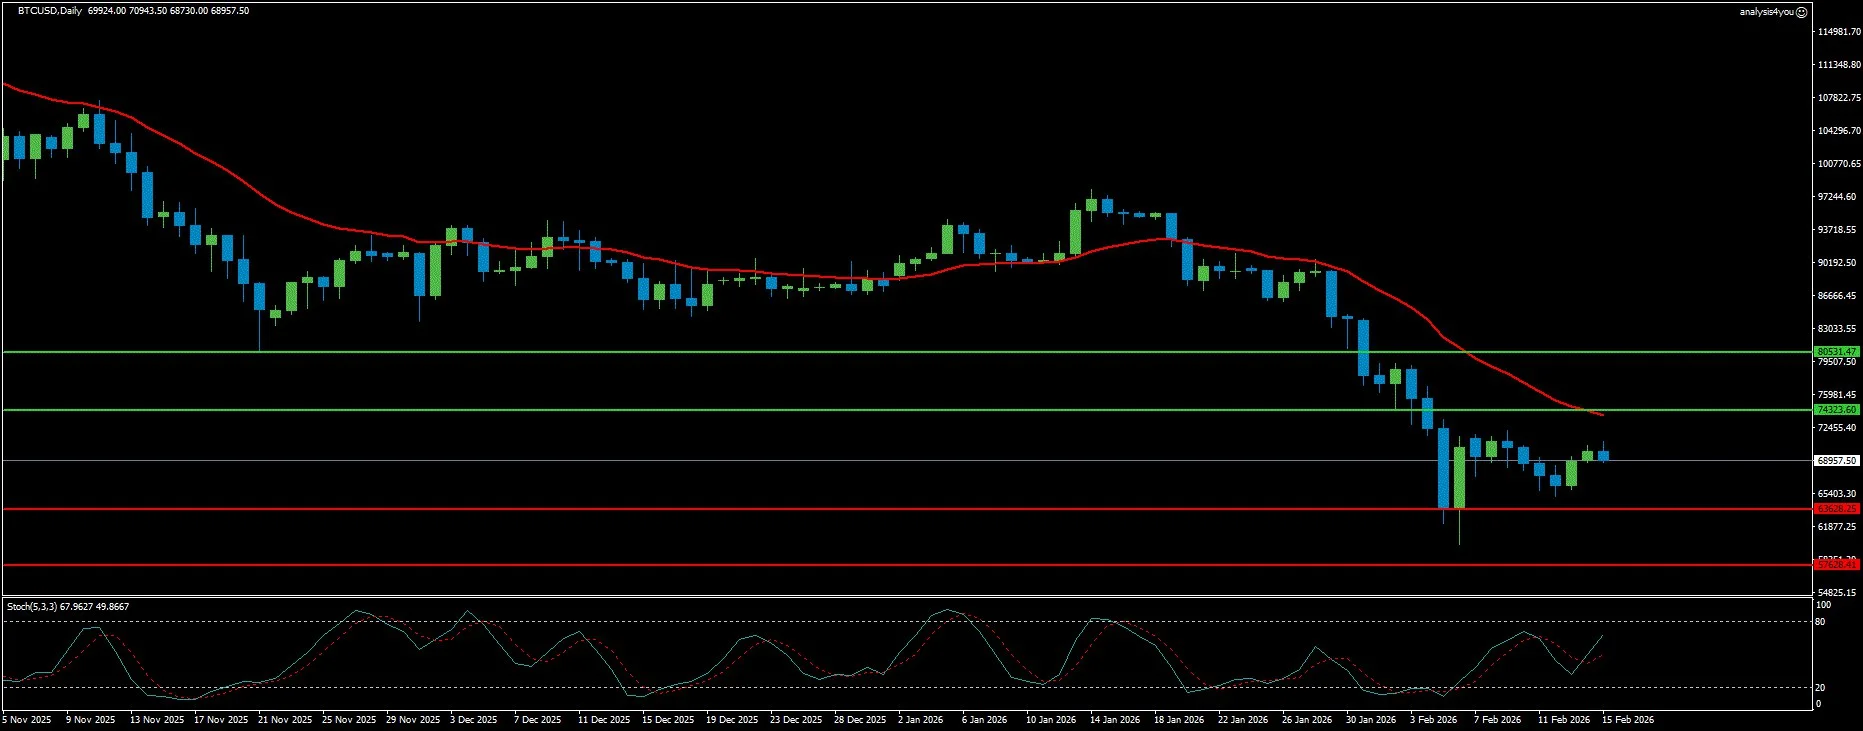
Bitcoin: Fourth Consecutive Weekly Outflow, $55K Bottom Warning (68,957)
Current Trend: Bearish (Incomplete Capitulation) Market Sentiment: Extremely Negative
Bitcoin dropped to 68,957, extending losses amid fourth consecutive weekly ETF outflow ($375M through Thursday). The Crypto King faces profound institutional abandonment—spot Bitcoin ETFs recorded $375.11M withdrawals pointing to fourth straight weekly outflow since January 23. Strategy purchased just 1,142 BTC Monday (bringing total to 714,644 BTC at average price $76,056), a drastically reduced pace reflecting market weakness. Critically, CryptoQuant’s Thursday report warned that “large daily realized losses do not yet imply a structural bottom.” Bitcoin holders realized largest daily losses since March 30, 2023—net realized losses hit $5.4B on February 5 when BTC fell from $73,341 to $62,909 (14% single-day drop), exceeding the $4.3B recorded after FTX collapse November 2022. However, monthly cumulative realized losses in Bitcoin terms remain much lower than bear market bottom levels—just 0.3M BTC versus 1.1M BTC at end of 2022 bear market. The Market Value to Realized Value (MVRV) ratio remains outside the extreme undervalued area where historical bottoms formed. CryptoQuant analyst predicts “Bitcoin’s ultimate bear market bottom is around $55K today,” noting realized price bands currently sit 18% below current prices. In previous bears, BTC crossed below realized price by 24% (November 2022 FTX) and 30% (December 2018). Resistance at 74,323 must be decisively cleared to alleviate immediate bearish pressure, with stronger resistance at 80,531 required to confirm trend reversal. Critical support at 63,628 is make-or-break—a breach would expose the psychologically important 57,628 level aligned with CryptoQuant’s $55K ultimate bottom prediction. Strong NFP removed recession fears but kept Fed patient (limiting crypto-bullish dovish pivot hopes), while softer CPI provided mild long-term support by affirming two 2026 cuts remain possible.
Resistance: 74,323 | 80,531
Support: 63,628 | 57,628
Key Events This Week (February 16-21, 2026)
Holiday-Shortened Week
- Monday: US Markets Closed (Presidents’ Day)
- Monday-Friday: Chinese Markets Closed (Lunar New Year)
- Thin trading conditions likely, potentially exaggerating moves in GBP/USD and other pairs
Critical UK Data Week
- Tuesday: UK Employment Data (three months to November) – Critical for BoE March cut expectations
- Wednesday: UK CPI (January) – Main event, could reaffirm March BoE rate cut expectations
- Wednesday: US Durable Goods Orders (December), US Housing Starts
- Wednesday: Fed Minutes (January Meeting) – Clarity on policy hold reasoning and March cut openness
Major Data Friday
- Friday: US Q4 GDP (Advance Estimate) – Consensus 3.7% (vs Q3’s 4.4%)
- Friday: US Core PCE Price Index (December) – Fed’s preferred inflation gauge
- Friday: Global February Flash PMIs (S&P Global/local banks) – Manufacturing, Services, Composite for major economies
- Friday: BoE Chief Economist Huw Pill fireside chat in London
Geopolitical & Corporate
- Week: Second round US-Iran talks expected as negotiations intensify over nuclear weapons program curbing
- Week: Fed and BoE officials speeches throughout
- Wednesday February 19: Triple earnings threat— Walmart (pre-market, retail tech at 44x P/E), Newmont (after-market, gold leverage near $5K/oz), Deere (pre-market, farm equipment cycle)
Week Ahead Outlook
Wednesday’s Fed Minutes represent the week’s critical transparency event after the January hold decision. Markets need clarity on how close policymakers really are to delivering the two rate cuts futures still price for 2026, and whether any commentary hints at what could trigger the next move. With March cuts priced below 10% probability, the Minutes could either reinforce patience or crack open the door if officials expressed more concern about labor market fragility than the statement suggested.
Friday’s data dump delivers the real macro punch: Q4 GDP advance estimate (consensus 3.7%), core PCE deflator (Fed’s anchor inflation gauge), and flash February PMIs globally. Commerzbank expects US growth momentum to persist in Q4 similar to Q2 (3.8%) and Q3 (4.4%), forecasting 3.7% driven by private consumption, non-residential investment, and improved trade balance. A Q4 GDP reading between 3%-4% or better could allow Dollar to test 97.10 resistance despite Japan headwinds, while significant miss below 3% would pressure USD toward 95.98 support and help EUR/USD challenge 1.1969. Core PCE holds equal importance—any uptick would support Warsh hawk narrative and help Dollar reclaim 97.10-97.69 resistance zone, while further cooling would reinforce June-July cut expectations and pressure Greenback toward 95.98-95.41 support.
The Dollar’s position at 96.59 reflects the “Japan shock” overwhelming fundamentally supportive US data. Critical resistance at 97.10 must break to signal the worst is over, with 97.69 required to confirm sustainable recovery. Conversely, support at 95.98 provides immediate floor, but a break toward 95.41 would signal the Japanese intervention fears and “Buy Japan” stampede have triggered deeper structural damage. The CFTC data showing trimmed Dollar shorts (850 contracts, smallest since May 2025) with falling open interest (28.2K) suggests the market has reduced bearish bets but isn’t aggressively flipping bullish—positioning is lighter, not reversed.
EUR/USD at 1.1868 sits tantalizingly close to 1.1969 resistance, with momentum potentially carrying it toward the critical 1.2082 January multi-year high. The pair’s third consecutive week above 1.1800 despite Dollar-supportive data demonstrates the “rates will eventually be lowered” narrative trumps near-term data beats. Support at 1.1763 should hold on minor Dollar strength, with 1.1650 as stronger floor. The path of least resistance remains toward 1.2000 and the psychologically important 1.2082 level unless Friday’s data dramatically shifts Fed expectations.
GBP/USD at 1.3655 faces its most critical week in months. Wednesday’s UK CPI is the main event after the shocking dovish 5-4 BoE vote split (four members wanting immediate cuts). Expectations of “sharp drops in inflation in coming months” drive dovish sentiment, creating substantial downside risk toward 1.3421 support if CPI confirms these forecasts. However, any upside CPI surprise could scramble March cut odds and propel Cable toward 1.3846 resistance and potentially 1.4012. The Golden Cross remains intact, suggesting the medium-term bias favors bulls, but near-term price action hinges entirely on Wednesday’s inflation print.
The S&P 500’s position at 6,827 below the critical 6,850-6,900 support zone signals technical damage despite strong macro fundamentals. Resistance at 6,907 must be reclaimed to alleviate immediate pressure, with 6,967 required to confirm the correction is ending. Support at 6,739 provides near-term floor, but critical support at 6,678 represents make-or-break—a decisive break would expose the 6,600s and confirm the AI-driven software carnage is causing broader structural damage rather than sector-specific rotation. The burden of proof sits with bulls to demonstrate breadth improvement and reclaim 6,900+ levels.
Gold’s recovery to 5,043 after Thursday’s flash-crash demonstrates the resilience of the structural bull trend. Resistance at 5,278 represents first significant barrier, with 5,454 as extended target if momentum resumes. Support at 4,788 should hold given dovish BoE/ECB, US data uncertainty, Iran tensions, and the cross-asset signals of capital hedging policy error. The violent Thursday selloff (Gold -3%+, Silver -11%) cleared weak hands and set up healthier technical base. As long as Gold holds above 4,788, the tactical bias favors buying dips, with critical support at 4,579 as the ultimate floor protecting the bull trend.
Bitcoin’s position at 68,957 with fourth consecutive weekly ETF outflow and CryptoQuant’s $55K ultimate bottom warning creates severe risk. Critical support at 63,628 is make-or-break—a breach would expose 57,628 aligned with the predicted $55K structural bottom and potentially trigger capitulation. The realized loss data ($5.4B exceeding FTX levels) combined with monthly cumulative losses still far below 2022 bear market bottoms (0.3M BTC vs 1.1M BTC) and MVRV outside extreme undervalued zone all indicate incomplete capitulation. Strategy’s drastically reduced buying (just 1,142 BTC vs prior 10K+ weekly purchases) signals even the most aggressive accumulator is cautious. Resistance at 74,323 must clear decisively to alleviate pressure, with 80,531 required for trend reversal confirmation.
WTI crude at 62.71 reflects overwhelming fundamental weakness: 8.5M barrel weekly inventory build, IEA’s 3.7M bpd 2026 surplus forecast, OPEC+ discussing April output increases, Venezuela re-entering, and non-OPEC growth. Resistance at 65.52 caps rally attempts where previous rebounds stalled, with 67.59 as stronger ceiling. Support at 60.60 provides floor, with critical support at 58.69 potentially triggering emergency OPEC+ response if breached. The March 1 OPEC+ meeting is critical—any April output increase decision would be structurally bearish and target the 60.60-58.69 support zone.
Risk management is paramount in this holiday-shortened, data-heavy week with thin Chinese/US participation. The combination of Fed Minutes Wednesday, critical UK CPI Wednesday, triple major earnings Wednesday (Walmart/Newmont/Deere), and Friday’s GDP/PCE/PMI data dump creates multiple flashpoints for outsized moves.

