Iran War Drums Louder: Markets Coil Amid Geopolitical Storm

Market Sentiment Overview
Markets entered the final week of February facing an unprecedented confluence of risks—escalating US-Iran military tensions (with Trump’s two-week ultimatum expiring and carrier strike groups positioned), the Supreme Court’s stunning rejection of Trump’s tariff authority (prompting immediate plans for new 15% global levies), and the S&P 500 exhibiting its tightest weekly Bollinger Bands since 2019 signaling an imminent 5-10% breakout in either direction. The Dollar retreated to 97.46 following Friday’s SCOTUS ruling despite hawkish FOMC Minutes and stagflationary Q4 data (1.4% GDP miss vs 3% expected, core PCE accelerating to 3% from 2.8%). EUR/USD recovered to 1.1782 after testing four-week lows at 1.1742, while GBP/USD stabilized at 1.3480 holding the critical 200-day SMA despite BoE rate cut expectations for March. Gold surged to 5,108 as CBS News reported US military prepared for Iran strikes “as soon as Saturday,” while WTI crude rallied to 66.35 on Strait of Hormuz closure fears. Bitcoin languished at 67,208 on fifth consecutive weekly ETF outflow ($404M), with concerns mounting over Tether’s shrinking 3.3% equity cushion. The S&P 500 slumped to 6,909, trapped in range-bound paralysis as defensive sectors (consumer staples, utilities) leading near all-time highs flashed classic pre-correction warning signals seen in 63% of historical instances. The week ahead features Thursday’s ECB rate decision (25bps cut expected), Friday’s US PPI, and continuous geopolitical headline risk as Iran nuclear negotiations remain deadlocked.
Currencies
USD Index: Supreme Court Shock Overwhelms Hawkish Fed (97.46)
Current Trend: Bearish Despite Fundamentals
Market Sentiment:Confused/Negative
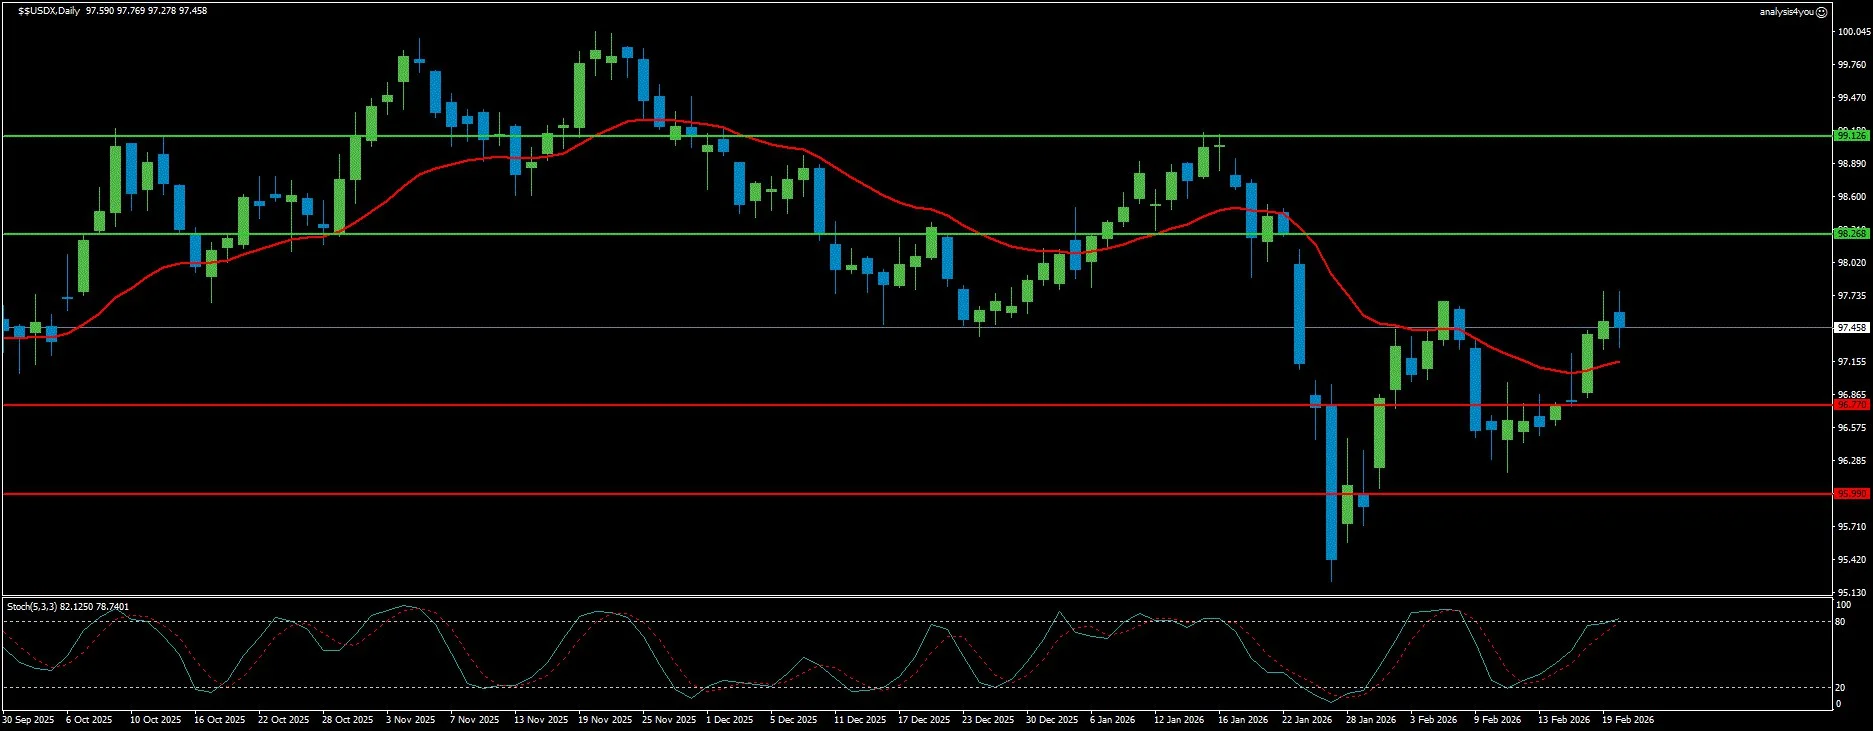
The Dollar Index collapsed to 97.46 following Friday’s Supreme Court ruling that Trump overstepped his constitutional authority by imposing across-the-board tariffs on trading partners—a decision the White House immediately appealed while announcing plans for new 15% global tariff rate to circumvent the ruling. This legal shock overwhelmed what should have been powerfully supportive fundamentals: hawkish FOMC Minutes revealing “several policymakers noted they would have supported describing future decisions in more two-sided terms” (opening door to rate hikes), combined with the worst-case scenario for rate cuts—Q4 GDP disappointed at just 1.4% (vs 3% expected) while core PCE inflation accelerated to 3% from 2.8%, signaling stagflation. CFTC data shows Dollar positioning remains light with shorts trimmed to multi-month lows but no aggressive bullish flip, suggesting the market reduced bearish bets without conviction. Fed speakers remain divided: dovish voices like Goolsbee leaving door open for cuts if inflation cooperates, while hawkish camp warns sticky prices and labor market uncertainty argue for prolonged patience. Markets price virtually zero chance of March cuts and only 80% probability for April. Immediate resistance at 98.27 must break to signal worst is over, with 99.13 required to confirm sustainable recovery. Support at 96.77 provides near-term floor, but break toward 95.99 would signal the tariff ruling has triggered deeper structural damage and potentially target the psychologically critical 95.41 level that marked recent lows.
Resistance: 98.27 | 99.13
Support: 96.77 | 95.99
EUR/USD: Recovery from Four-Week Lows Amid ECB Cut Expectations (1.1782)
Current Trend: Consolidative
Market Sentiment: Cautious
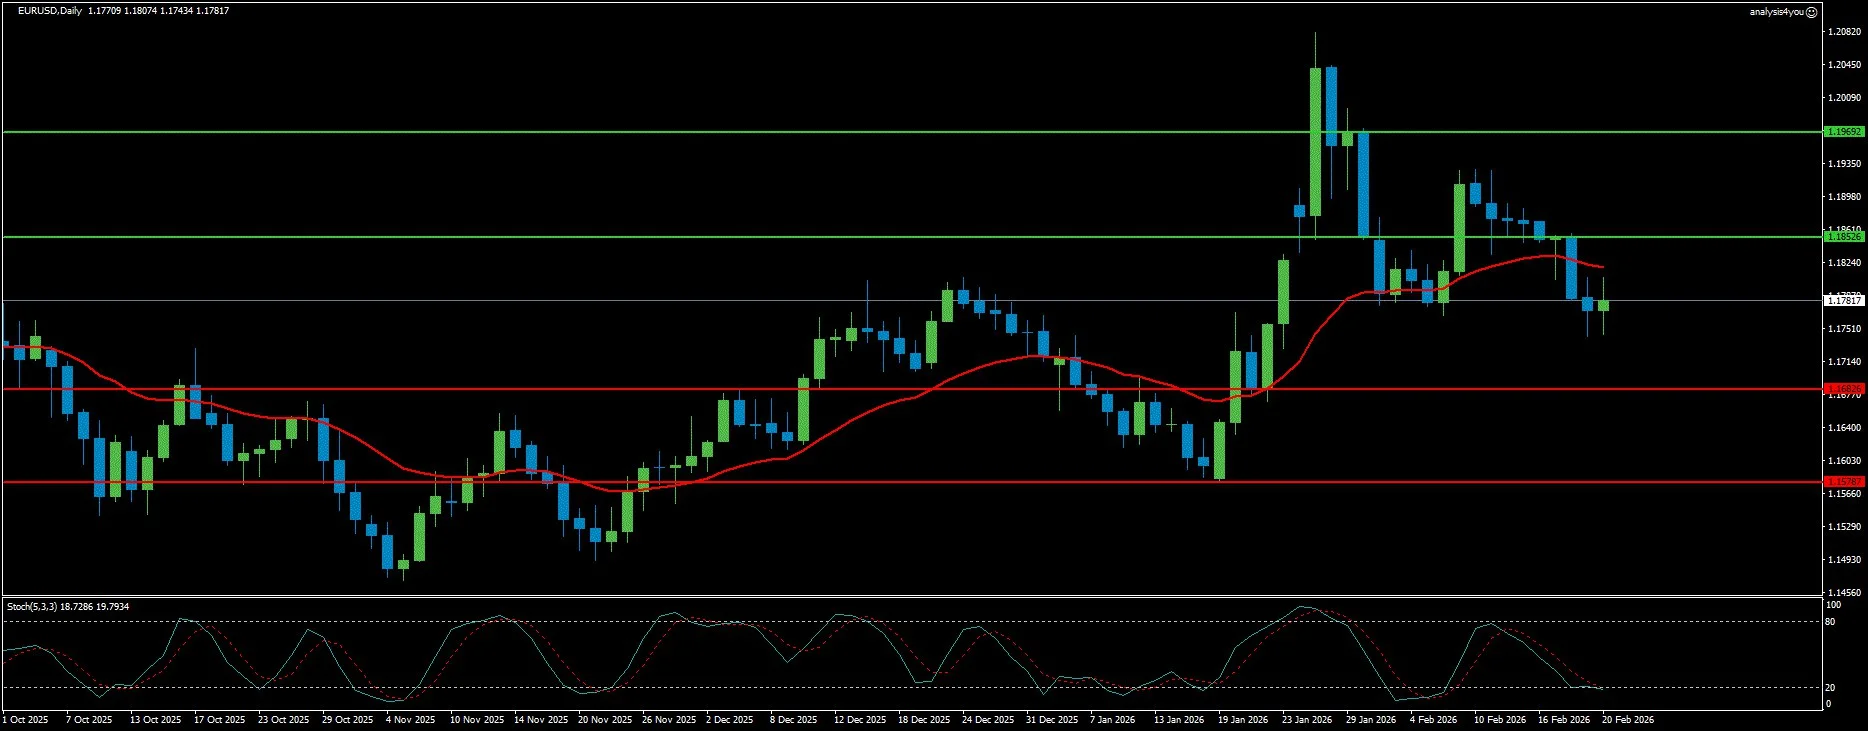
EUR/USD recovered to 1.1782 after testing four-week lows at 1.1742 mid-week, as Dollar weakness following the Supreme Court tariff ruling provided relief from earlier hawkish FOMC Minutes pressure. The pair’s positioning reflects policy divergence expectations—Thursday’s ECB decision is widely expected to deliver 25bps cut to 2.25% (potentially the last of 2026), while the Fed’s hawkish Minutes suggested no imminent easing despite disappointing GDP. European PMI data provided modest encouragement with manufacturing index improving to 50.8 from 49.5 (crossing back into expansion territory for first time in months), while Composite PMI edged to 51.9. However, German ZEW Economic Sentiment disappointed, contracting to 58.3 versus expectations of improvement, and Eurozone sentiment at 39.4 missed forecasts. The fundamental picture remains mixed: Eurozone confirmed Q4 GDP at 0.3% quarterly with no surprises, leaving the Euro fundamentally unattractive relative to resilient US data. What’s supporting the pair is broad Dollar weakness from the tariff ruling shock and the perception that “rates will eventually be lowered” under incoming Fed Chair Kevin Warsh (Trump chose him specifically hoping he’ll take rates “well below” current 3.50%-3.75% range). Resistance at 1.1853 needs clearing to target 1.1969 and potentially challenge the critical 1.2082 January multi-year high. Support at 1.1683 should hold on minor Dollar strength, with 1.1579 as stronger floor—a break below would signal renewed bearish momentum and target the 1.1500 psychological level.
Resistance: 1.1853 | 1.1969
Support: 1.1683 | 1.1579
GBP/USD: Holding 200-Day SMA Ahead of BoE Rate Cut Cycle (1.3480)
Current Trend: Consolidative (Vulnerable)
Market Sentiment: Cautious
The Pound stabilized at 1.3480, successfully defending the critical 200-day SMA after crashing to month-lows near 1.3445 and breaking below the 61.8% Fibonacci retracement at 1.3545. UK economic data painted the mixed picture that endorsed market expectations for BoE rate cut in March: unemployment rate hit near five-year high of 5.2%, wage growth decelerated to 4.2% from 4.4%, and CPI inflation cooled to 3% in January from 3.4% (meeting expectations). However, retail sales surged an impressive 1.8% monthly (vs 0.2% expected), marking the largest jump since May 2024 and providing temporary support. S&P Global UK Composite PMI rose to 53.9 in February preliminary from 53.7 in January (highest since April 2024), suggesting economic resilience despite inflation cooling. The critical question is whether the BoE will follow through with March cut after the shocking dovish 5-4 vote split at February meeting (four members wanting immediate cuts). BoE Chief Economist Huw Pill’s comments suggest rate cuts may proceed at quarterly pace rather than accelerated, providing modest Sterling support. Political tensions simmer with PM Keir Starmer’s position appearing shaky. Immediate resistance at 1.3587 needs to be overcome to target 1.3693 and the July high near 1.3793. Support at 1.3354 aligns with recent lows and must hold to maintain bullish structure, with stronger support at 1.3247 as deeper floor if dovish BoE signals intensify. RSI at 42 signals fading momentum, creating vulnerability to downside breaks if data disappoints or BoE turns more dovish.
Resistance: 1.3587 | 1.3693
Support: 1.3354 | 1.3247

Stocks
S&P 500: Tightest Bollinger Bands Since 2019, Defensive Rotation Warning (6,909)
Current Trend: Range-Bound (Coiled for Major Move)
Market Sentiment: Neutral but Tense
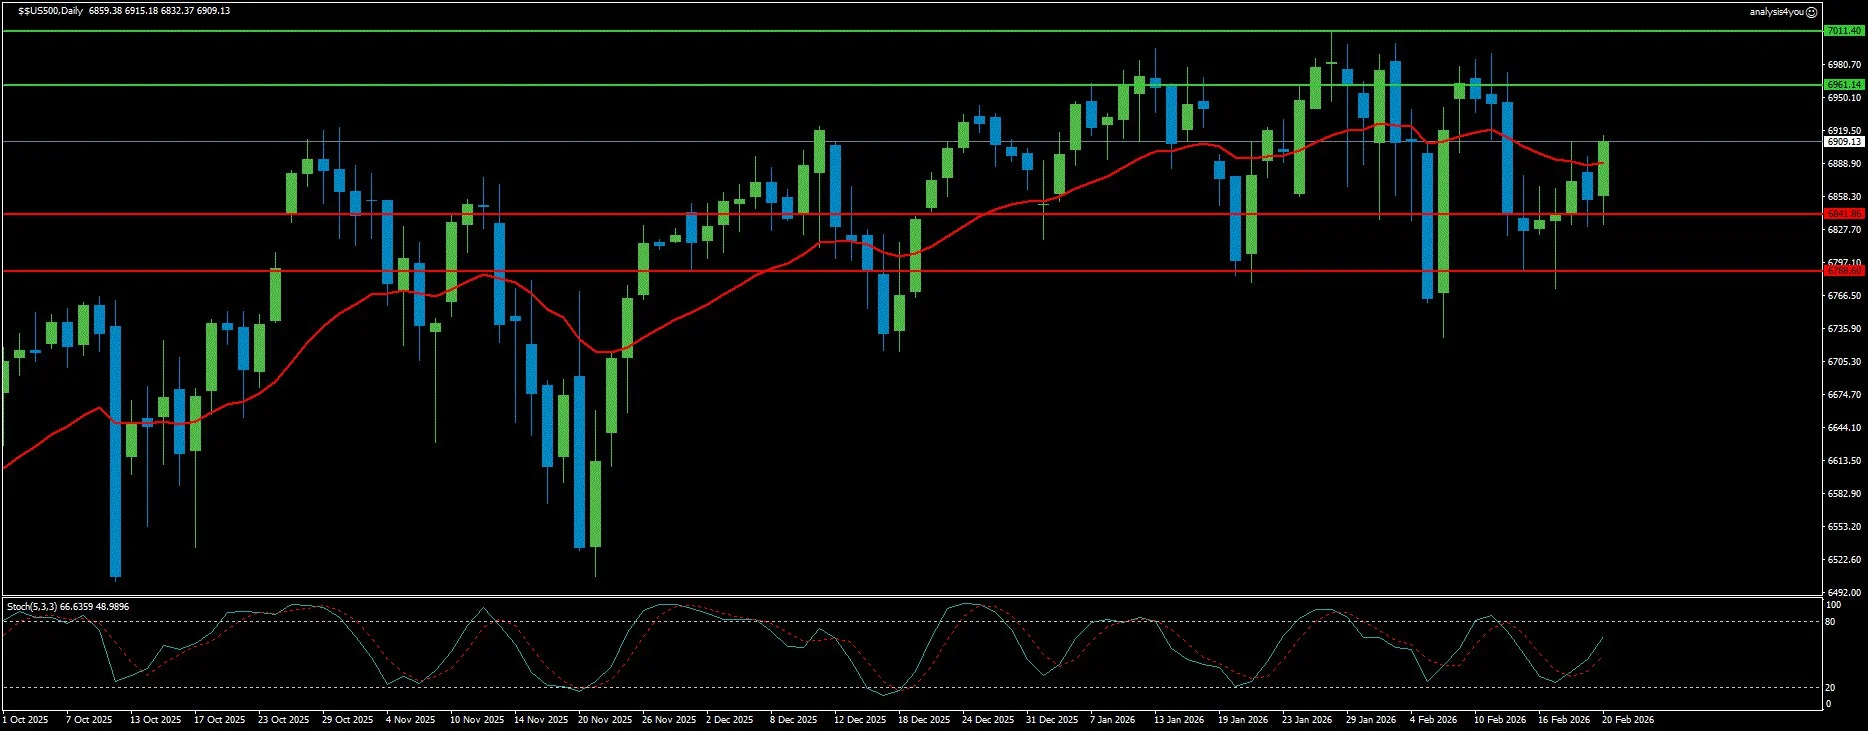
The S&P 500 trades at 6,909, stuck in an extraordinarily narrow range with the tightest weekly Bollinger Bands compression since 2019—a technical setup that historically precedes significant 5-10% moves within weeks, though direction remains unclear. BTIG technical strategist Jonathan Krinsky warns the index “appears coiled for a significant move” while maintaining upside bias based on broader bullish trend and markets rarely repeating same decline pattern in consecutive years. However, the market faces an alarming divergence that’s flashing classic pre-correction warnings: while the index hovers near all-time highs, defensive sectors (consumer staples, utilities, energy, materials) are dramatically outperforming technology—a leadership pattern that has preceded 10%+ corrections in 63% of historical instances. Currently, 63% of S&P 500 stocks are outperforming the index, the highest participation rate since 2001. When consumer staples and utilities lead while markets sit near highs, corrections have typically followed within weeks. The Russell 2000 small-cap index outperformed large caps for 14 straight sessions (longest streak since 1996) before ending, suggesting potential market rotation but also heightened fragility. The Shiller CAPE ratio above 40 matches levels seen only during the dot-com bubble peak in 2000, raising serious valuation concerns. Resistance at 6,961 represents immediate hurdle that must clear to target 7,011 and the psychologically important 7,000 milestone. Support at 6,842 provides floor, with critical support at 6,789 representing make-or-break level—a decisive break below would expose deeper correction toward mid-6,600s and confirm the defensive sector rotation signals genuine trouble rather than healthy broadening. The burden of proof sits with bulls to demonstrate sustainable breadth improvement and reclamation of 6,900+ levels.
Resistance: 6,961 | 7,011
Support: 6,842 | 6,789
Commodities
Gold: Soars Above $5,100 as Iran War Premium Intensifies (5,108)
Current Trend: Strongly Bullish
Market Sentiment: Extremely Positive (War Fears)
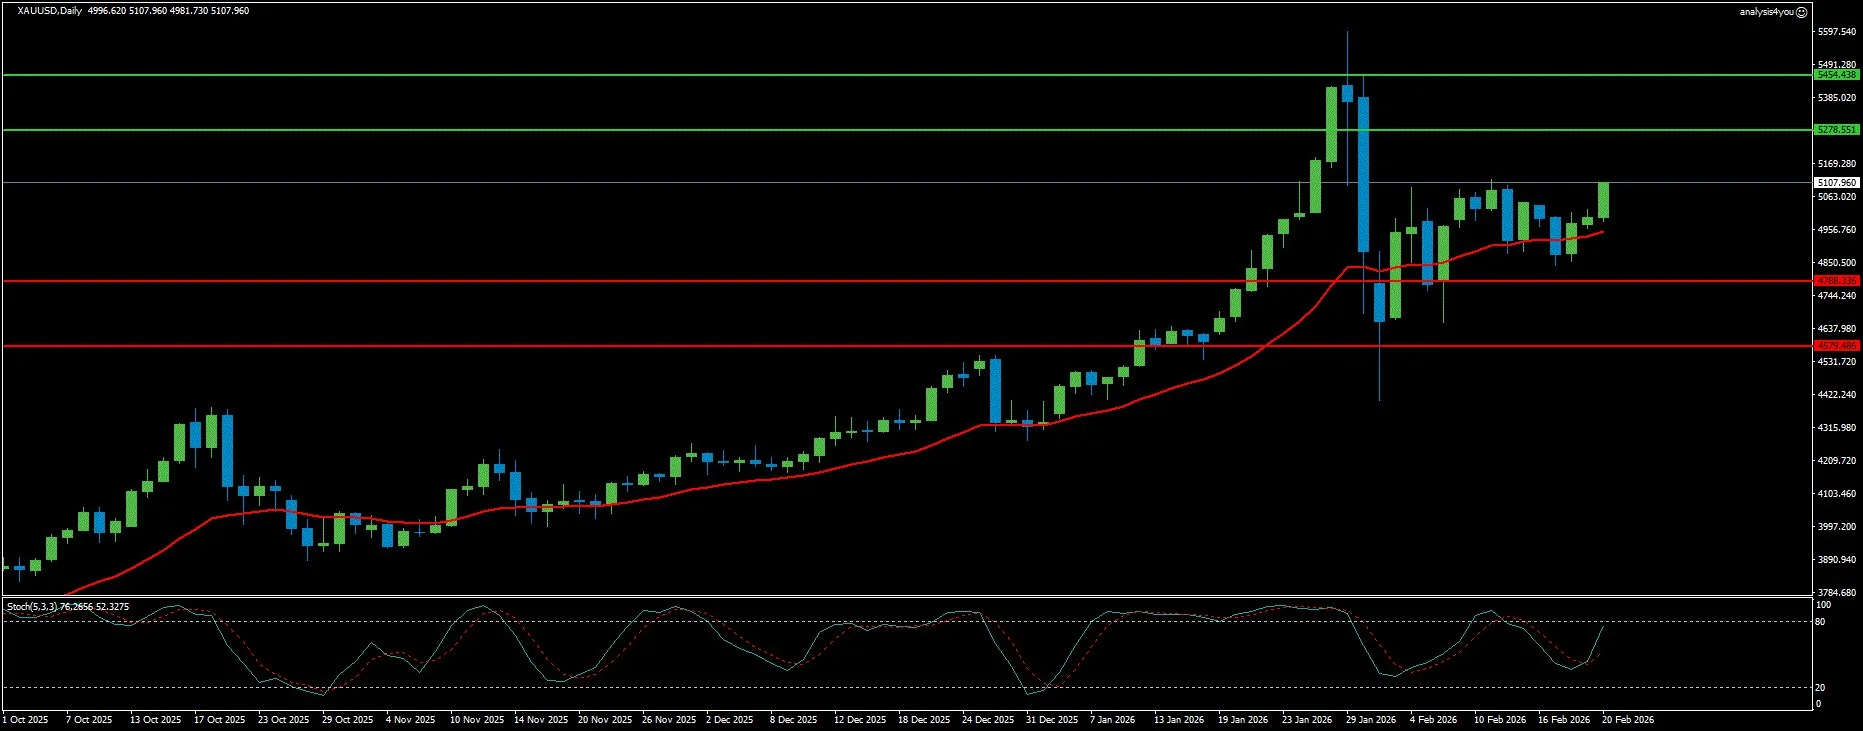
Gold surged to 5,108, hitting fresh highs as escalating US-Iran military tensions drove intense safe-haven demand that overwhelmed all other considerations. CBS News reported Wednesday that US military is prepared for possible strikes on Iran “as soon as Saturday,” with the USS Abraham Lincoln aircraft carrier group and USS Gerald Ford (second carrier group) positioning in the Middle East region. Trump’s ultimatum Thursday that Iran must make a deal or “bad things will happen” with “a maximum of two weeks” timeline intensified war premium. Iran told UN Secretary-General it “does not seek war but will not tolerate military aggression,” while Iranian officials warned of “decisive response if attacked”—raising stakes dramatically. Third round of US-mediated Ukraine-Russia negotiations concluded Wednesday in Geneva without breakthrough, adding to geopolitical risk premium. The precious metal also benefited from Moody’s downgrade of US credit rating from AAA to AA1 citing concerns about $36 trillion debt pile and “successive administrations failing to reverse large annual fiscal deficits.” Friday’s softer-than-expected inflation (headline CPI 2.4% vs 2.5% forecast, core 2.5% meeting estimates) made it difficult for Dollar to preserve strength despite disappointing GDP, allowing Gold to extend gains. Technical indicators show RSI holding comfortably above 50 without reaching overbought extremes, suggesting room for additional upside. Immediate resistance stands at 5,279, with break targeting 5,454 and potentially the prior $5,600 spike high territory if Iran conflict escalates. Strong support at 4,788 provides significant downside protection (would require major geopolitical de-escalation), with critical support at 4,579 representing the ultimate floor that must hold to keep structural bull trend intact. As long as Iran negotiations remain deadlocked and military confrontation threatens, Gold’s tactical bias favors buying dips with upside uncapped.
Resistance: 5,279 | 5,454
Support: 4,788 | 4,579
WTI Crude Oil: Iran Premium Battles Oversupply Fundamentals (66.35)
Current Trend: Bullish (Geopolitically Driven)
Market Sentiment: Mixed (War Fears vs Oversupply)
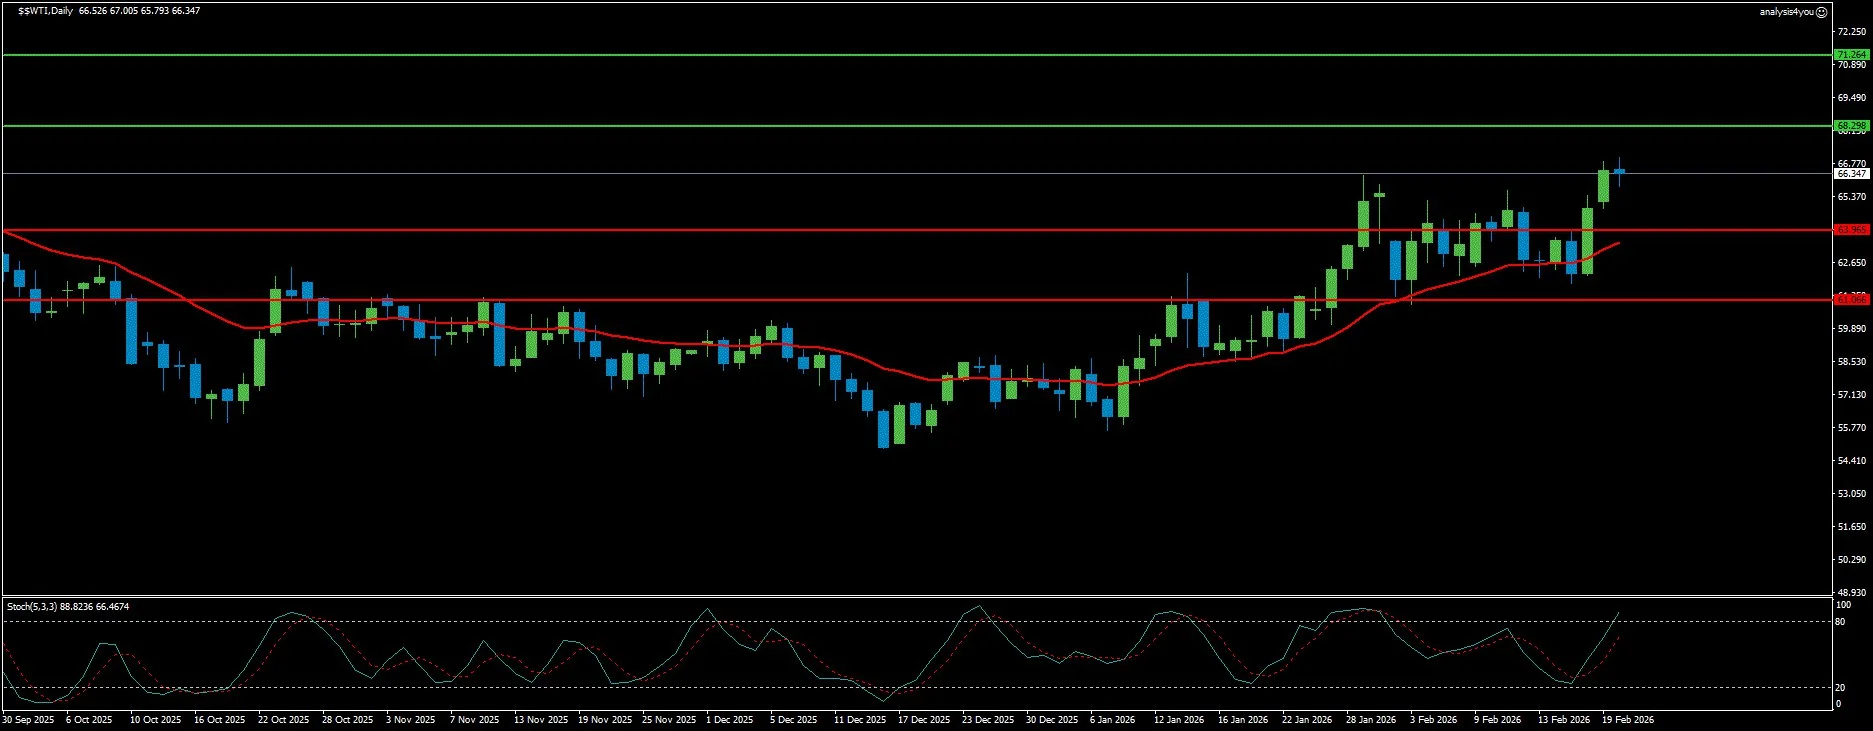
WTI crude rallied to 66.35, approaching its highest level since August 2025 as Iran war premium intensified despite profoundly bearish fundamental backdrop. The 21% surge from December lows reflects market concerns that US-Iran military conflict could close the Strait of Hormuz (through which millions of barrels transit daily) or disrupt Middle East oil infrastructure through Iranian retaliatory attacks. However, underlying fundamentals remain extremely weak: EIA data showed US crude inventories tumbled 9 million barrels (biggest drop since September) to 440.4M barrels, yet this bullish stock draw was overshadowed by structural oversupply concerns. IEA projects 3.7M bpd global surplus in 2026 (nearly 4% of total consumption). OPEC+ discusses additional output from April despite already sitting on meaningful spare capacity, with internal data showing demand for OPEC crude easing in Q2 creating small surplus even before additional hikes. Venezuela sanctions relief has opened door for Chevron, BP, Eni, Shell and Repsol to scale activity, meaning gradual return of Venezuelan medium-sour crude into Atlantic Basin. Rising non-OPEC supply from US, Brazil and Guyana compounds oversupply narrative. The market is essentially pricing $7-10/barrel geopolitical premium on top of fundamentally justified $55-58 level. A golden cross formed as 50-day WMA crossed above 200-day WMA, confirming technical uptrend despite weak fundamentals. Resistance at 68.30 represents immediate target, with break opening door to 71.26 and potentially mid-$70s if actual conflict erupts. Support at 63.97 should limit downside barring major geopolitical de-escalation, with critical support at 61.07 representing level where fundamental weakness would overwhelm war premium. The key risk: if Iran negotiations succeed or military confrontation doesn’t materialize by month-end, the geopolitical premium could evaporate quickly, sending WTI back toward fundamental value in low-$60s or even testing $58-60 support zone.
Resistance: 68.30 | 71.26
Support: 63.97 | 61.07
Crypto
Bitcoin: Fifth Weekly Outflow, Tether Concerns Mount (67,208)
Current Trend: Bearish (Incomplete Capitulation)
Market Sentiment: Extremely Negative
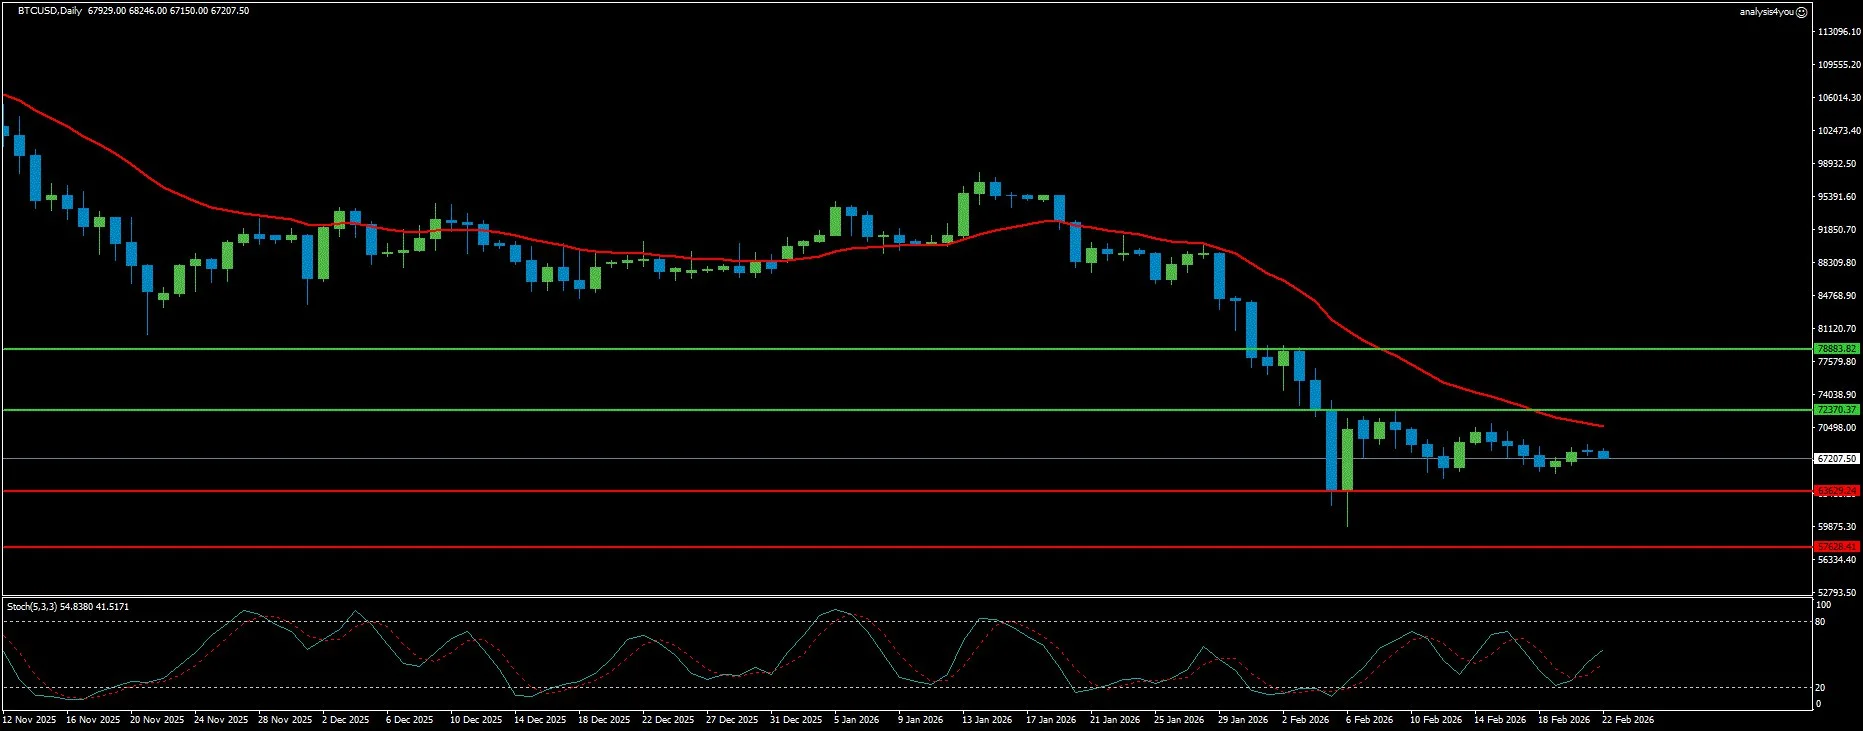
Bitcoin remains trapped at 67,208, showing no signs of recovery despite modest bounce off recent lows, as fifth consecutive weekly ETF outflow ($403.90M through Thursday) confirms institutional abandonment continues unabated. This outflow pattern mirrors the January-March period when BTC crashed from $100,000 to $80,000, raising fears of similar magnitude decline ahead. Strategy (MSTR) purchased just 1,142 BTC in previous week (bringing total to 714,644 BTC at average $76,056), a drastically reduced pace reflecting market weakness—even the most aggressive accumulator has turned cautious. Funding rates averaged -0.64% over seven days (11th consecutive day of negative weekly rates), signaling long traders steadily exiting with no fresh bulls stepping in. Open Interest dropped below 260,000 BTC for first time since October, confirming waning conviction. Critical new concerns emerged about Tether (USDT), crypto’s core liquidity pillar: Reuters Breakingviews reported Tether’s equity cushion shrinking from $7.1B to $6.3B (from 4.9% to just 3.3% of assets) despite USDT volume surging—meaning if Tether’s assets lose more than 3.3% value, insufficient reserves exist to redeem all tokens at dollar peg. Simultaneously, riskier investments (Bitcoin, Gold, secured loans) now comprise 24% of total assets vs historical 15-20%, while cash-like reserves fell to 76% from 80-85% range. Any loss of USDT confidence could destabilize entire crypto ecosystem. Hawkish FOMC Minutes revealed Fed considering rate hikes if inflation stays elevated, removing dovish pivot hopes that typically fuel crypto rallies. Resistance at 72,370 must be decisively cleared to alleviate immediate bearish pressure, with stronger resistance at 78,884 required to confirm trend reversal. Critical support at 63,629 is make-or-break—breach would expose psychologically important 57,628 level and potentially trigger capitulation toward $55K “ultimate bottom” predicted by analysts based on realized price bands and historical bear market patterns. RSI at 36 confirms bearish momentum with no bullish divergence yet forming.
Resistance: 72,370 | 78,884
Support: 63,629 | 57,628
Key Events This Week (February 24-28, 2026)
Major Economic Releases
- Monday: US ISM Manufacturing PMI (May), UK Nationwide House Prices, Switzerland Q1 GDP
- Tuesday: Eurozone preliminary inflation data (May), US Factory Orders (April), JOLTS Job Openings
- Wednesday: Australia Q1 GDP, US ADP Employment (May), ISM Services PMI
- Thursday: ECB Rate Decision (25bps cut to 2.25% widely expected, potentially last 2026 cut), Germany Industrial Orders (April)
- Friday: US Producer Price Index (May) – Key inflation gauge after hot PCE, Germany HICP Flash Estimate (May), Canada Employment Data
Geopolitical Calendar – CRITICAL
- Throughout Week: US-Iran nuclear negotiations (Trump’s two-week ultimatum window)
- Potential Any Day: US military strikes on Iran (CBS reported “as soon as Saturday” preparedness)
- Risk: Iran closure of Strait of Hormuz, attacks on Middle East oil infrastructure
- Ongoing: Ukraine-Russia talks stalled after Geneva round 3 ended without breakthrough
- Ongoing: Israel-Hamas tensions, potential Israeli strikes on Iranian nuclear facilities
Central Bank & Fed Speakers
- Wednesday: Fed Minutes from January meeting (clarity on policy hold reasoning, March cut openness)
- Throughout Week: Multiple Fed officials expected to clarify hawkish FOMC Minutes stance
- Focus: How Fed reconciles weak 1.4% Q4 GDP with accelerating 3% core PCE inflation
- Note: Fed blackout period begins March 7 ahead of March 18 meeting
Corporate Earnings & Events
- Week: Continued tech earnings (focus on AI spending sustainability concerns)
- Thursday: ECB President Lagarde press conference (critical for EUR direction)
Week Ahead Outlook
Thursday’s ECB rate decision represents the week’s first major event. The 25bps cut to 2.25% is universally priced, but markets desperately need clarity from President Lagarde’s press conference on whether this represents the final 2026 cut (as many expect) or if door remains open for additional easing. Current market pricing suggests roughly one more potential cut later in year, so hawkish “one-and-done” guidance would support EUR/USD toward 1.1853-1.1969 resistance, while dovish hints of additional cuts could pressure the pair toward 1.1683 support. The ECB faces delicate balance: Eurozone manufacturing finally crossed into expansion (50.8 PMI) but remains fragile, while persistent inflation concerns argue against excessive easing.
Friday’s US PPI takes on outsized importance following the stagflationary Q4 data combo (1.4% GDP miss, 3% core PCE acceleration). Markets need to see whether producer-level inflation is moderating or building additional pipeline pressure. PPI uptick would validate Fed hawks’ concerns and help Dollar reclaim 98.27-99.13 resistance zone, potentially triggering EUR/USD retreat toward 1.1683 and GBP/USD test of 1.3354 support. Conversely, softer PPI would reinforce the view that Friday’s hot PCE was anomaly and support June-July Fed cut expectations, pressuring Dollar toward 96.77-95.99 support and potentially propelling EUR/USD toward 1.1969 resistance challenge.
However, all traditional macro analysis may be rendered irrelevant by geopolitical developments. Trump’s two-week Iran ultimatum expires during this period, and with US carrier strike groups positioned and military prepared for strikes “as soon as Saturday,” the risk of actual conflict is elevated beyond typical saber-rattling. Iran has warned of “decisive response” including potential Strait of Hormuz closure and attacks on regional oil infrastructure. Actual military engagement would trigger:
- Gold surge toward $5,279-$5,454 resistance and potentially beyond
- WTI crude spike toward $68.30-$71.26 resistance, potentially mid-$70s
- Safe-haven JPY and CHF strength crushing USD/JPY, EUR/USD uncertain (safe-haven EUR demand vs Dollar strength)
- Risk-asset collapse with S&P 500 testing 6,842-6,789 support decisively, potentially breaking toward mid-6,600s
- Bitcoin likely plunge through 63,629 support toward 57,628 as risk-off overwhelms crypto
Conversely, if negotiations produce breakthrough deal, the geopolitical premium evaporates:
- Gold retreat toward $4,788 support
- WTI crude collapse toward $63.97-$61.07 support as fundamental oversupply reasserts
- Risk-on flow supports equities toward 6,961-7,011 resistance
- Bitcoin potential relief rally toward 72,370 resistance
The S&P 500’s position at 6,909 with tightest Bollinger Bands since 2019 suggests the coiled spring is ready to release. Defensive sector leadership (consumer staples, utilities leading while index near highs) has preceded 10%+ corrections in 63% of historical instances—this isn’t a signal to ignore. Combined with CAPE ratio above 40 (dot-com bubble levels), the setup argues for extreme caution on equity longs. Resistance at 6,961 must be reclaimed to alleviate immediate pressure, with 6,789 support as critical make-or-break. A decisive break below 6,789 would likely trigger cascade toward mid-6,600s as defensive rotation confirms distribution rather than healthy broadening.
The Dollar’s position at 97.46 following Supreme Court tariff ruling creates fascinating setup. Resistance at 98.27 must break to signal the legal shock is absorbed, with 99.13 required to confirm recovery. Support at 96.77 provides floor, but break toward 95.99 would suggest deeper damage from the tariff ruling uncertainty—Trump’s announced 15% global tariff workaround may face similar legal challenges, creating ongoing uncertainty that weighs on Greenback. The fundamental backdrop (hawkish Fed Minutes, stagflationary Q4 data) should support Dollar, but tariff ruling uncertainty and geopolitical safe-haven flows into JPY/CHF create crosscurrents.
EUR/USD at 1.1782 needs to clear 1.1853 resistance to target 1.1969 and potentially the critical 1.2082 January multi-year high. Thursday’s ECB decision is key—hawkish “last cut” guidance supports EUR, while dovish hints pressure toward 1.1683 support. GBP/USD at 1.3480 defending 200-day SMA is vulnerable to break toward 1.3354-1.3247 support if data disappoints or BoE signals accelerated rate cut cycle, but resilient economic data (retail sales surge, PMI improvement) argues for holding current levels and potentially challenging 1.3587 resistance.
Gold at 5,108 remains buy-the-dip as long as Iran negotiations deadlocked—support at 4,788 should hold, with upside uncapped if conflict erupts. WTI at 66.35 is pre geopolitical play trading $7-10 above fundamental value—conflict sends it to $68.30-$71.26, peace deal sends it to $61-63. Bitcoin at 67,208 with fifth weekly outflow and Tether concerns is structurally bearish—63,629 support critical, break exposes 57,628 and potential capitulation toward $55K predicted bottom.
Risk management is absolutely paramount. This week combines: (1) Imminent potential US-Iran military conflict with two-week ultimatum expiring, (2) ECB rate decision Thursday, (3) Critical US PPI Friday, (4) Supreme Court tariff ruling creating legal uncertainty, (5) S&P 500 at tightest Bollinger Bands since 2019 coiled for major move, (6) Defensive sector leadership flashing pre-correction warnings, (7) Bitcoin fifth weekly outflow with Tether systemic concerns. Position sizes should be reduced, stops should be tight, and traders should be prepared for gap risk and outsized moves in thin conditions.

