How to Use Correlation Tables to Manage Risk Across Multiple Assets
Financial markets rarely move independently. Capital constantly rotates between equities, bonds, commodities, currencies, and cryptocurrencies as investors respond to changes in economic growth, inflation expectations, and monetary policy.
Because of this interconnected structure, understanding asset correlation has become an essential skill for traders managing exposure across multiple markets. When correlations between assets shift, portfolio risk can change dramatically. Positions that appear diversified may suddenly move in the same direction, increasing overall drawdown risk.
Correlation tables provide a structured way to analyse how markets move relative to one another. By studying asset class correlations, traders can identify hidden exposures, detect shifts in macroeconomic regimes, and build portfolios designed to remain stable during volatile market conditions.
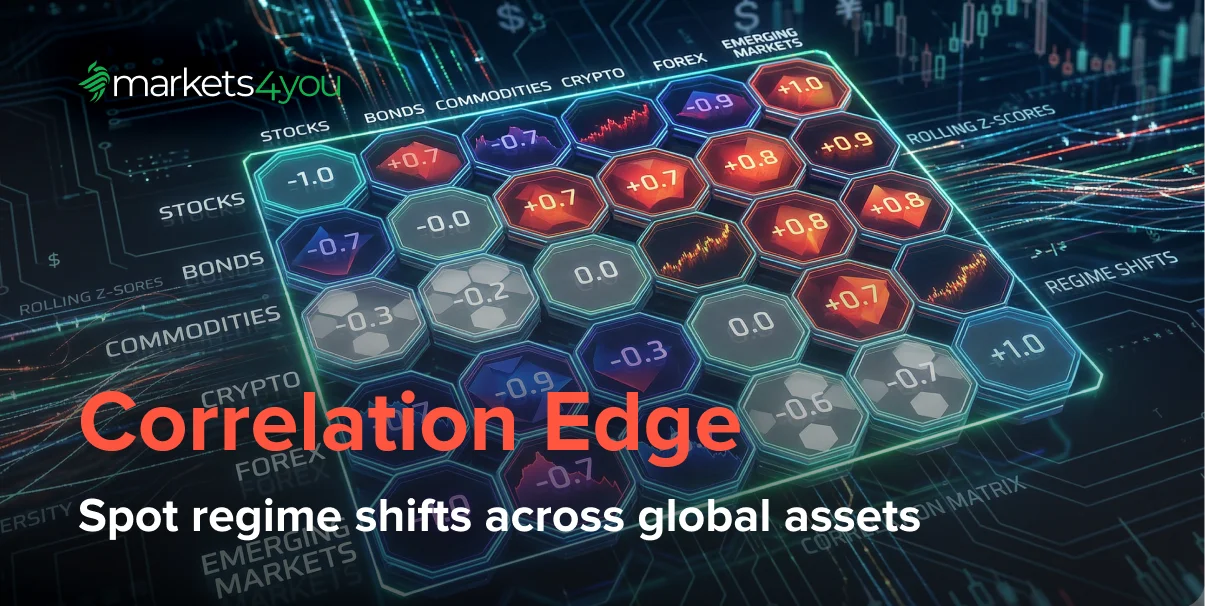
A well-constructed asset class correlation matrix allows traders to visualise relationships between multiple instruments at the same time. These matrices form the foundation of portfolio construction models such as risk-parity weighting, covariance optimisation, and the minimum variance portfolio approach.
When risk appetite rises, many growth-oriented assets may move together. When risk aversion increases, investors often rotate into defensive markets such as government bonds or safe-haven currencies. Monitoring correlation patterns helps traders anticipate these shifts rather than reacting after losses occur.
Understanding correlations therefore helps traders move beyond analysing individual charts and instead evaluate the broader structure of the financial system, which is why many traders rely on intermarket analysis to confirm high-probability price reversals.
The Mechanics of Co-movement: Understanding the −1.0 to +1.0 Coefficient
Before traders can use correlation tables effectively, they must understand the asset correlation definition.
Correlation measures the statistical relationship between the price movements of two assets. This relationship is typically calculated using the Pearson Coefficient Calculation, which produces values ranging from −1.0 to +1.0.
A correlation value close to +1.0 indicates that two assets move in the same direction most of the time. A value near 0 suggests little consistent relationship between the assets. A value close to −1.0 means the assets move in opposite directions.
The asset correlation formula calculates this relationship by comparing the covariance between two return series relative to their volatility. When multiple assets are analysed simultaneously, the results are displayed in an asset class correlation chart or matrix.
These charts allow traders to quickly identify whether assets reinforce or offset each other within a portfolio.
For example, equities across different regions often show strong positive correlations because they respond to similar macroeconomic forces. Meanwhile, certain commodities or defensive assets may sometimes behave as assets negatively correlated to stock market movements, particularly during periods of economic uncertainty.
Historically, gold has occasionally acted as one of the assets with negative correlation to S&P 500 performance, especially during risk-off environments. Government bonds have also served a similar role when falling interest rates increase their attractiveness relative to equities.
However, correlations are not fixed relationships. They evolve as economic conditions change. Inflation shocks, monetary policy tightening, and global liquidity cycles can all influence how markets interact.
During these periods, assets that normally move independently may suddenly display strong positive correlation, increasing portfolio risk. Because of this dynamic nature, traders must continuously monitor correlation tables rather than relying on historical assumptions about diversification.
Identifying Correlation Clusters and the Trap of Fake Diversification
Many investors assume diversification simply means holding multiple asset classes. In reality, diversification only works when those assets behave differently under various market conditions.
Correlation analysis often reveals that seemingly diversified portfolios are actually concentrated in similar macro exposures. This situation is sometimes called fake diversification.
Correlation tables allow traders to detect correlation clusters, which occur when several assets respond to the same economic driver.
For example, technology stocks, high-growth equities, and cryptocurrencies may rise together during liquidity-driven market rallies. However, during tightening monetary policy cycles, these same assets may decline simultaneously.
Although they belong to different markets, they share a common sensitivity to global liquidity conditions.
A similar pattern can occur in currency markets. Commodity-exporting currencies such as the Australian Dollar and Canadian Dollar often move together because both economies depend heavily on global commodity demand. Holding multiple commodity-linked currencies may therefore create concentrated exposure even if the positions appear diversified.
Traders often monitor cross-asset return dispersion to evaluate whether diversification opportunities exist. When dispersion is high, asset classes generate different performance patterns, increasing diversification benefits. When dispersion compresses, markets tend to move together, increasing systemic risk.
Assets that historically move differently from equities may help reduce this exposure. Some investors therefore search for an asset class with low correlation to stock market movements when building portfolios.
However, identifying the best non correlated assets requires continuous monitoring because correlations frequently change as macroeconomic conditions evolve.
Rolling vs Static Tables: Capturing Regime Shifts in High Volatility Markets
Correlation relationships between assets are not permanent. They evolve as economic conditions, monetary policy, and investor behaviour change over time.
Traditional correlation tables are often calculated using long historical data sets. These static tables provide a useful overview of long-term relationships between markets. However, they may fail to capture sudden shifts that occur during volatile macroeconomic periods.
To address this limitation, traders frequently analyse rolling correlations, which recalculate correlation values over a moving time window.
One common method is the Rolling 60-Day Lookback Window, where correlations are continuously updated using the most recent market data. This allows traders to detect changes in asset relationships much earlier than static historical averages.
For example, equities and government bonds have historically shown negative correlation. When stock markets decline, bonds often rise as investors seek safety and central banks reduce interest rates.
However, this relationship can change during periods of rising inflation or tightening monetary policy. In these environments, both equities and bonds may decline simultaneously, causing diversification strategies to fail.
These changes often reflect a regime switching model, where different macroeconomic environments produce different correlation structures.
During periods of elevated market stress, correlations across risk assets often increase sharply. This effect can be amplified by the VIX-correlation feedback loop, where rising volatility forces institutional investors to reduce exposure across multiple asset classes simultaneously.
Rolling correlations therefore allow traders to adapt to the current market regime rather than relying on outdated historical relationships.
Stock-Bond Polarity: The Shift from Negative to Positive Correlation
For many years, investors relied on the negative relationship between equities and government bonds as the foundation of portfolio diversification.
When stock markets declined, bonds typically rallied. This dynamic helped stabilise portfolios and reduce volatility during equity downturns.
However, this relationship has shifted in recent market cycles.
In environments where inflation rises and interest rates increase, both equities and bonds can decline simultaneously. This shift creates a positive asset correlation between the two asset classes.
The phenomenon is often described as stock-bond polarity.
Rising inflation expectations increase sensitivity to inflation-linked bond delta, meaning bond prices react more strongly to inflation forecasts. At the same time, higher interest rates can reduce equity valuations by increasing discount rates applied to future earnings.
These dynamics can cause both markets to move in the same direction.
Another factor influencing correlation changes is the growing importance of sovereign debt risk premium. When investors demand higher yields to compensate for government debt risk, bond prices may decline independently of equity market performance.
Because of these structural changes, traders increasingly rely on asset class correlation charts to monitor relationships between markets.
Crypto-Equity Coupling: How Spot ETFs Integrated Bitcoin into the S&P 500
Cryptocurrency markets were once viewed as an independent financial ecosystem with minimal interaction with traditional markets.
In the early stages of digital asset adoption, Bitcoin was widely considered one of the best non correlated assets, offering diversification benefits within traditional portfolios.
However, this relationship has gradually changed as institutional participation in crypto markets has increased.
The introduction of spot Bitcoin exchange-traded funds has accelerated this transformation. These ETFs allow investors to gain exposure to Bitcoin through traditional financial infrastructure.
As a result, institutional capital now flows into crypto markets through the same channels used for equities, bonds, and commodities, while stablecoins increasingly act as the primary bridge for international trade and cross-border liquidity.
During periods of strong market optimism, both technology stocks and Bitcoin may rise together as investors allocate capital to high-growth assets. Conversely, during risk-off environments driven by tightening monetary policy, both markets may decline simultaneously.
This behaviour reflects the growing influence of global liquidity cycles.
Because cryptocurrencies now respond to many of the same macroeconomic drivers as equities, Bitcoin is no longer consistently an asset class with low correlation to stock market movements.
Building a Risk-Neutral Hedge Using Cross-Asset Pairs Trading
Correlation analysis can also be used to construct hedging strategies that reduce directional exposure while allowing traders to profit from relative price movements.
One widely used approach is market-neutral pair trading.
Pairs trading involves taking offsetting positions in two correlated assets in order to isolate the difference in their performance.
Traders begin by identifying assets with historically stable relationships using correlation tables. They may then perform co-integration analysis to determine whether the relationship between the two assets tends to revert to a long-term equilibrium.
If such a relationship exists, temporary divergences may create trading opportunities.
To implement these strategies effectively, traders calculate position sizes using hedge ratio regression, which helps achieve beta neutrality gating. This allows the strategy to focus on the relative spread between assets rather than an overall market direction.
Traders also monitor z-score spread deviation to determine when the spread between two assets exceeds a mean reversion threshold, signalling a potential trading opportunity.
Dynamic Rebalancing: Adjusting Position Size Based on Correlation Spikes
Portfolio risk changes constantly as correlations between assets evolve.
During calm market conditions, diversification benefits often remain intact. However, when volatility rises, correlations between markets frequently increase, reducing the effectiveness of diversification.
To manage this risk, many portfolio managers implement dynamic rebalancing strategies.
A dynamic rebalancing filter monitors shifts in correlation and volatility across asset classes. When correlations rise beyond normal levels, the system signals that position sizes should be adjusted.
One indicator traders monitor is inter-asset volatility skew, which occurs when volatility increases unevenly across markets.
To maintain balance, many institutional investors apply risk-parity weighting, ensuring each asset contributes a similar level of volatility to the portfolio.
Monitoring correlation tables allows traders to adjust exposures proactively and maintain a capital preservation buffer during periods of market turbulence.
Correlation Breakdowns: Using Divergence as a Leading Indicator for Reversals
Correlation analysis is not only useful for managing risk. It can also provide valuable trading signals.
When assets that normally move together begin to diverge, it may indicate that underlying market conditions are changing.
These events are known as correlation breakdowns.
Traders often analyse these divergences using statistical models that measure deviations from historical correlation patterns.
One common technique involves monitoring z-score spread deviation between correlated assets. When the spread exceeds its historical range, traders may expect the relationship to revert to its long-term mean.
Another widely observed relationship is the DXY-commodity inversion, where commodities tend to move inversely to the US Dollar, reflecting how the US dollar often acts as the ultimate safe haven during periods of global uncertainty.
If this relationship temporarily breaks down, it may signal changes in global liquidity conditions or shifts in inflation expectations.
Because these divergences often occur before major market transitions, correlation breakdowns can provide early warning signals of changing macroeconomic conditions.
Summary
Correlation analysis provides traders with a powerful framework for understanding how different markets interact.
By analysing asset correlation across multiple instruments, traders can identify hidden exposures, detect regime shifts, and construct portfolios that remain resilient during volatile market conditions.
Correlation tables help traders:
- Identify assets negatively correlated to stock market movements
- Avoid fake diversification within correlated sectors
- Detect regime shifts using rolling correlations
- Construct hedges through market-neutral pair trading
- Adjust portfolio exposure through dynamic rebalancing
Because financial markets are increasingly interconnected, analysing correlations has become an essential component of modern risk management.
FAQs
1. Why is my diversified portfolio falling all at once during the debt crisis?
During periods of financial stress, correlations between many asset classes often increase significantly. This phenomenon, sometimes called drawdown synchronization, occurs when investors simultaneously reduce risk exposure across markets.
2. How do I use a correlation matrix to avoid overexposure to the US Dollar?
A correlation matrix allows traders to identify assets that respond similarly to changes in the US Dollar. Many commodities, emerging market currencies, and global equities are sensitive to dollar movements, meaning portfolios may contain hidden USD exposure.
3. What does it mean when the Gold-to-S&P 500 correlation turns positive?
Gold is often considered a defensive asset. If its correlation with equities turns positive, it may signal changing macroeconomic conditions such as inflation shocks or liquidity tightening.
4. Can I use rolling 20-day correlation tables to time Forex trades?
Rolling correlations can help identify short-term changes in relationships between currencies and other markets. Monitoring these shifts may provide insight into changing market sentiment and potential trade opportunities.
5. Is Bitcoin still a non-correlated asset after the Spot ETF expansion?
Bitcoin was once considered largely independent from traditional markets. However, increased institutional participation and ETF flows have strengthened correlations between cryptocurrencies and equity markets in recent years.

