Hawkish Fed Crushes Gold -6%, S&P Below 200-Day MA, Oil Eyes $100

Market Sentiment Overview
Markets enter the week shadowed by the most consequential central bank decisions of 2026 and an energy shock that is deepening beyond initial expectations. All three major central banks (the Fed, ECB, and BoE) held rates steady last week but delivered unmistakably hawkish tones: inflation risk from the Iran war is real, it is building, and rate cuts are increasingly off the table for 2026. Gold posted its worst week since March 2020, losing over 6% as the hawkish Fed triggered massive outflows back into the Dollar and European currencies. The S&P 500 closed below its 200-day moving average for the first time in months, posting its fourth consecutive weekly loss. WTI crude is pressing into the $99-100 zone after Iraq declared force majeure on all foreign-operated oilfields and drones struck two Kuwaiti refineries. These events pushed Brent above $112 on Friday. The Strait of Hormuz remains the fulcrum of everything. Tanker traffic has plunged, Iraq cannot ship crude, and Saudi officials have privately warned that oil could hit $180 if disruptions persist through late April. However, US Treasury Secretary Bessent floated the possibility of unsanctioning approximately 140 million barrels of Iranian crude currently stranded at sea, which represents potential short-term supply relief. Israeli PM Netanyahu added that Iran no longer has the capability to enrich uranium or produce missiles, and that the war could end sooner than expected. This represents the first credible de-escalation signal in weeks. The week ahead is lighter on scheduled data but heavier on Fed speakers, as the blackout period has now been lifted. Flash PMIs on Tuesday are the primary event, with markets watching input cost commentary closely for early signs of energy-driven inflation feeding into the private sector. UK CPI on Wednesday will also draw attention, though its February vintage means it will not yet capture the full energy shock.
Currencies
USD Index: Temporary Stumble, Structural Story Intact (99.329)
Current Trend: Neutral to Bullish (Corrective Pullback)
Market Sentiment: Mixed
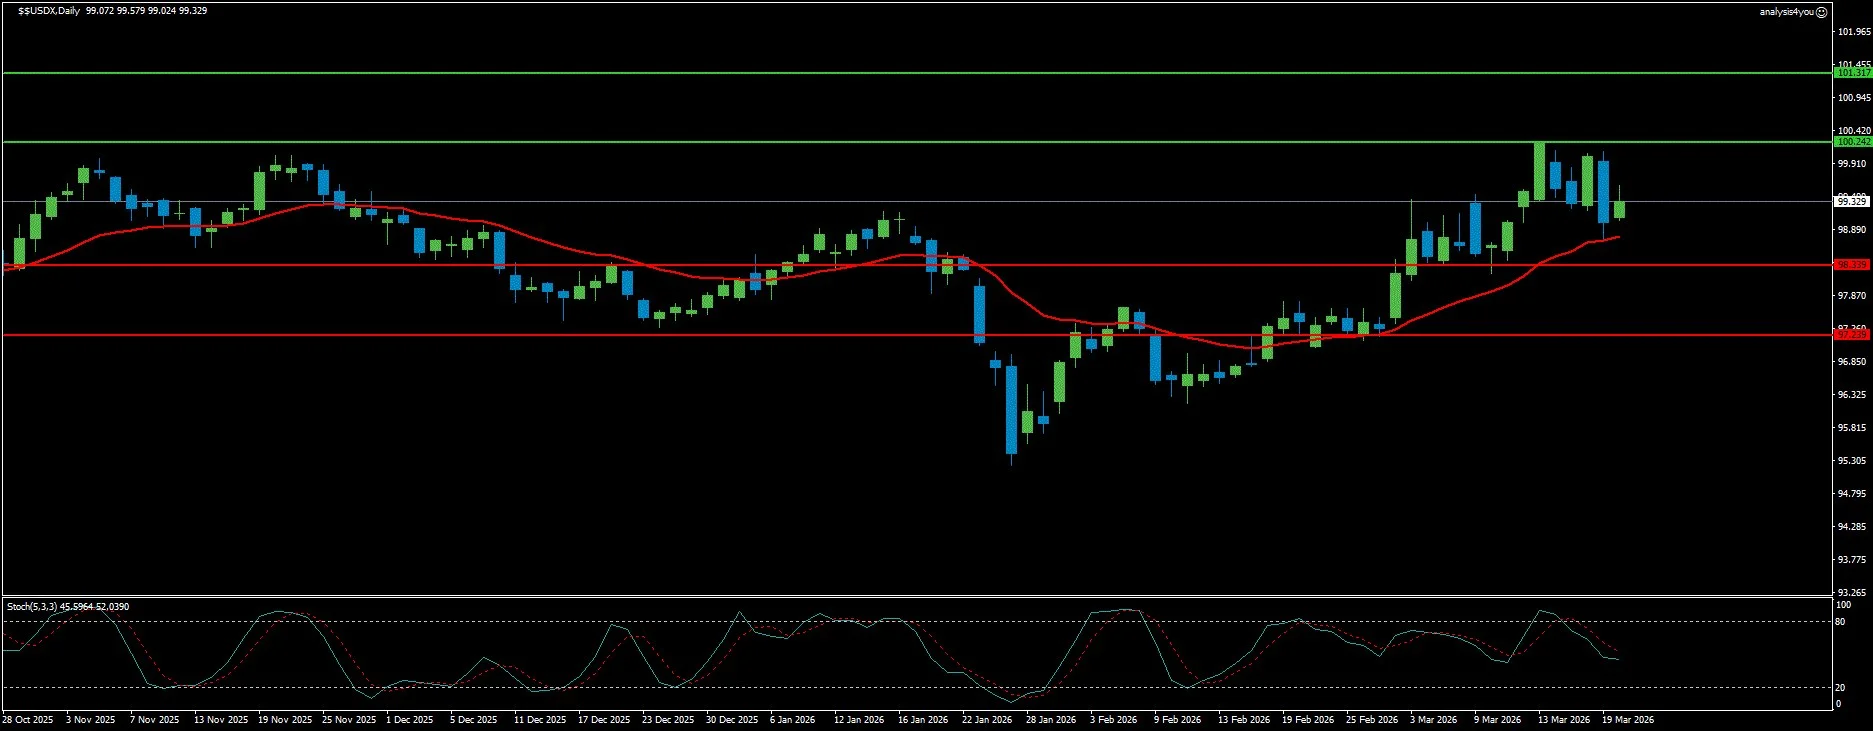
Resistance: 100.242 | 101.317
Support: 98.131 | 97.260
The Dollar delivered a week that confused many observers. After two weeks of gains that pushed it above the 100.00 level, the USDX reversed sharply, slipping below 99.00 at its lows before stabilizing around 99.33. The pullback came despite US Treasury yields pushing higher across the curve following the Fed meeting. This is a divergence that reveals the Dollar is no longer trading on rates alone. The explanation lies in positioning and cross-currency flows. The Fed’s hawkish hold drove capital not just into the Dollar, but also into the Euro and Sterling as investors reassessed the probability of ECB and BoE rate hikes. Both central banks signaled their readiness to act against inflation, which triggered sharp rallies in EUR and GBP on Thursday. These rallies pulled the USDX lower even as US yields rose. This is the core paradox of the current environment: a hawkish Fed that strengthens the Dollar on an absolute basis is also forcing other central banks to turn hawkish, which reduces the Dollar’s relative advantage. Crucially, the macro story for the Dollar has not changed. The Fed revised its 2026 PCE inflation forecast higher to 2.7%, signaled only one rate cut for the year, and Powell explicitly warned that rate cuts will not follow if inflation progress stalls. CFTC positioning data shows that speculative traders hold a net short position of approximately 5,882 contracts on the Dollar, with open interest rising to 32,012. This is thin positioning that remains vulnerable to short squeezes. The recent Dollar decline looks corrective rather than structural. If oil continues its march toward $100 and beyond, stagflation fears will reassert Dollar safe-haven demand. Treasury Secretary Bessent’s comments about Iranian crude sanction relief introduce a near-term wildcard. Any meaningful supply response from that oil hitting the market could temporarily ease energy fears and reduce safe-haven Dollar demand. Technically, the daily chart shows that the USDX has pulled back from the 100.24 peak and is now retesting the 98.13 support zone. This is the former resistance level that was decisively broken the week prior. This is a classic pullback-to-breakout scenario. The question is whether 98.13 holds and launches the next leg higher, or whether the correction extends to the 97.26 deeper support. The Stochastic at 45.60/52.04 has unwound from the overbought extreme of 89.46 from the week prior and is now in neutral mid-range territory. This is healthy for a trend continuation setup. A hold above 98.13 with the Stochastic turning back upward would be a strong signal for resumption toward 100.24 and then 101.32. A break below 98.13 would extend the corrective phase toward 97.26, but it would not invalidate the broader bullish structure.
EUR/USD: Bounce Fading, Bearish Trend Reasserts (1.1568)
Current Trend: Bearish (Corrective Bounce)
Market Sentiment: Cautious
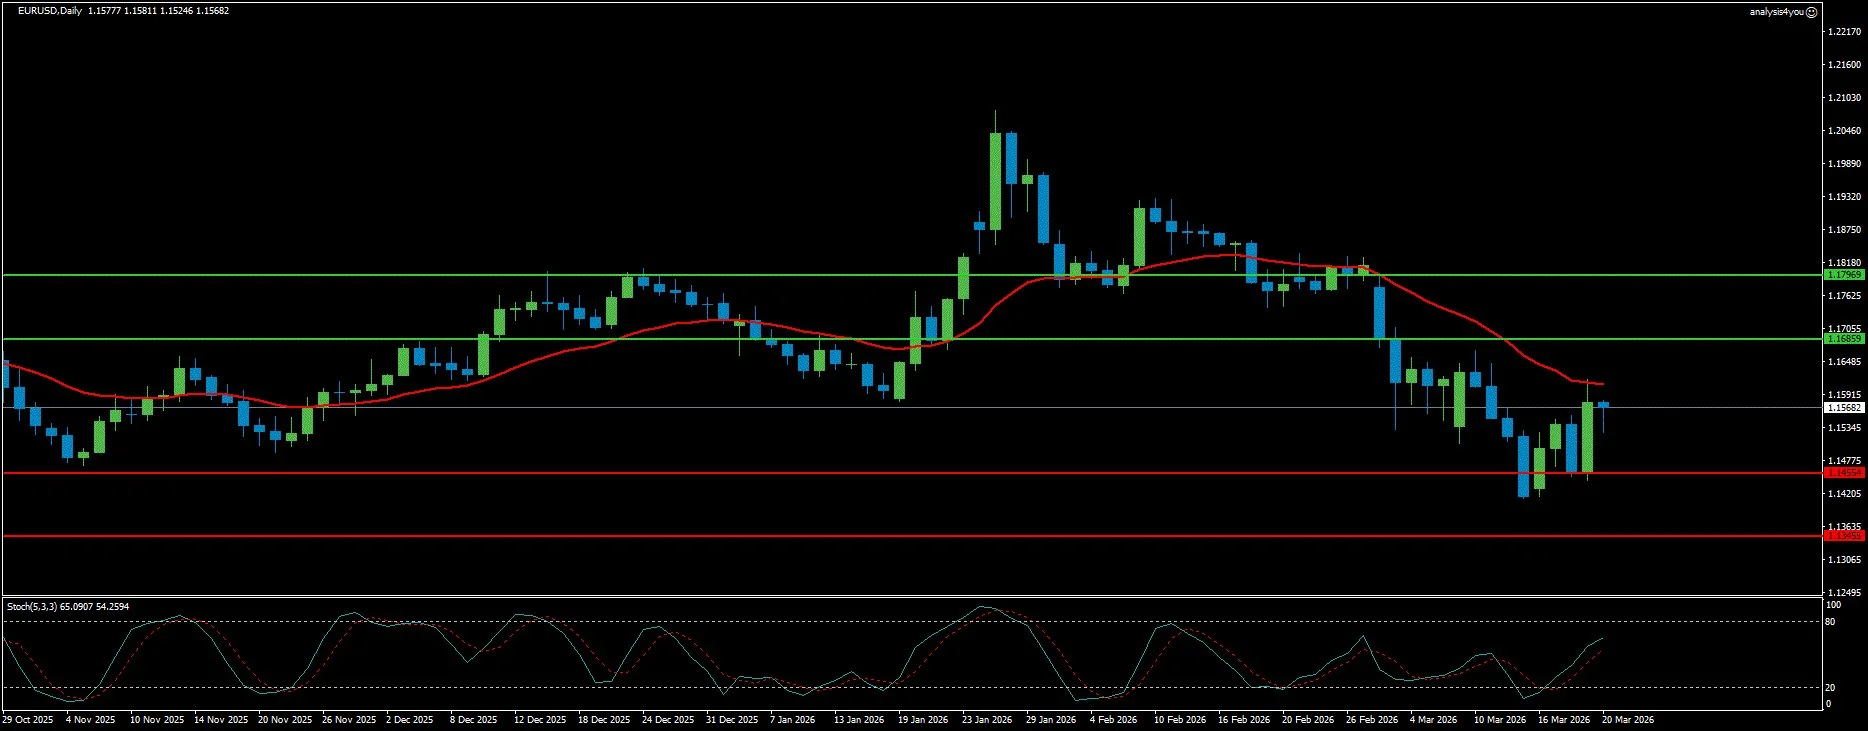
Resistance: 1.1686 | 1.1797
Support: 1.1455 | 1.1346
EUR/USD staged a meaningful recovery from the 1.1411 lows that were reached the prior week, closing the week around 1.1530 before edging to 1.1568 into the weekend. The bounce was driven by the ECB’s hawkish lean on Thursday. Markets re-rated the ECB from a dovish holder to a central bank that is actively considering rate hikes if the energy shock persists. This triggered short covering in EUR crosses. President Lagarde dropped the ‘good place’ characterization of monetary policy and stated that the ECB is ready for an ‘agile’ response. The policy statement described the outlook as ‘significantly more uncertain’ with upside inflation risks. However, the fundamental headwinds for EUR/USD remain firmly in place. German ZEW Economic Sentiment collapsed to -0.5 in March from 58.3 in February. This is one of the most dramatic monthly deteriorations in the survey’s history. It reflects the depth of fear about the war’s economic consequences for Germany and the broader Eurozone. US PPI surged to 3.4% YoY in February with the core reading at 3.9%, which reinforces the USD inflation narrative. The energy shock is asymmetrically negative for Europe. The EU sources only around 10% of its oil and gas from the Middle East, but the LNG disruption from Qatar hits European energy security directly. Qatar declared potential force majeure on long-term supply contracts after losing 12.8 million tons of LNG per year for three to five years due to Iranian attacks. The week ahead brings EU Consumer Confidence on Monday and the critical flash PMIs for the Eurozone on Tuesday. Input cost commentary within the PMI release will be closely watched. Any evidence of energy price pass-through into the private sector would reinforce the ECB hawkish pivot narrative and provide temporary EUR support. Fed speakers will also be active all week. However, the structural backdrop of Europe as a net energy importer facing a supply shock keeps the medium-term EUR outlook under pressure. Technically, the daily chart shows that EUR/USD has bounced from the 1.1411 low but remains below all major moving averages. The 20-day SMA sits around 1.1625, while the 100-day and 200-day SMAs are clustered near 1.1677 to 1.1689, and all are declining. The Stochastic at 65.09/54.26 has moved into overbought territory from deeply oversold readings the week prior. This is a sharp snap-back that is now running out of momentum. The current price at 1.1568 sits between the recent low support at 1.1455 and the 20-day SMA resistance at 1.1625 to 1.1686. A rejection at the 1.1686 resistance zone, where the declining 20-day SMA and the first resistance level converge, would be the signal to re-engage the bear trend. This would target 1.1455 and then 1.1346. Only a clean break and daily close above 1.1797 would shift the near-term bias to neutral.
GBP/USD: Hawkish BoE Rescues Sterling, Trend Remains Fragile (1.3343)
Current Trend: Neutral (Recovery Attempt)
Market Sentiment: Cautious
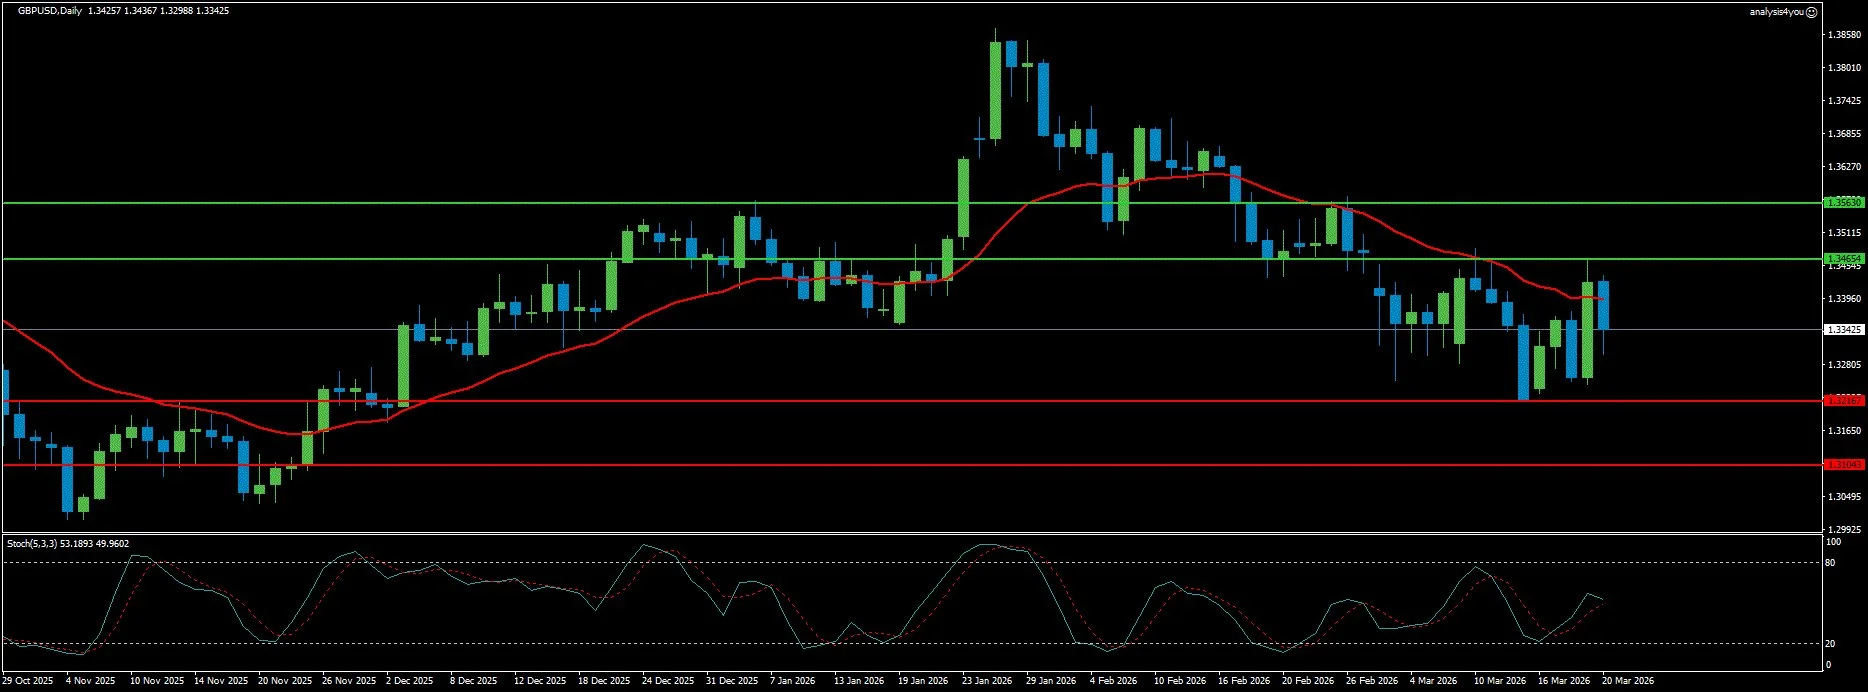
Resistance: 1.3465 | 1.3563
Support: 1.3217 | 1.3104
Sterling delivered the week’s most dramatic reversal. GBP/USD spent most of the week hugging the 1.3219 three-month low before exploding more than 1% higher on Thursday following the Bank of England’s hawkish unanimous hold. All nine members of the Monetary Policy Committee voted to hold the Bank Rate at 3.75%. This is the first unanimous decision since September 2021, which is a signal of rare internal consensus that the current policy stance is appropriate. Governor Bailey stated that the BoE would be monitoring developments extremely closely and that the bank stands ready to act to bring inflation back to 2%. The BoE’s hawkish shift is both credible and meaningful. UK inflation is already above the 2% target, energy price increases from the Iran war make easing impossible, and Bailey’s readiness language carries real weight. However, Sterling’s structural position remains challenged. The UK economy showed zero GDP growth in January against a 0.2% month-on-month expectation. Industrial production fell 0.1% month-on-month, and unemployment rose to a five-year high of 5.2%. The domestic picture is genuinely weak. The BoE is hawkish out of necessity, not strength. The G7 joint statement on Thursday provided additional Sterling support. The UK, France, Germany, Italy, the Netherlands, Japan, and Canada agreed to join efforts to ensure safe passage through the Strait of Hormuz. This suggests the UK is actively contributing to the crisis response. Treasury Secretary Bessent’s comments on potentially unsanctioning Iranian crude also reduced the most extreme oil tail risk, which gave risk-sensitive currencies like GBP room to breathe. The week ahead brings UK CPI on Wednesday, flash PMIs on Tuesday, and BoE speakers Alan Taylor and Megan Greene on Thursday. The February CPI print will not capture the full energy shock but will set the baseline. Technically, the daily chart shows that GBP/USD has recovered from the 1.3219 low and is now testing the cluster of moving averages in the 1.3340 to 1.3465 zone. The 100-day and 200-day SMAs are both in this region, which makes 1.3440 to 1.3465 a critical resistance barrier. The Stochastic at 53.19/49.96 is in neutral mid-range, which is consistent with a recovery that still lacks conviction. The structure remains mildly bearish as long as the price holds below all the major SMAs. A decisive close above 1.3465, breaking through the 100-day and 200-day SMA cluster, would shift the bias to neutral and open the path toward 1.3563. On the downside, 1.3217 is the critical support floor. A break below this level would re-expose 1.3104 and the deeper 1.3000 psychological level.
Stocks
S&P 500: Below 200-Day MA, Fourth Week of Losses (6,534)
Current Trend: Bearish
Market Sentiment: Risk-Off
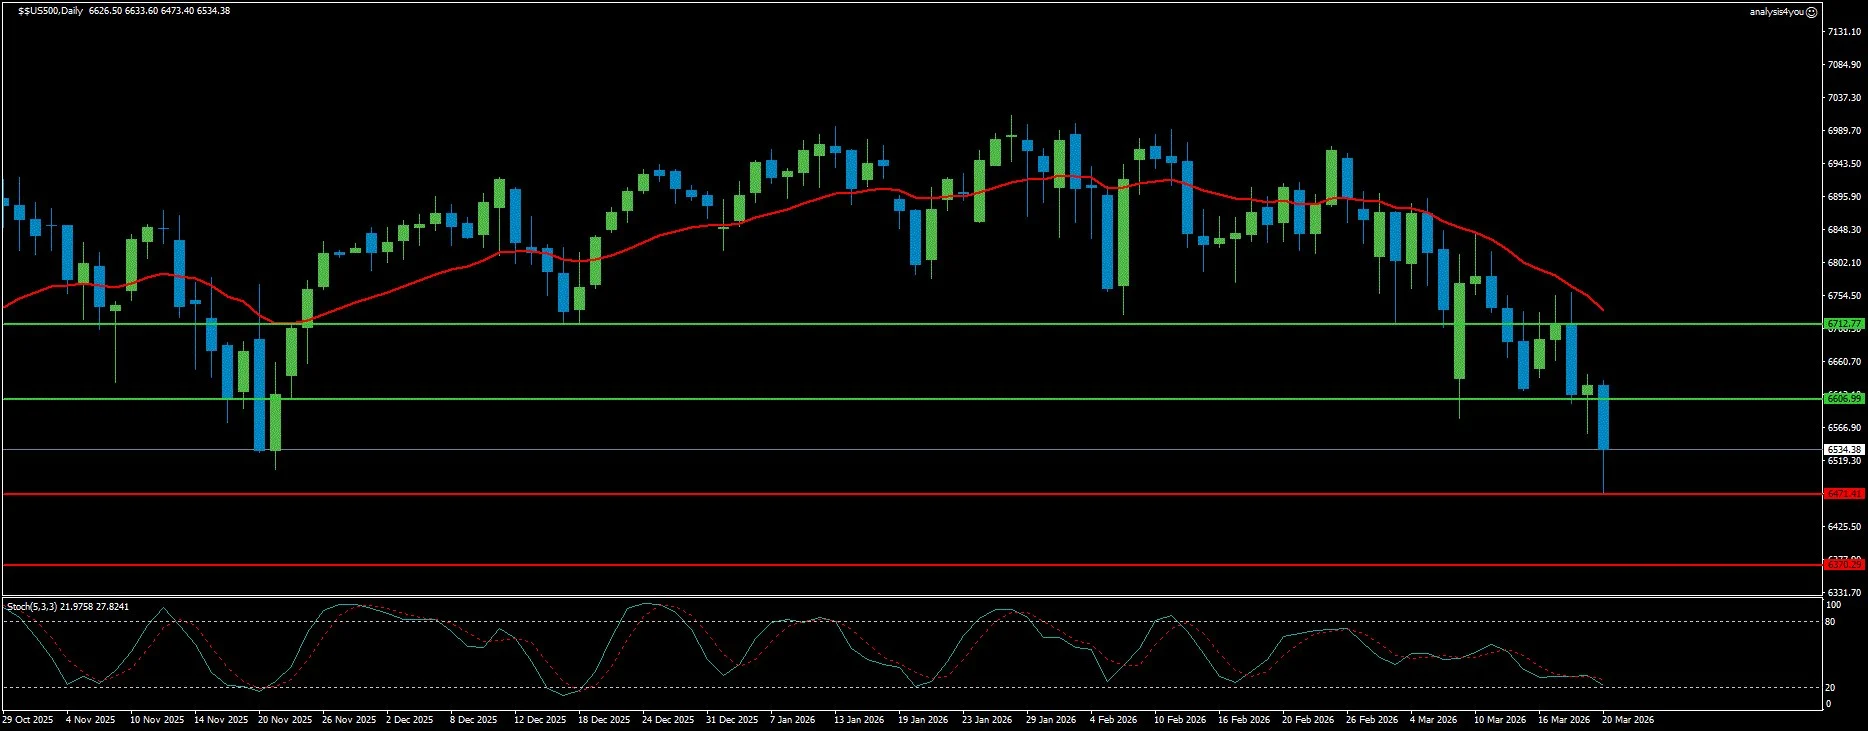
Resistance: 6,607 | 6,713
Support: 6,471 | 6,370
The S&P 500 closed at 6,534 on Friday, down 1.51% on the day and posting its fourth consecutive weekly loss. The index is now below its 200-day moving average for the first time in months. This is a technically and psychologically significant breach. LPL Financial’s chief technical strategist, Adam Turnquist, warned that this could raise serious questions about the bull market’s staying power if the November lows at 6,522 are also breached. The Russell 2000 has already entered correction territory, down 10% from its recent high. The Dow and Nasdaq both traded in correction territory intraday before recovering slightly. The selling on Friday was catalyzed by multiple simultaneous escalations. Iraq declared force majeure on all foreign-operated oilfields. Drones struck two Kuwaiti refineries. Reports emerged that the Pentagon is deploying thousands of additional Marines to the Middle East, with CBS News reporting heavy preparations for ground troops. Around four in five S&P 500 stocks fell on Friday. Utilities, which are normally a defensive safe-haven sector, led losses at 3.5% as rising Treasury yields hit rate-sensitive sectors. Tech leaders Nvidia and Tesla each lost 3%. The only sector that posted gains was energy, with oil majors hitting multi-year and all-time highs. The hawkish Fed added pressure from a different angle. The Fed’s upward revision of 2026 PCE inflation to 2.7% and Powell’s clear statement that rate cuts will not follow if inflation progress stalls have eliminated the interest rate tailwind that supported equities for much of the past year. Morgan Stanley’s chief US economist, Michael Gapen, pushed back, calling rate hike fears overdone and forecasting two cuts in September and December. However, current market pricing contains hints of hikes, not cuts. Citi raised its Brent and WTI forecasts to $120 per barrel over the next one to three months. Every $10 increase in crude adds approximately 0.3 to 0.4 percentage points to CPI. This means that $120 oil would push headline inflation toward 4.5% to 5.0%, which would make any Fed pivot toward cuts essentially impossible in 2026. UBS Global Wealth Management maintained a constructive year-end equity view. They are advising investors to stay invested and use volatility as an opportunity to deploy cash. However, Saudi officials privately warning of $180 oil represents the tail risk scenario that UBS’s base case of higher year-end equities depends on not materializing. Treasury Secretary Bessent’s Iranian crude sanction relief, which could potentially release 140 million barrels, is the most credible near-term circuit breaker for oil prices and, by extension, for equities. Technically, the daily chart confirms the deepening bearish structure. The price has broken below the 200-day moving average, and the declining red MA on the chart is now well above current prices, providing resistance. The Stochastic at 21.98/27.82 is deeply oversold, which introduces the risk of a short-covering bounce. However, the RSI remains bearish, and the price is below the lower Bollinger Band. This is a sign of extreme selling pressure that sometimes precedes continuation rather than reversal. The immediate focus is the 6,471 support level. A close below that would expose 6,370 and potentially the Goldman Sachs worst-case scenario of 6,000 if oil reaches $100 or higher. Resistance at 6,607 caps any bounce, with 6,712 as the stronger ceiling. The 200-day MA breach is the defining technical event. Until the price reclaims that level, the structural bias remains negative.
Commodities
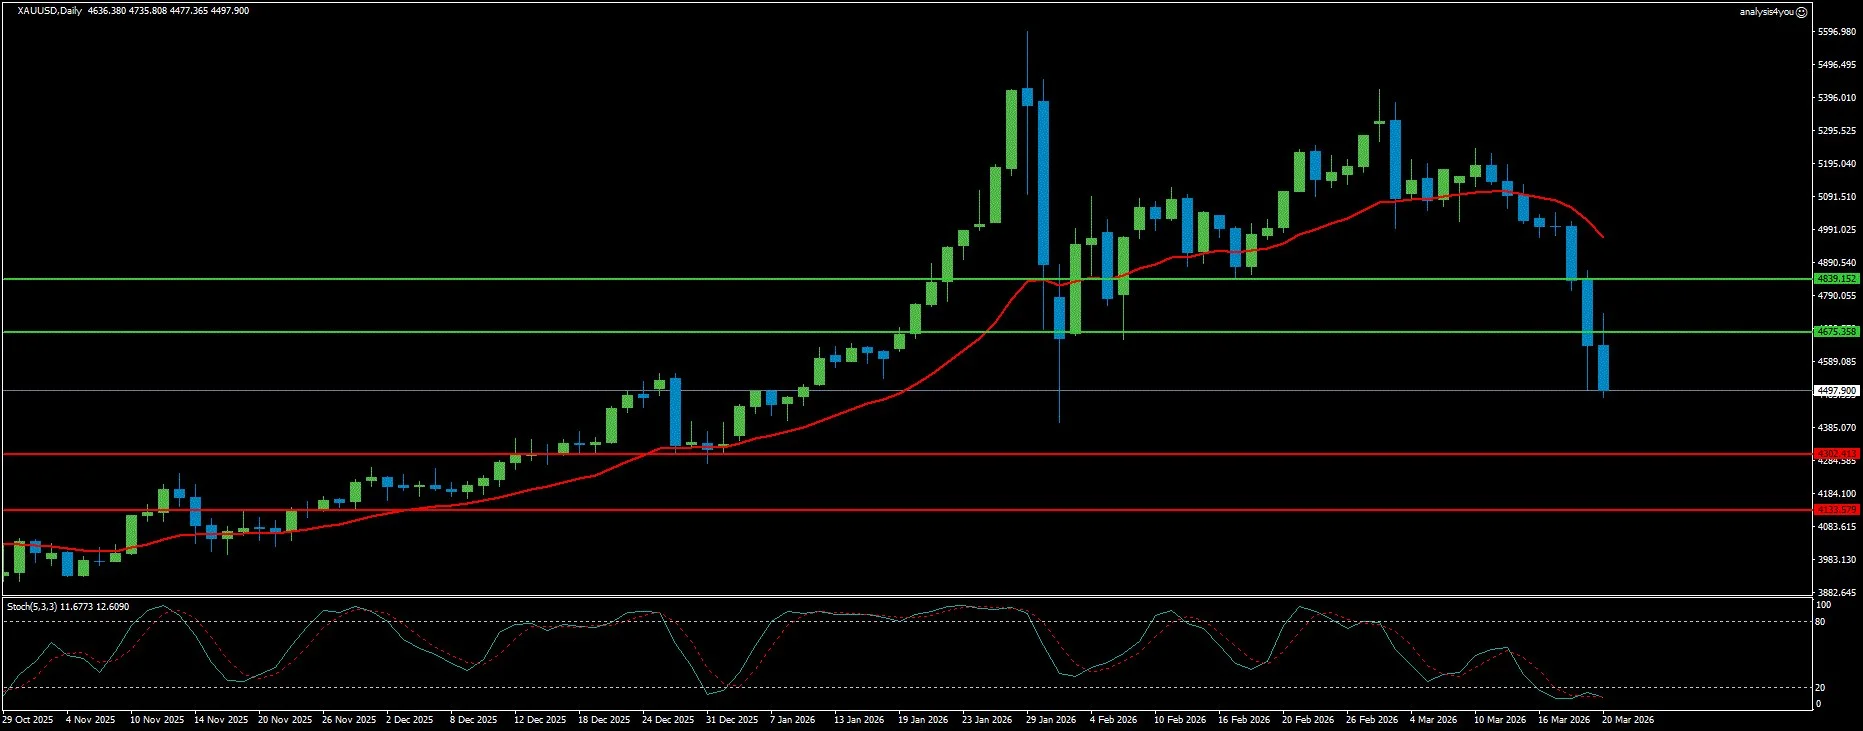
Gold: Worst Week Since 2020, Long-Term Bull Trend Tested (4,498)
Current Trend: Bearish (Long-term Bull Under Threat)
Market Sentiment: Capitulation
Resistance: 4,675 | 4,839
Support: 4,302 | 4,134
Gold’s collapse last week was the market’s most jarring development. XAU/USD lost more than 6%, which is its worst weekly performance since March 2020. It closed near $4,497 after touching lows near $4,460. The decline accelerated sharply on Wednesday following the Fed’s hawkish hold. Gold dropped more than 3% in a single session as Powell’s messaging eliminated near-term rate cut expectations and strengthened the Dollar. The paradox of a war driving Gold lower is now fully established. Surging oil prices are reviving inflation fears, which is forcing central banks into hawkish postures. This strengthens the Dollar and raises real yields, all of which are bearish for Gold. The institutional flow data tells the story clearly. XAU/EUR and XAU/GBP both lost more than 4% on Thursday alone, following the ECB and BoE decisions. This means that capital was flowing out of Gold specifically into Euro and Sterling assets, not into other safe havens. Gold is no longer the default geopolitical safe-haven trade when the energy shock is simultaneously repricing central bank expectations globally. TD Securities’ Daniel Ghali’s analysis from the prior week remains relevant. Institutional Gold holders are managing it as a portfolio allocation, not a pure crisis hedge. When rates-driven forces dominate, they trim their exposure. Gold broke below the ascending trend line drawn from early November 2025 and fell below the 100-day SMA. These are two technically significant violations that have triggered additional momentum selling. The CME FedWatch Tool shows less than 10% probability of any Fed rate cut by the end of 2026. For Gold to recover, one of two things needs to happen. Either oil prices correct significantly, which would reduce inflation fears and allow the Fed to pivot dovish, or the conflict escalates to the point where a genuine flight-to-safety bid overwhelms the Dollar and rate pressures. The Trump administration’s consideration of occupying or blockading Kharg Island is the kind of extreme escalation scenario that could trigger such a response. Netanyahu’s comments about the war potentially ending sooner than expected are the de-escalation counterweight. The week ahead brings no high-tier US data beyond PMIs and Fed speakers. The Gold market will trade on oil prices and geopolitical headlines above all else. If Bessent’s Iranian crude sanction relief materializes and oil pulls back toward $90, Gold could find significant relief. If Iraq’s force majeure and Kuwait refinery strikes drive oil toward $110 to $120, Gold faces additional pressure from the rate-hike narrative intensifying. Technically, the daily chart shows a dramatic reversal of the long-term uptrend that had been in place since October 2025. The price has crashed through multiple support levels and is now approaching the critical zone around $4,302 to $4,500. Crucially, the price is still above the 200-day MA, which is the long-term bull trend’s final line of defense. The Stochastic at 11.68/12.61 is at its most oversold reading in over a year, which suggests extreme selling pressure that could trigger a technical bounce. However, the RSI remains bearish, and the price is below the lower Bollinger Band. These are conditions that can persist in strong downtrends. The 100-day SMA now acts as pivot resistance around $4,600. Above that, $4,675 is the first meaningful resistance level. A recovery above $4,839 would begin to repair the technical damage. On the downside, $4,302 is the next key support after the current area, with $4,133 as the deeper floor. A break below $4,302 would expose the 200-day MA and raise genuine questions about the long-term bull trend.
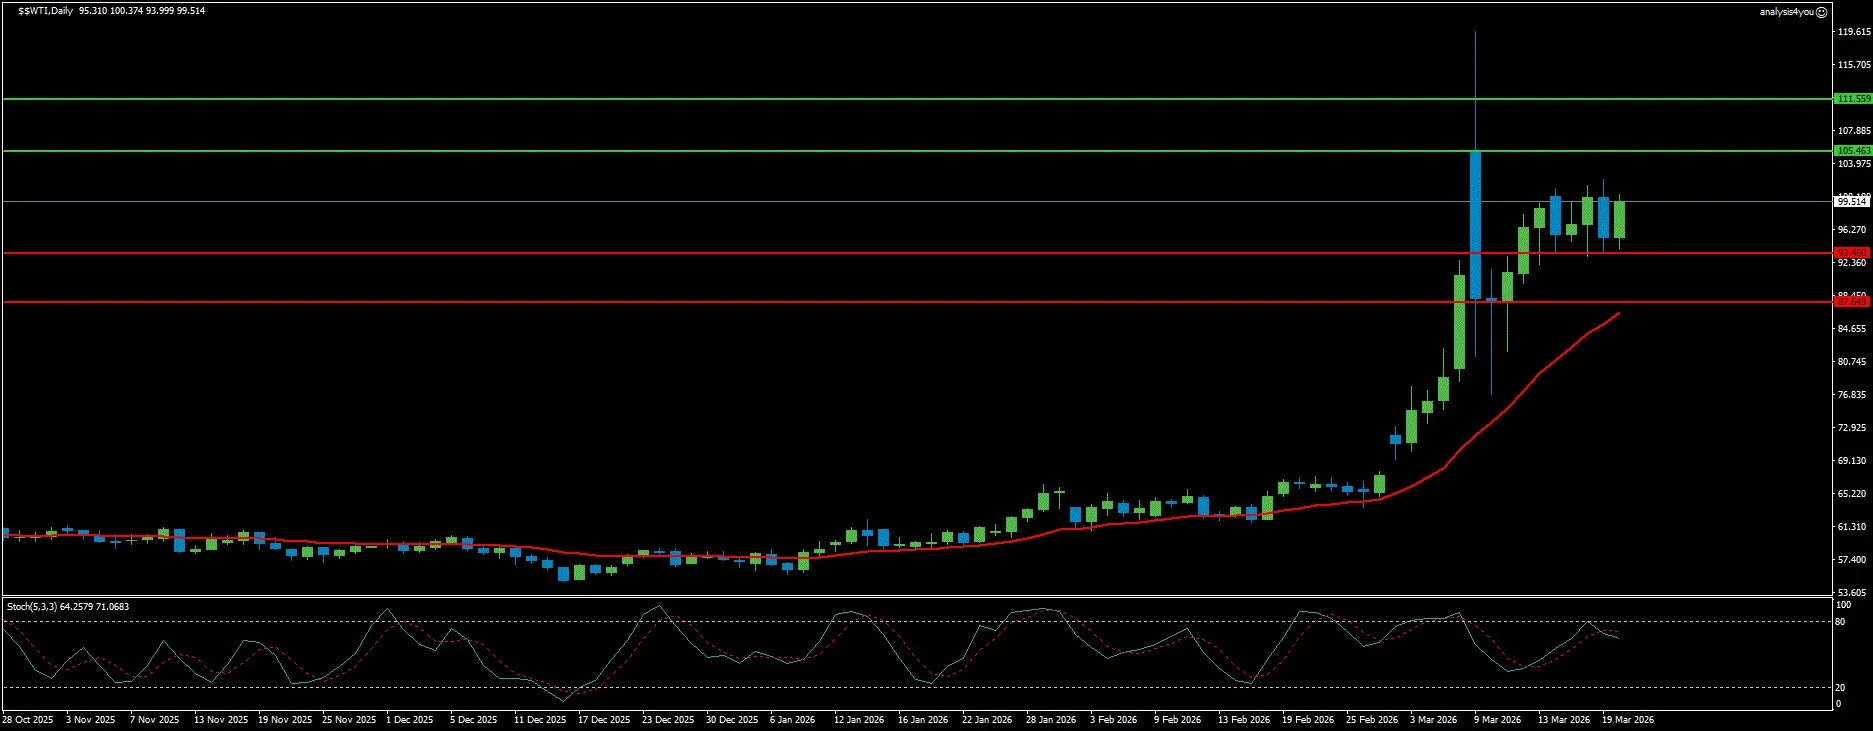
WTI Crude Oil: $100 Threshold Imminent, Supply Shock Deepens (99.51)
Current Trend: Bullish (Consolidating)
Market Sentiment: Fear (Supply Crisis)
Resistance: 105.46 | 111.56
Support: 93.46 | 87.65
WTI crude closed the week at $99.51, pressing against the critical $100 psychological barrier after a week that added multiple new supply shock catalysts. Iraq declared force majeure on all foreign-operated oilfields, citing an inability to ship crude through the Strait of Hormuz. Drones struck the Mina Al-Ahmadi and Mina Abdullah refineries in Kuwait on Thursday, causing fires and precautionary shutdowns. Iran also attacked gas facilities in Qatar, the UAE, and Saudi Arabia, which was in retaliation for Israeli strikes on Iran’s South Pars gas field. Brent crude closed at $112.19. Citi now targets $120 for both Brent and WTI in the next one to three months, with a bull case of $150 if disruptions intensify. The near-term supply picture has deteriorated dramatically from the prior week. Qatar’s LNG force majeure declaration removes 12.8 million tons of annual LNG capacity for three to five years. Iraq’s force majeure removes one of the world’s largest oil export programs from the global supply equation. Saudi officials have privately warned of $180 oil if disruptions persist through late April. The IEA’s 400 million barrel emergency reserve release, which was agreed unanimously the week prior, now looks insufficient against the scale of the supply disruption. The potential offsets are meaningful but uncertain. Treasury Secretary Bessent’s offer to unsanction approximately 140 million barrels of Iranian crude currently stranded at sea could provide 10 to 14 days of supply relief if it proceeds. Netanyahu’s comments suggesting that Iran no longer has nuclear or ballistic missile capability and that the war could end sooner than expected represent the first credible de-escalation signal. The G7 coalition to escort ships through the Strait, with the UK, France, Germany, Italy, the Netherlands, Japan, and Canada committed, could begin restoring tanker traffic if naval operations prove effective. Citi’s base case of de-escalation within four to six weeks, with Brent easing to $70 to $80 by year-end, hinges on these developments materializing. For the week ahead, the $100 WTI level is the defining threshold. A sustained break above $100 would validate Citi’s $120 target, trigger additional inflationary repricing across all asset classes, and push the S&P 500 and Gold in their respective downward directions. Any credible de-escalation or supply relief could trigger an equally sharp reversal. The oil market is pricing in sustained disruption, and any reduction in that fear would release significant downside pressure. Technically, the daily chart remains powerfully bullish in structure. The price is above all moving averages. The MA is curling steeply upward, and the pattern of higher highs and higher lows from the post-spike recovery remains intact. The price is consolidating in the $93 to $99 range just below the $100 barrier. The Stochastic at 64.26/71.07 is in overbought territory but is showing a bearish crossover. This signals that a short-term pullback or consolidation is possible before the next breakout attempt. A decisive close above $100 would be a major technical event, opening the path toward 105.46 and then 111.56, which is the war spike high zone. On the downside, 93.46 is the first meaningful support, with 87.65 as the stronger floor. The Stochastic bearish signal in overbought territory suggests that the $100 break may not happen in a straight line. A brief pullback toward $93 to $95 before a renewed push higher is the most likely short-term path.
Crypto
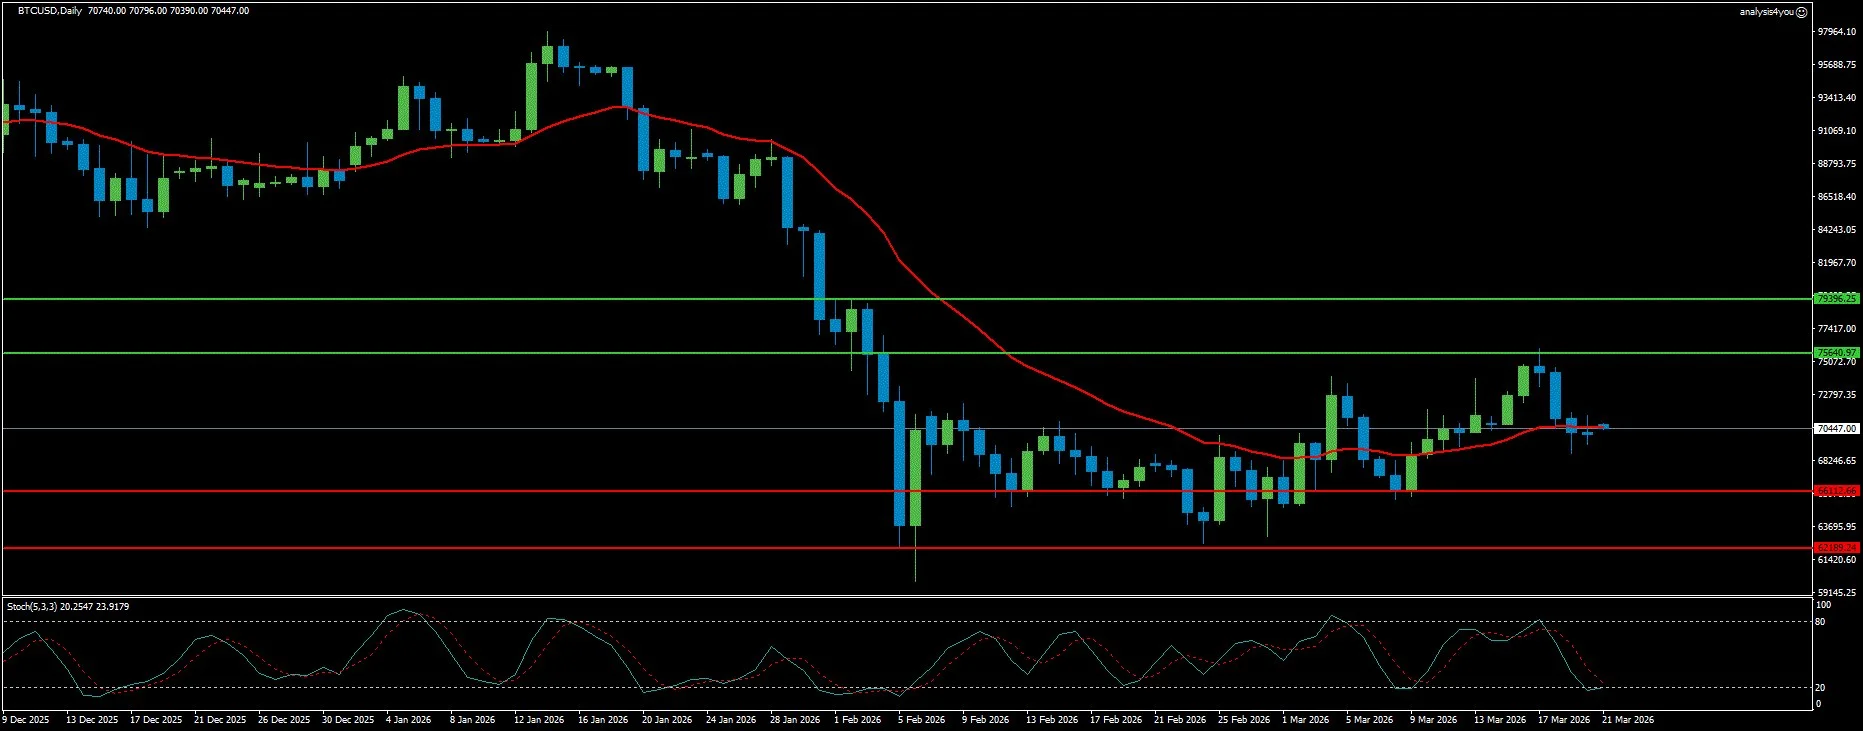
Bitcoin: Fed Kills the Vibe, Range-Bound Battle Continues (70,447)
Current Trend: Range-Bound (Corrective)
Market Sentiment: Mixed
Resistance: 75,641 | 79,396
Support: 66,113 | 62,189
Bitcoin closed the week near $70,447, slipping approximately 3% from the prior week’s close and snapping two consecutive weeks of recovery gains. The Crypto King had surged to $76,000 on Tuesday, which was its highest level since early February, before the Fed’s hawkish tone on Wednesday triggered a sharp reversal. The Fed’s upward revision of 2026 PCE inflation to 2.7% and Powell’s explicit warning that rate cuts will not follow if inflation progress stalls killed risk appetite across the board. BTC declined alongside equities and other risk assets. The institutional flow picture turned mixed. Spot Bitcoin ETFs saw alternating inflows and outflows through the week. There was a $201.62 million inflow on Monday, a $199.37 million inflow on Tuesday, then a $163.52 million outflow on Wednesday and a $90.19 million outflow on Thursday. The net result was a week of indecision. Institutional investors are not abandoning BTC, but they are not adding aggressively at current levels either. Strategy, led by Michael Saylor, continued its aggressive accumulation by purchasing another 22,337 BTC during the week. This brings the total holdings to 761,068 BTC, which is a powerful long-term conviction signal even as the average purchase price of $75,696 sits above current market prices. The most important analytical framing for BTC in the current environment comes from K33 Research. Bitcoin had already underperformed for months before the war, experiencing a 50% drawdown from its $126,199 all-time high. With positioning washed out (underowned, overshorted, and oversold), existing holders are less inclined to sell into weakness. Since the war began on February 28, BTC was trading near $65,800 and has gained over 6% to date. This means it has outperformed equities and Gold despite the risk-off environment. This is the digital escape hatch narrative in action, which is particularly relevant in Gulf countries that are experiencing currency volatility. Morgan Stanley’s filing of a second amended S-1 for a spot Bitcoin ETF with the SEC, which is confirmed to list on NYSE Arca under the ticker MSBT, is a significant medium-term development. If approved, Morgan Stanley would become the first major US bank to issue a spot Bitcoin ETF directly. This represents the next institutional adoption milestone after BlackRock and Fidelity, and it would introduce an entirely new distribution channel for BTC exposure. The headwinds remain. Sustained oil prices above $100, feeding inflation and forcing the Fed toward hikes, would be historically bearish for crypto. The CME futures curve slope is trending lower, which mirrors the pre-2018 and pre-2021 bear market setups. However, the 78.6% Fibonacci retracement at $65,520 has held as a floor throughout the war period. Technically, the daily chart shows that BTC has pulled back from the $76,000 rejection and is now consolidating around $70,447, just above the channel midpoint at approximately $69,200. The price remains below all major moving averages. The 50-day and 100-day EMAs are clustered between $72,600 and $78,800, which keeps the broader trend context bearish. However, the MA is beginning to flatten and curl slightly, which suggests the downtrend is losing momentum. The Stochastic at 20.25/23.92 is deeply oversold, which is consistent with the sharp pullback from $76,000 and may be setting up for a bounce. The RSI on the daily chart is around 51, which shows balanced momentum. The key level to watch is $72,600, which is the channel top and 50-day EMA confluence. A sustained daily close above that level would open the path toward the $75,641 resistance and then $79,396. On the downside, $66,113 is the first support, with $62,189 as the critical floor. A break below $62,189 would expose the capitulation zone around $55,000 to $56,000 that has been cited by multiple analysts.
Key Events This Week (March 23-27, 2026)
-
Monday, March 23: EU Consumer Confidence (March). This is a light session. Markets will digest weekend geopolitical headlines, particularly any developments around Bessent’s Iranian crude sanction relief and the G7 naval coalition’s Hormuz operations.
-
Tuesday, March 24: Flash S&P Global PMIs for the Eurozone, UK, and US (March). This is the week’s primary data event. Input cost commentary within the PMI releases will be critical. Any evidence of energy price pass-through into private sector costs would validate the hawkish central bank pivot narrative and support the USD while pressuring equities and Gold. A Services PMI reading above 50 with rising price pressures would be the most bearish scenario for rate-cut expectations.
-
Wednesday, March 25: UK CPI (February YoY). This is expected to show elevated inflation but will not yet capture the full Iran war energy shock, which will limit its impact on GBP. Multiple Fed speakers are scheduled throughout the day following the end of the blackout period. Their tone on the pace of potential future rate hikes versus cuts will be closely watched.
-
Thursday, March 26: US Initial Jobless Claims. BoE speakers Alan Taylor and Megan Greene are scheduled. Any hawkish language from BoE members would provide additional GBP support. Fed speakers will continue throughout the day.
-
Friday, March 27: UK Retail Sales (February). This is mid-tier data that will gauge UK consumer resilience under the energy price shock. Additional Fed speakers are scheduled.
-
Geopolitical Dominance: All scheduled data events remain subordinate to Strait of Hormuz developments. Key watch items for the week include: (1) Whether Bessent’s $140 million barrel Iranian crude unsanctioning proceeds and how oil markets respond, (2) Progress or failure of the G7 naval coalition in restoring Hormuz passage, (3) Any escalation involving US ground troops in the Middle East, (4) Further attacks on Gulf energy infrastructure.
Week Ahead Outlook
The week of March 23 to 27 arrives at a delicate inflection point. The central bank blitz is behind us. All three major banks have held rates and turned hawkish. The market is now left to price the consequences of a war that is entering its fourth week with no credible resolution in sight, but also with the first genuine de-escalation signals emerging from multiple directions simultaneously.
Scenario 1: Oil Breaks $100, Escalation Deepens (Base Case, approximately 50% probability)
WTI decisively breaks above $100 following continued Hormuz disruptions, Iraq’s force majeure, and potential further infrastructure attacks. Brent approaches $120 as Citi has targeted. The stagflation narrative becomes market consensus. Fed speakers signal zero rate cuts for 2026, with one or two policymakers raising the possibility of hikes. The USD rebounds from 98.13 support toward 100.24 and then 101.32. EUR/USD resumes its decline below 1.1455, targeting 1.1346. GBP/USD struggles to hold 1.3217. The S&P 500 breaks 6,471, targeting 6,370 and potentially 6,000. Gold remains under pressure, testing $4,302 support. WTI targets $105.46. Bitcoin range-trades between $66,000 and $72,600.
Scenario 2: Bessent Relief Plus De-escalation (approximately 35% probability)
The US unsanctions 140 million barrels of Iranian crude, providing 10 to 14 days of supply relief. WTI pulls back sharply toward $90 to $93. Netanyahu’s end-of-war comments gain traction. This triggers a risk-on bounce. EUR/USD recovers toward 1.1686 resistance. GBP/USD breaks 1.3465, targeting 1.3563. The S&P 500 bounces toward 6,607 to 6,713. Gold surges toward $4,675 as inflation fears ease and real yields fall. The USD pulls back toward 97.26 support. Bitcoin jumps toward the $75,641 resistance. This scenario would be driven by oil market relief and would be violent and fast.
Scenario 3: Extreme Escalation with Ground Troops and Major Infrastructure Attack (approximately 15% probability)
US ground troops enter Iran. There is a major attack on Saudi Aramco infrastructure or UAE energy assets. Brent spikes above $130 toward $150. Emergency G7 and OPEC+ meetings are convened. The S&P 500 faces circuit-breaker risk and gaps lower toward 6,000. Gold initially spikes above $5,000 on safe-haven demand before being sold as inflation fears dominate. Bitcoin flash-crashes below $65,000. There is speculation about a Fed emergency meeting. This is the tail risk, but the Pentagon ground troop preparations reported by CBS News make it less remote than it was a week ago.
Trading Priorities for the Week
- USDX at 98.131 is the critical support level. A hold signals a bounce toward 100.24. A break extends the correction to 97.26.
- EUR/USD at 1.1686 is the resistance test. A rejection confirms the bearish resumption. A break above opens 1.1797.
- GBP/USD at 1.3465 is the SMA cluster resistance. A break above shifts the bias to neutral. A rejection keeps the bearish trend intact.
- The S&P 500 at 6,471 is the support floor. A break exposes 6,370 and the 6,000 worst-case scenario.
- Gold at $4,302 is the next key support after $4,497. Watch for a Stochastic bounce toward $4,675.
- WTI at $100 is the defining psychological and technical level. A break above confirms the $105.46 target.
- Bitcoin at $75,641 is the breakout confirmation level. A daily close above opens $79,396.
- Tuesday’s PMI input cost commentary is the week’s most important scheduled data point for central bank expectations.
Bottom line: The market has digested the central bank week and arrived at a clear conclusion. Rates are not coming down in 2026, and the risk is that they go higher if oil stays elevated. The USDX pullback is corrective, not structural. Gold’s collapse is the market’s honest assessment of the energy-inflation-rate dynamic. Equities that are below the 200-day MA are in genuine bear territory until oil reverses. WTI is one headline away from $100. The first credible de-escalation, whether it is Bessent’s oil relief, G7 naval success, or a Netanyahu war-end signal, would trigger a violent multi-asset reversal. Position for the base case, but stay alert for the pivot.

