Geneva MOU Signing Sunday, Warsh’s First FOMC Wednesday, BoE and BoJ Simultaneous

Market Sentiment Overview
The week of June 15 to 19 is the most consequential policy week of the entire Iran war. Three central bank decisions (the Federal Reserve on Wednesday June 17, the Bank of Japan on Tuesday June 16, and the Bank of England on Thursday June 18) arrive simultaneously with the most dramatic geopolitical development since the MOU was first announced: Bloomberg reported late Friday that the US and Iran are edging closer to signing the MOU in Geneva as early as Sunday, potentially before the G7 summit begins Monday. If the Geneva signing occurs over the weekend, markets open Monday to the most powerful simultaneous catalyst combination of the war (a confirmed peace deal plus three central bank decisions across the week). The prior week delivered two competing narratives in a single session. May CPI printed at 4.2% YoY (the hottest reading since April 2023, effectively doubling the Fed’s 2% target). But the core monthly reading came in at only 0.2% (undershooting the 0.3% consensus and halving April’s pace). More than 60% of May’s 0.5% monthly increase came from energy alone. The DXY tagged the 100.00 handle in the minutes before the release, sold off 30 ticks on the soft core, then went vertical minutes later when Trump escalated military strikes on Iran. Gold’s week was the most dramatic single instrument episode of the entire fifteen-week series. Following IRGC strikes on Kuwait, Bahrain and Jordan, Gold lost more than 4% on Wednesday and touched a fresh 2026 low of $4,023 on Thursday. Then Trump called off strikes and claimed a deal was close. Gold surged 3.5% in a single session, recovering above $4,200 by Friday’s close. Wells Fargo’s FOMC preview is the most authoritative framework for Wednesday’s decision. They expect the theme of the meeting will be neutrality. Warsh will not be full-throated in favour of cutting rates. The easing phrase will be replaced with something more neutral. Wells Fargo believes the 2026 median dot should shift to 3.625% (removing the cut). The 2027 dots are the linchpin (if the Fed shows no cuts next year either, it signals a much tighter real rate without actually hiking).
Currencies
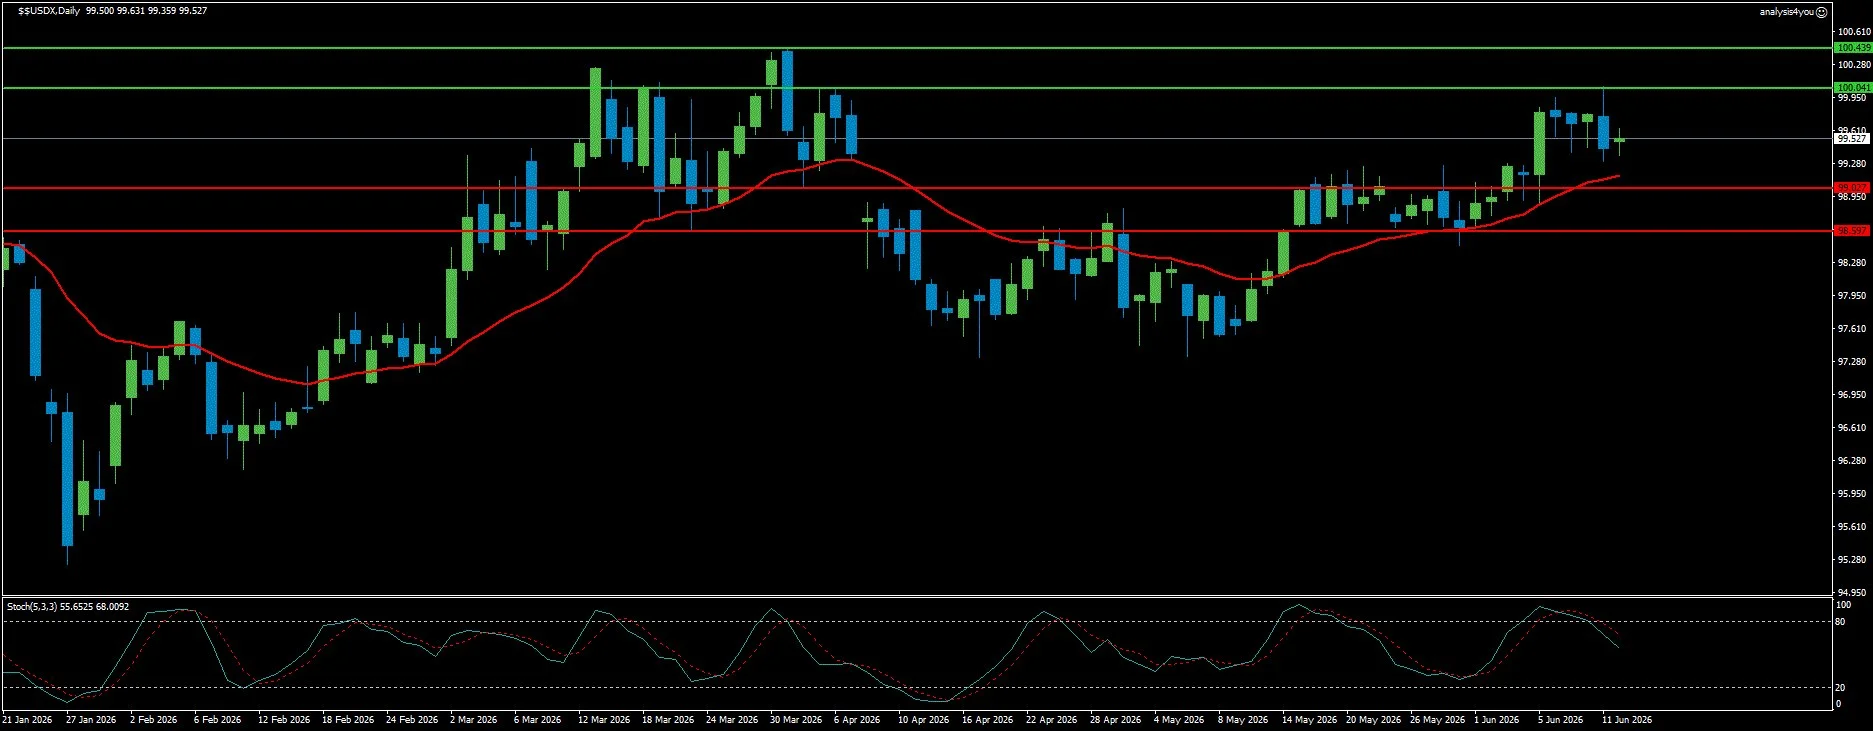
USD Index: Peace Deal Pulls Dollar Off Highs, FOMC Wednesday Is the Defining Catalyst (99.53)
Current Trend: Neutral to Bullish
Resistance: 100.04 | 100.44
Support: 99.03 | 98.60
The US Dollar consolidated in a tight range throughout the prior week (oscillating between 98.95 and 100.02), ending at 99.53. The May CPI split (4.2% headline but only 0.2% monthly core) initially provided a bearish catalyst, pulling DXY from 100.00 to session lows. But Trump’s renewed Iran strikes within hours reversed the move entirely. By Friday, peace deal optimism from the Bloomberg Geneva report pulled DXY modestly lower. The DXY is still above all three major moving averages but with the Stochastic decomposing from the deeply overbought 93.48/81.47 of last week to 55.65/68.09 this week. The FOMC on Wednesday is the week’s defining Dollar catalyst. Wells Fargo expects Powell to strike a neutral tone (easing bias removed, but no tightening bias declared). The dot plot shifting the 2026 median to 3.625% is broadly expected and should be a modest Dollar positive. The surprise risk is in the 2027 dots (if the Fed shows no cuts next year either, the real rate implication would be significantly hawkish). Conversely, if Waller emphasizes patience and data dependence, the Dollar could sell off. The FOMC release. The Geneva MOU signing over the weekend is the primary geopolitical Dollar headwind (a confirmed deal removes the war premium that has been the Dollar’s secondary engine for six weeks). Technically, DXY at 99.53 is above all three major MAs with price at upper Bollinger Bands. The Stochastic at 55.65/68.09 is mid-range in a downtrend with a bearish resistance at 100.04 / 100.44. Support at 99.03 / 98.60.
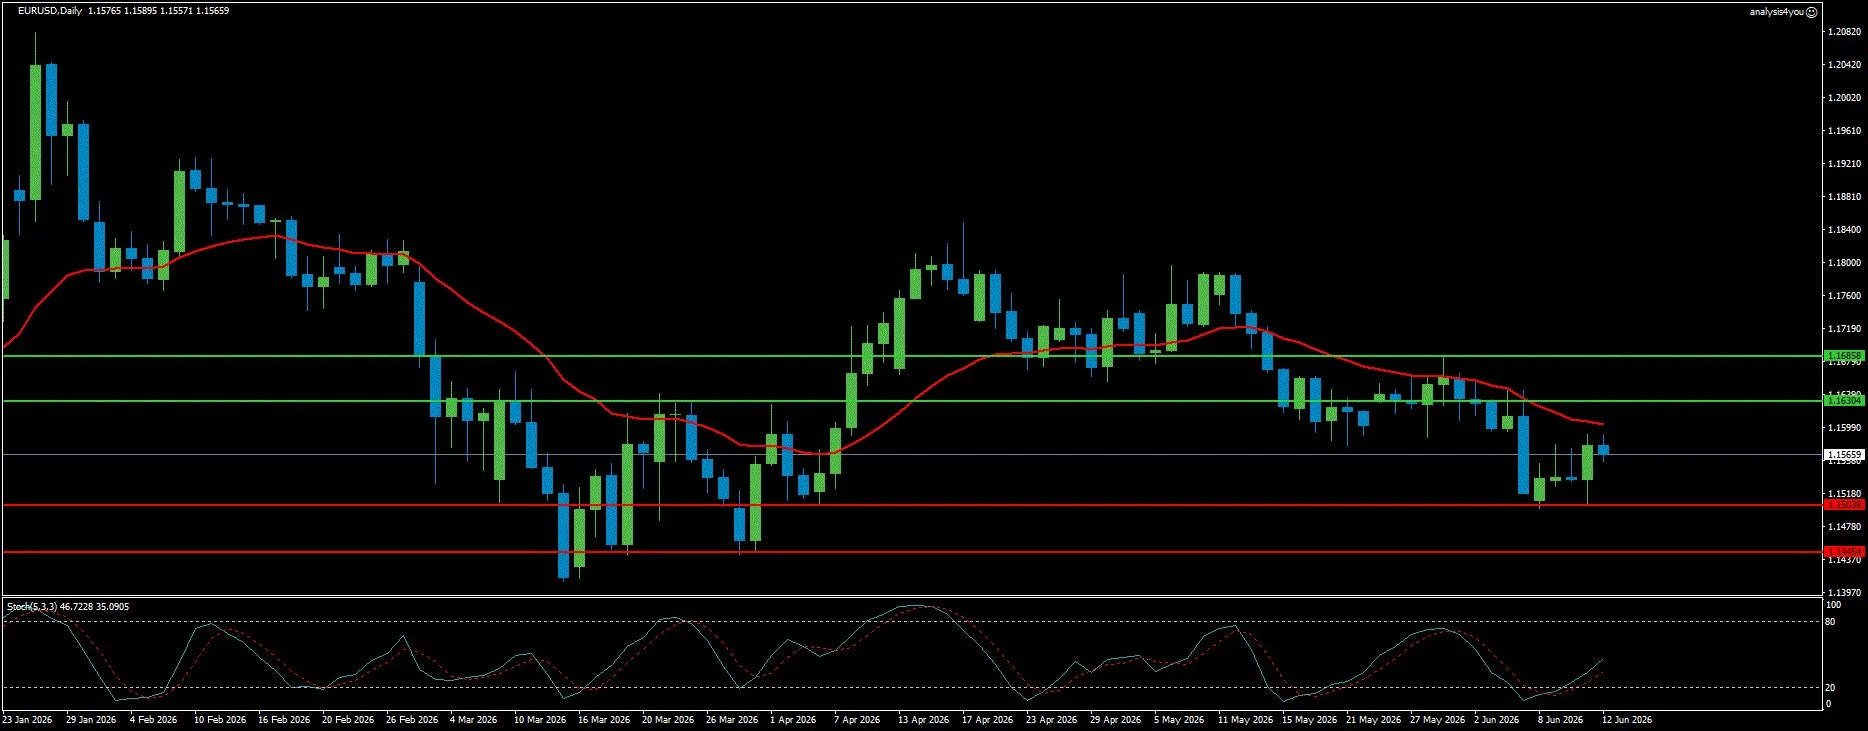
EUR/USD: ECB Hiked, Lagarde Hints at More, Recovery From 1.1499 Low (1.1566)
Current Trend: Neutral to Bearish
Resistance: 1.1630 | 1.1686
Support: 1.1504 | 1.1445
EUR/USD managed to close the week in positive territory despite trading as low as 1.1499 (its lowest since late March) before recovering to 1.1566. The ECB delivered the widely expected 25bp rate hike on Thursday June 12 (the first hike in three years). New ECB rates: deposit facility at 2.25%, main refinancing at 2.40%, marginal lending facility at 2.65%. ECB President Lagarde hinted at additional hikes amid broadening inflationary pressures while adding that growth risks are now skewed to the downside. The hike was mostly symbolic, having no real impact on the Euro, as it was fully priced. The fundamental picture for EUR/USD this week is shaped by the FOMC outcome on Wednesday and any Iran MOU developments. The daily chart shows EUR/USD with a bearish near-term bias as spot remains below the 20-, 100-, and 200-day SMAs. The RSI hovers in the low-40s. On the downside, first support emerges at the 1.1500 threshold, closely followed by the long-term static support area around 1.1470. Once below the latter, sellers are likely to add pressure toward 1.1400. Technically, EUR/USD is at 1.1566, with middle Bollinger Bands. The Stochastic at 46.72/35.09 is mid-range in an uptrend with a bullish signal. Resistance at 1.1630 / 1.1686. Support at 1.1504 / 1.1445.
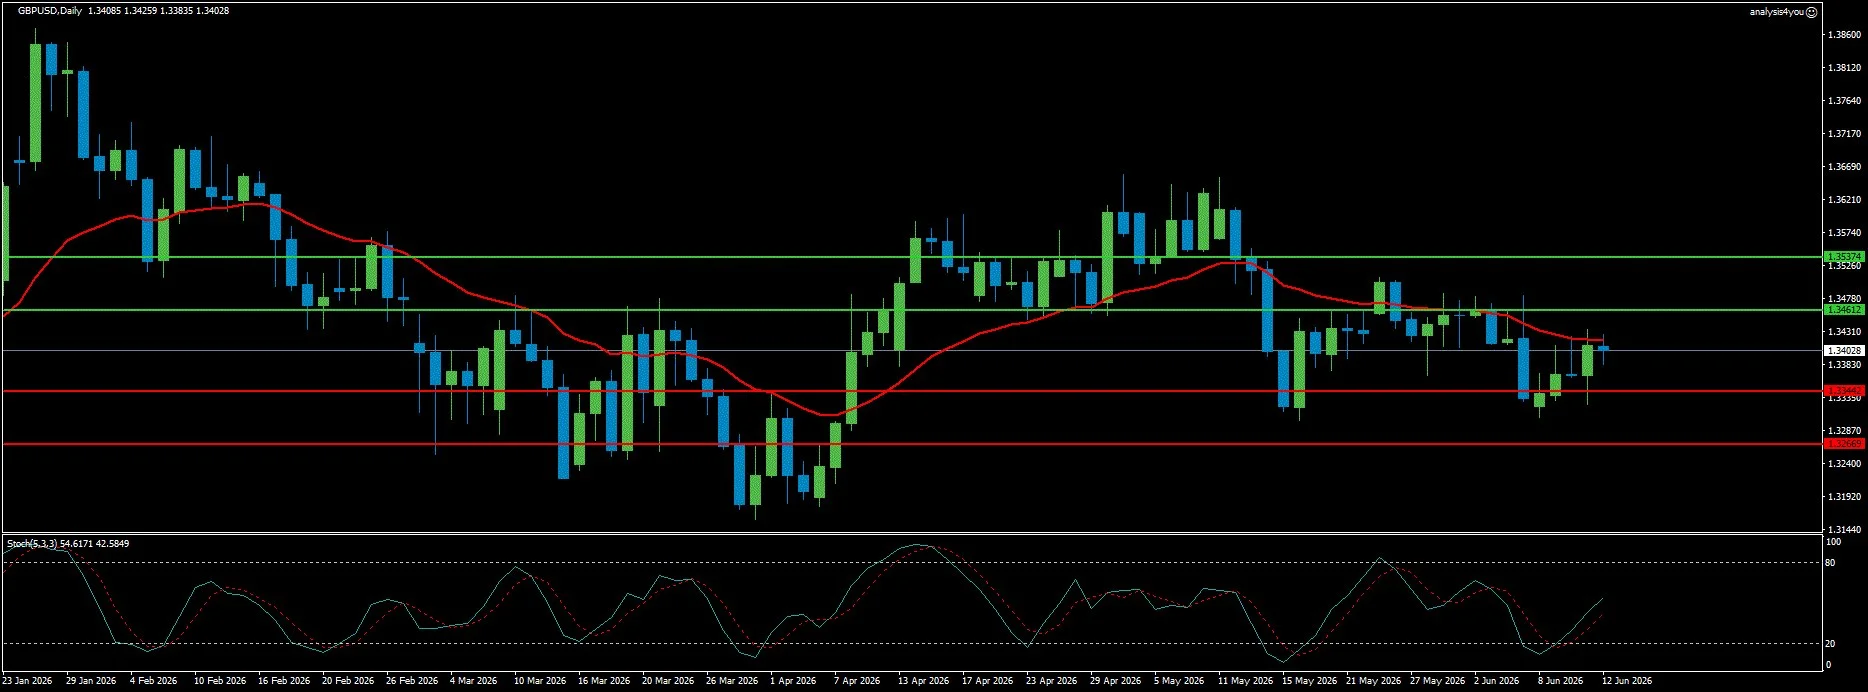
GBP/USD: Back Above 200-Day MA, BoE Holds June 18, By-Election Is the Wild Card (1.3403)
Current Trend: Neutral
Resistance: 1.3461 | 1.3537
Support: 1.3344 | 1.3267
GBP/USD recovered from the prior week’s crash low at 1.3334 back to 1.3403 (once again reclaiming the 200-day MA at approximately 1.3380 as support). The peace deal optimism and the soft US core CPI were the primary catalysts. The week ahead for GBP/USD is defined by three events that converge on Thursday June 18 in an unprecedented combination: the Bank of England monetary policy decision, the UK by-election where Andy Burnham could challenge Keir Starmer for the Labour leadership, and the start of the World Cup. Wells Fargo expects the BoE to leave Bank Rate on hold at 3.75%. The economy was subdued before the Middle East conflict, and policymakers had been expected to cut rates this year to support growth. That should keep the BoE cautious. Q1 GDP surprised to the upside at 0.6% QoQ, but April GDP fell 0.1% MoM. The BoE’s Inflation Attitudes Survey showed a sharp rise in year-ahead household inflation expectations to 4.0%. The by-election is the structural GBP wildcard. A Burnham win that triggers a genuine Labour leadership contest would be GBP-negative through the fiscal credibility discount (a repeat of the September 2022 Truss budget shock in slow motion). Technically, GBP/USD is at 1.3403, above the 200-day MA at approximately 1.3380. The Stochastic at 54.62/42.58 is mid-range in an uptrend with a bullish signal. Resistance at 1.3461 / 1.3537. Support at 1.3344 / 1.3267.
Stocks
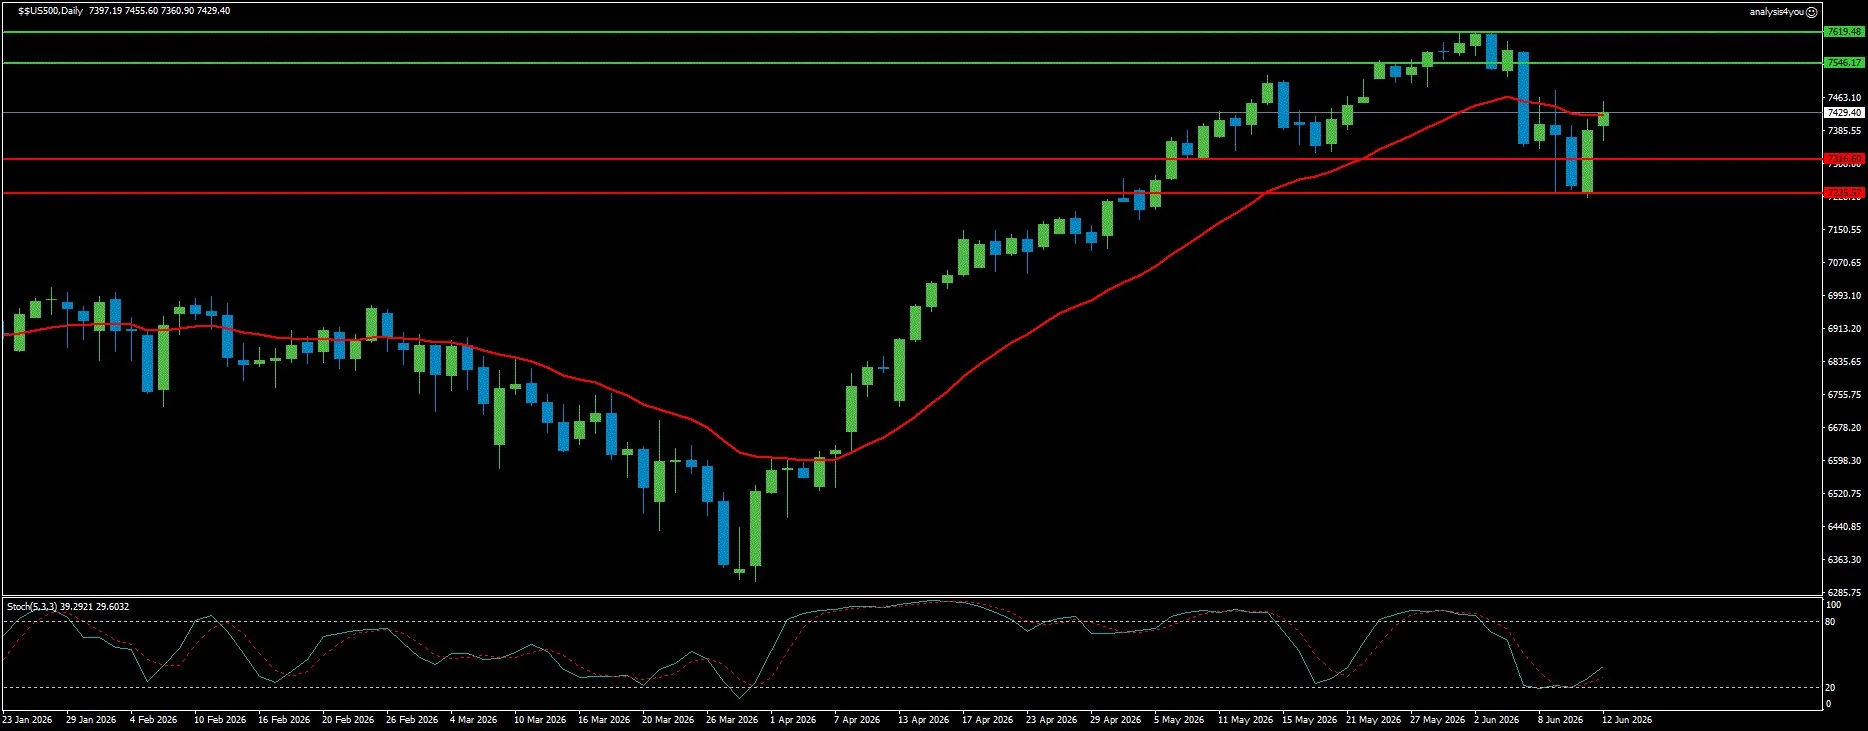
S&P 500: Post-Crash Consolidation, FOMC Wednesday Is the Defining Event (7,429)
Current Trend: Cautiously Bullish
Resistance: 7,546 | 7,619
Support: 7,317 | 7,236
The S&P 500 has staged a partial recovery from the June 5 NFP-driven crash back to 7,429. The index remains above all three major moving averages, confirming the nine-week bull run’s structural base has not been invalidated by the single-day 2.64% correction. The prior week’s delivered headwinds (May CPI at 4.2% YoY and Iran’s IRGC targeting US bases in Kuwait, Bahrain and Jordan) and tailwinds (the soft core CPI at 0.2% monthly, Trump calling off strikes Thursday). Wells Fargo’s FOMC preview is the critical equity framework. The easing bias removal at Wednesday’s meeting is broadly expected (if Warsh delivers exactly this, equities are likely to rally on the no-surprise outcome). The risk is in the dot plot: if the 2027 dots show no cuts, equities could reprice lower on the hawkish signal. If Warsh emphasises the supply-driven nature of inflation and the soft core print (0.2% monthly), equities rally strongly as the rate hike premium partially unwinds. Despite the single-day crash, the US economy continues to display remarkable resilience: 100 days into the oil shock. ISM Manufacturing at 54 and ISM Services at 54.5 both point to continued growth. University of Michigan Consumer Sentiment rose to 48.9 in June from 44.8 in May (the first improvement in months). Technically, the S&P 500 is at 7,429, above all three MAs. The Stochastic at 39.29/29.60 is mid-range in an uptrend with a bullish signal. Resistance at 7,546 / 7,619. Support at 7,317 / 7,236.
Commodities
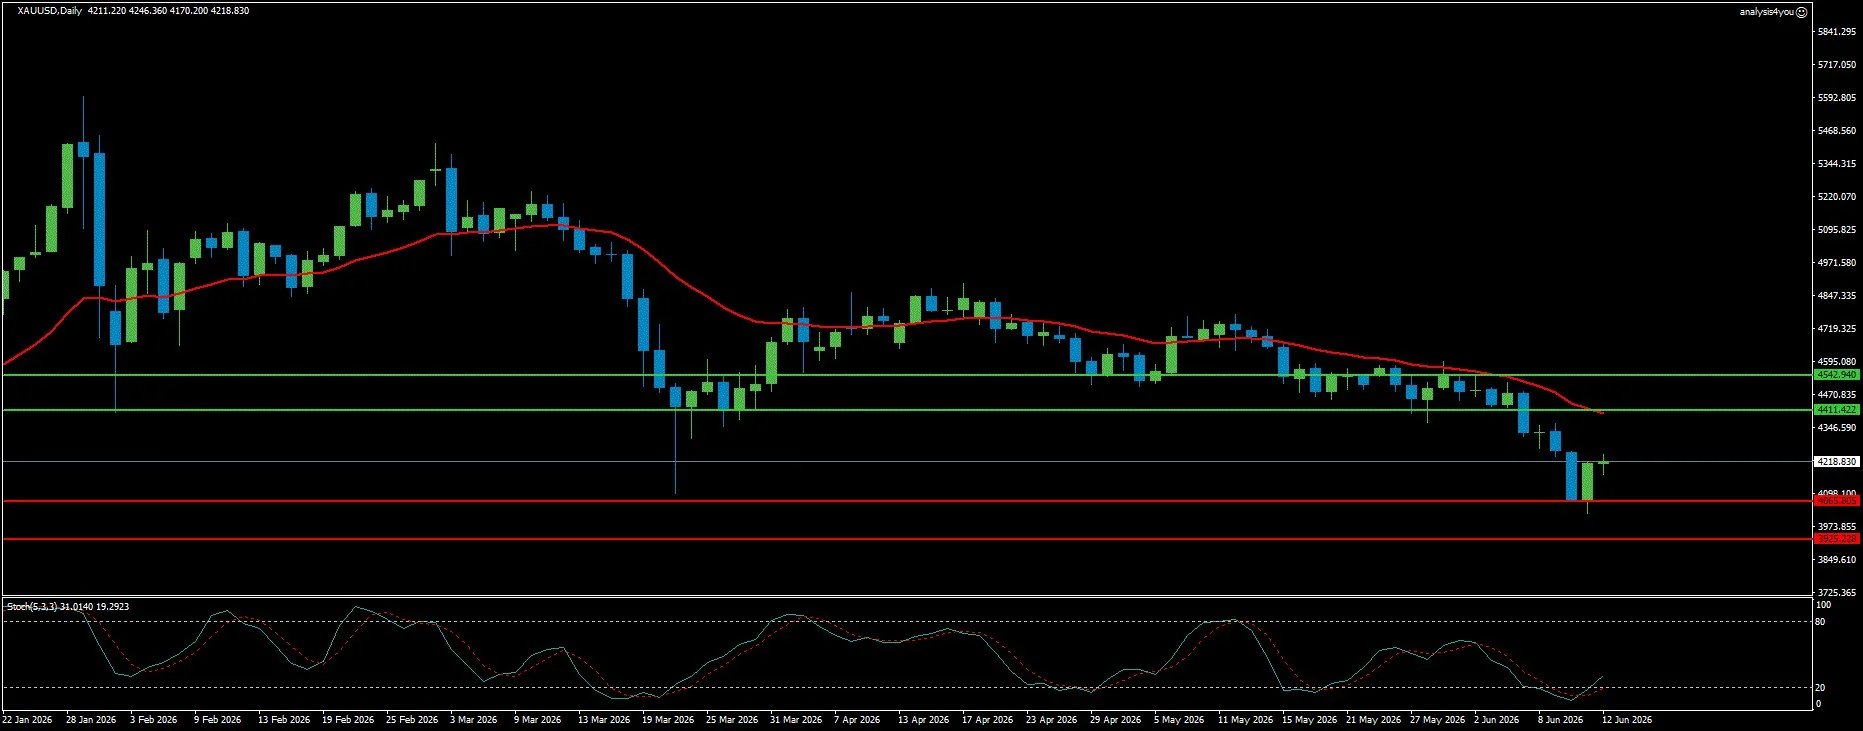
Gold: $4,023 War Low Held, Rebound Confirmed, FOMC Dot Plot Is Next Direction (4,219)
Current Trend: Cautiously Bullish
Resistance: 4,411 | 4,543
Support: 4,066 | 3,925
Gold survived the most terrifying week of the entire war for the precious metal. The $4,023 intraday low (reached during Asian trading hours on Thursday) represents the closest Gold came to the $4,000 psychological floor. The sequence that produced it was the most intense military escalation of the war: IRGC strikes on Ali Al Salem Air Base in Kuwait, US retaliation against nearly 20 targets in Iran, IRGC counterstrikes on US forces in Bahrain and Jordan. Gold lost more than 4% on Wednesday, then reversed 3.5% on Thursday when Trump called off the strikes. Gold recovered sharply after touching a fresh 2026 low near $4,000 but is not out of the woods yet. The RSI indicator remains well below 40 after recovering from oversold territory, suggesting the latest rebound appears to be a correction rather than a bullish reversal. The FOMC Wednesday dot plot is now the most important scheduled catalyst for Gold direction. If the SEP shows that multiple policymakers project two or more rate hikes this year, Treasury yields could push higher and trigger another leg lower. Conversely, a dovish SEP could open the door for a rally. A confirmed Iran MOU this weekend would immediately revive the oil-down, inflation-down, rate-cut-expectations-up scenario and be powerfully Gold-bullish. If the MOU is signed before the Fed meeting, Warsh’s remarks could turn dovish in anticipation of a steady decline in inflation. Technically, Gold is at 4,219. The Stochastic at 31.04/19.29 is approaching oversold in an uptrend with a bullish signal. Resistance at 4,411 / 4,543. Support at 4,066 / 3,925.
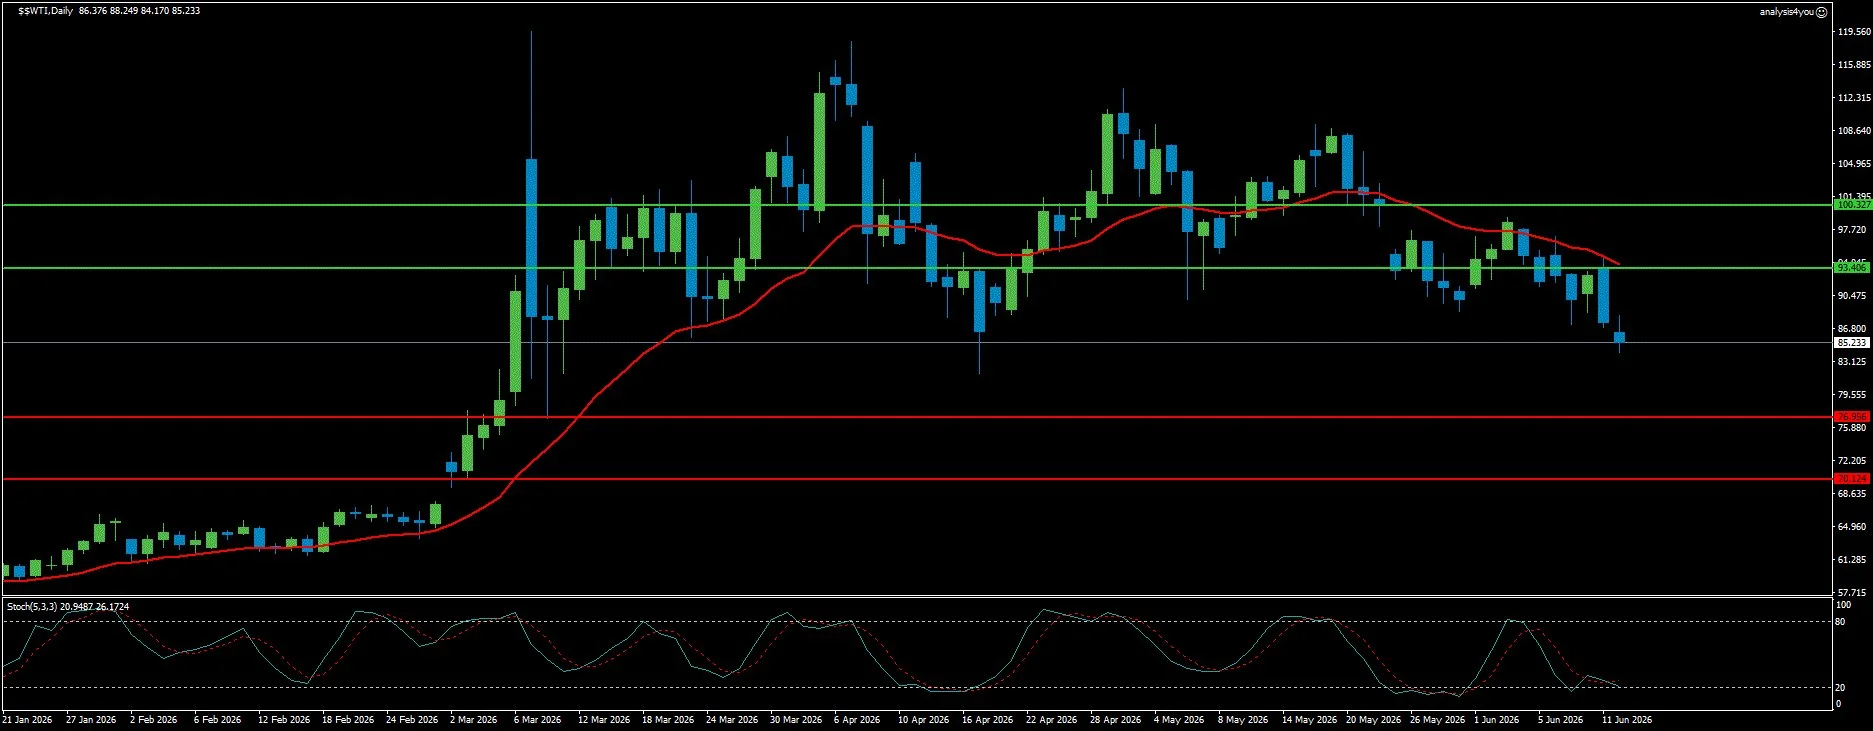
WTI Crude Oil: Peace Deal Pricing Accelerates, Geneva Sunday Is Most Explosive Catalyst (85.23)
Current Trend: Bearish
Resistance: 93.41 | 100.33
Support: 76.96 | 70.12
WTI crude oil has experienced its most decisive weekly breakdown since the first MOU announcement six weeks ago (from the re-escalation high near $96 to $98 down to $85.23 by Friday), driven by Trump calling off strikes and the Bloomberg Geneva MOU report. The peace deal pricing has now removed approximately $15 from WTI in a single week. If the Geneva MOU is signed Sunday before the G7 summit, WTI could open Monday with a gap toward $76.96. The most important structural insight: energy rose 3.9% in May after 3.8% in April (the energy component of CPI is still running hot because the oil price at the time of the CPI measurement period was still elevated). If WTI falls to $80 to $85 (current trajectory on peace deal pricing), June CPI’s energy component could fall sharply (potentially the first genuine CPI deceleration of the war). This matters enormously for the FOMC: a lower June CPI would validate the soft core argument and reduce the case for rate hikes. However, even with a signed MOU, full Hormuz flows will not return before Q1 to Q2 2027. The risk premium may be coming out of the market faster than the physical supply can be restored. Technically, WTI is at $85.23, with two consecutive lower Bollinger Band bars. The Stochastic at 20.95/26.17 is deeply oversold in a downtrend with a neutral signal. Resistance at 93.41 / 100.33. Support at 76.96 / 70.12.
Crypto
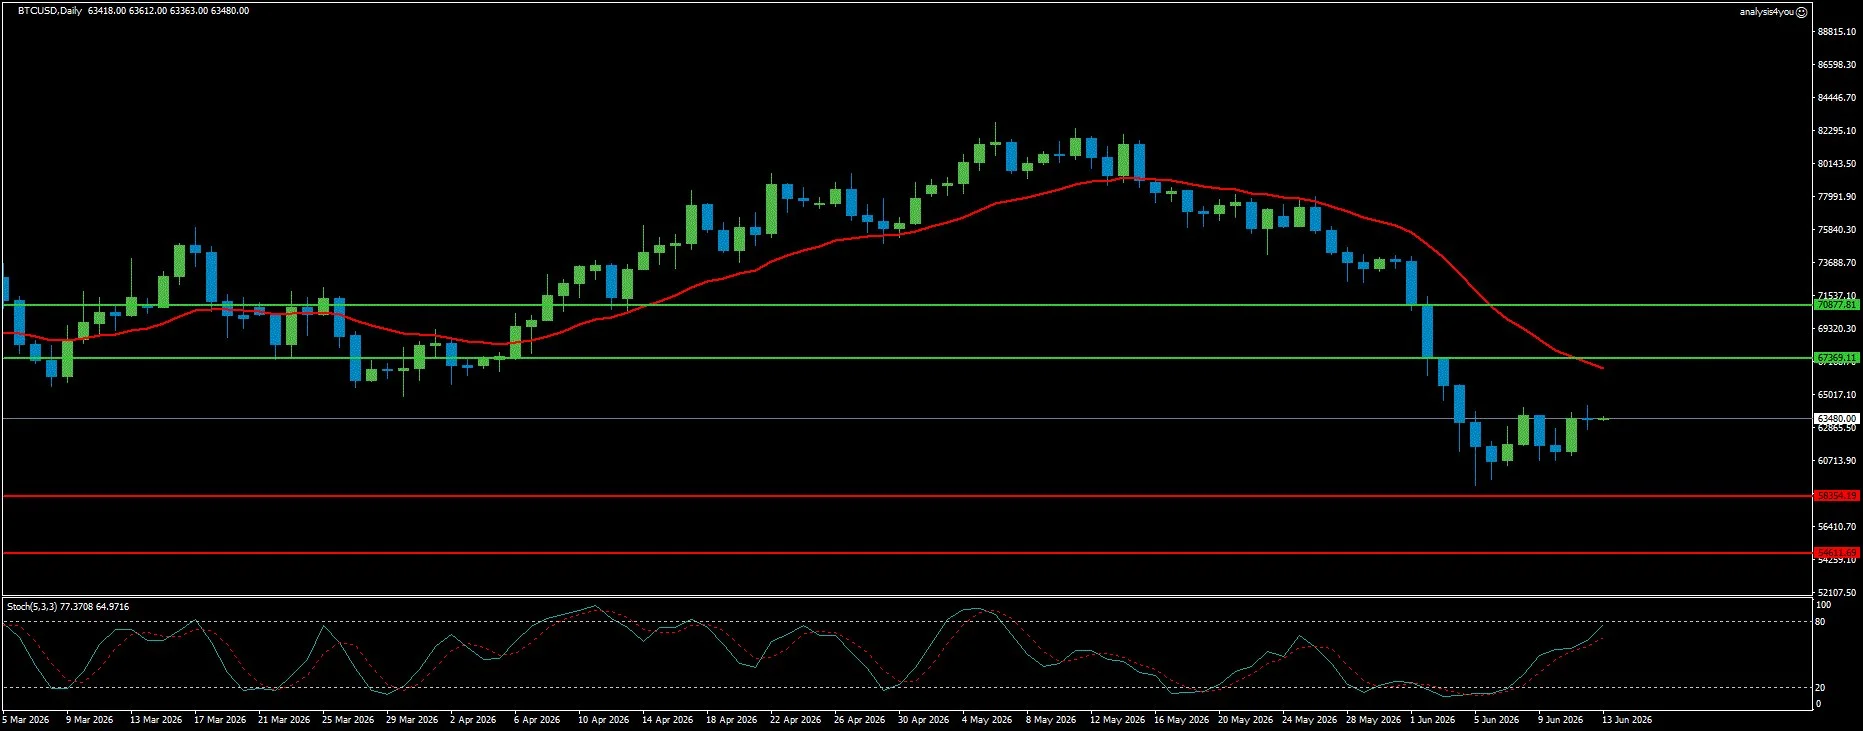
Bitcoin: 200-Week SMA Held, Bottom-Building Phase, ETF Outflows Decelerating (64,473)
Current Trend: Cautiously Bullish
Resistance: 69,818 | 74,003
Support: 58,354 | 54,612
Bitcoin has staged a meaningful recovery from the $59,130 bear market low back to $64,473. The 200-week SMA at approximately $62,023 provided the critical technical floor that held, reversing the decline that had briefly taken BTC below $60,000. CryptoQuant confirmed BTC declined to a fresh bear market low of $59,130 and is now only 9% above its realised price of $53,600 (a valuation level historically associated with bear market bottoms across prior cycles). The most important institutional signal of the week is the dramatic deceleration in ETF outflows. After four consecutive weeks of over $1 billion in weekly outflows ($709M, $1.15B, $1.30B, $1.40B), this week’s ETF outflow through Thursday was only $401.69 million (less than a third of the prior week). This marks the first week that ETF outflows have materially decelerated since the institutional sell-off began in mid-May. Strategy reaffirmed its commitment by acquiring 1,550 BTC on Monday, bringing total holdings to 845,256 BTC. The bottom may be near in terms of price level, but a regime change into a bull market requires a constructive demand recovery (a condition not yet visible in the data). The FOMC Wednesday dot plot is the primary macro catalyst. A neutral-to-dovish outcome would reduce rate hike expectations and improve risk appetite (directly supportive for Bitcoin). The Geneva MOU signing would be the most powerful Bitcoin positive. Technically, BTC is at $64,473, with middle Bollinger Bands. Stochastic in an uptrend with a bullish signal. The 200-week SMA at $62,023 is the critical support. Resistance at $69,818 / $74,003. Support at $58,354 / $54,612.
Key Events (June 15-19, 2026)
Weekend (June 13-15): Bloomberg reported US and Iran are edging closer to signing the MOU in Geneva as early as Sunday. If signed, Monday’s Asian open will gap across all markets simultaneously.
Monday, June 16: G7 Summit begins. China May Retail Sales and Industrial Production. Markets open processing the weekend’s Iran MOU news.
Tuesday, June 17: Bank of Japan monetary policy decision (25bp hike to 1.00%, 97% probability). US May Housing Starts.
Wednesday, June 18: FOMC Rate Decision (THE WEEK’S DEFINING MARKET EVENT). Warsh chairs his first meeting. Rate expected unchanged at 3.50% to 3.75%. SEP and dot plot are the critical read. 2026 median dot expected at 3.625%. 2027 dots are the linchpin. May US Retail Sales. UK May CPI (expected 3.0% to 3.1% YoY).
Thursday, June 19: Bank of England Rate Decision (expected hold at 3.75%). June 18 UK by-election result will be known by morning. BoE Governor Bailey’s post-decision press conference. UK Average Weekly Earnings April.
Friday, June 20: Quadruple witching in US markets. Additional Fed and ECB speakers. Iran MOU implementation news continues.
Week Ahead Outlook
The week of June 15 to 19 may be remembered as the week when the Iran war’s market impact reached its decisive inflection point.
Scenario 1: Geneva MOU Signed + Neutral FOMC + BoJ Hikes + BoE Holds (approximately 30%): MOU formally signed Sunday. WTI gaps lower Monday toward 76.96. Warsh delivers neutral tone (easing bias removed, no tightening bias, 2026 median dot at 3.625%, 2027 shows modest cuts). BoJ hikes 25bp. BoE holds. DXY reverses toward 99.03 then 98.60. EUR/USD breaks above 1.1630 toward 1.1686. GBP/USD extends above 1.3461. Gold surges above $4,411. BTC breaks above $67,369 toward $69,818. S&P 500 surges toward 7,546 and 7,619.
Scenario 2: MOU Stalls + Neutral FOMC + Partial Risk-On (approximately 40%): Geneva signing delayed. WTI holds $85 to $93 range. Warsh delivers neutral FOMC as expected. BoJ hikes 25bp. BoE holds. DXY consolidates 99.03 to 100.04. EUR/USD holds 1.1504 to 1.1630. GBP/USD holds 1.3344 to 1.3461 (by-election result adds volatility). Gold holds $4,066 to $4,411 range. BTC holds $62,023 to $67,369. S&P 500 holds 7,317 to 7,546. This is the most likely base case.
Scenario 3: MOU Collapses + Hawkish FOMC + Re-Escalation (approximately 30%): Geneva talks collapse. Trump orders fresh strikes. WTI spikes back above $93.41. Warsh delivers hawkish dot plot surprise. DXY breaks above 100.04 toward 100.44. EUR/USD breaks below 1.1504. GBP/USD breaks below 1.3344. Gold $4,023 war low retested. BTC breaks below $62,023 toward $58,354. S&P 500 falls below 7,317 toward 7,236.
Bottom Line: Fifteen weeks into the Iran war, the market stands at the most consequential single week of the entire conflict. The Geneva MOU (if signed) removes the war premium that has been simultaneously the primary inflation driver, the primary rate hike catalyst, the primary Dollar support, the primary Gold headwind, and the primary equity risk. The oil price crash that a signed MOU would trigger reduces June CPI’s energy component, potentially softening July’s inflation reading and giving Warsh the data-dependent patience cover that Wells Fargo expects him to emphasise. That repricing (if it begins this week) would be the most important medium-term market development since the war began on February 28.

