2026 Market Outlook: Transition Year or New Bull Cycle? | Annual Forecast

Market Overview: A Year of Transition, Not Capitulation
As 2025 draws to a close, global markets stand at a crossroads. The US Dollar has lost nearly 10% of its value after years of outperformance. Gold surged over 60% to set more than 50 record highs, Bitcoin experienced extreme volatility with a new all-time high of $126,199 before correcting 30%, while stocks rebounded strongly in the latter half of 2025. Looking ahead to 2026, markets face a complex landscape shaped by monetary policy divergence, geopolitical uncertainty, and structural economic shifts. This is less about calling the end of any asset’s dominance and more about navigating selective opportunities in a world where growth is rebalancing and policy is transitioning.
Currencies
US Dollar: Moderate Softening Expected, But No Collapse
2026 Outlook: Bearish Transition Key Drivers: Fed Policy, Fiscal Concerns, Positioning
The US Dollar enters 2026 at a crossroads after shedding nearly 10% in 2025. The conditions that drove sustained USD strength—aggressive Fed tightening, US growth outperformance, and global risk aversion—are eroding but not collapsing. The base case for 2026 points to moderate Dollar softening as interest-rate differentials narrow and global growth becomes less asymmetric. However, the Fed is expected to move cautiously toward policy easing rather than aggressive cuts, with sticky services inflation, a resilient labor market, and expansionary fiscal policy arguing against rapid normalization. Markets currently price in two rate cuts in 2026 (63 basis points), though the Fed’s own dot plot suggests only one more cut to 3.4%.
Fiscal dynamics present a familiar complication. Large deficits and rising debt issuance raise questions about sustainability, yet demand for US assets remains strong due to liquidity, yield, and the absence of credible alternatives. The approaching midterm elections in November 2026 and potential government shutdowns inject short-term volatility. From a positioning standpoint, USD net shorts sit at multi-year highs, creating a one-sided market where the hurdle for sustained downside rises while short-covering rallies become more likely. Geopolitical tensions—Middle East instability, Ukraine war continuation, fragile US-China relations—provide recurring safe-haven support. Fed Chair Powell’s term expires in May 2026, adding uncertainty about potential dovish leadership shifts.
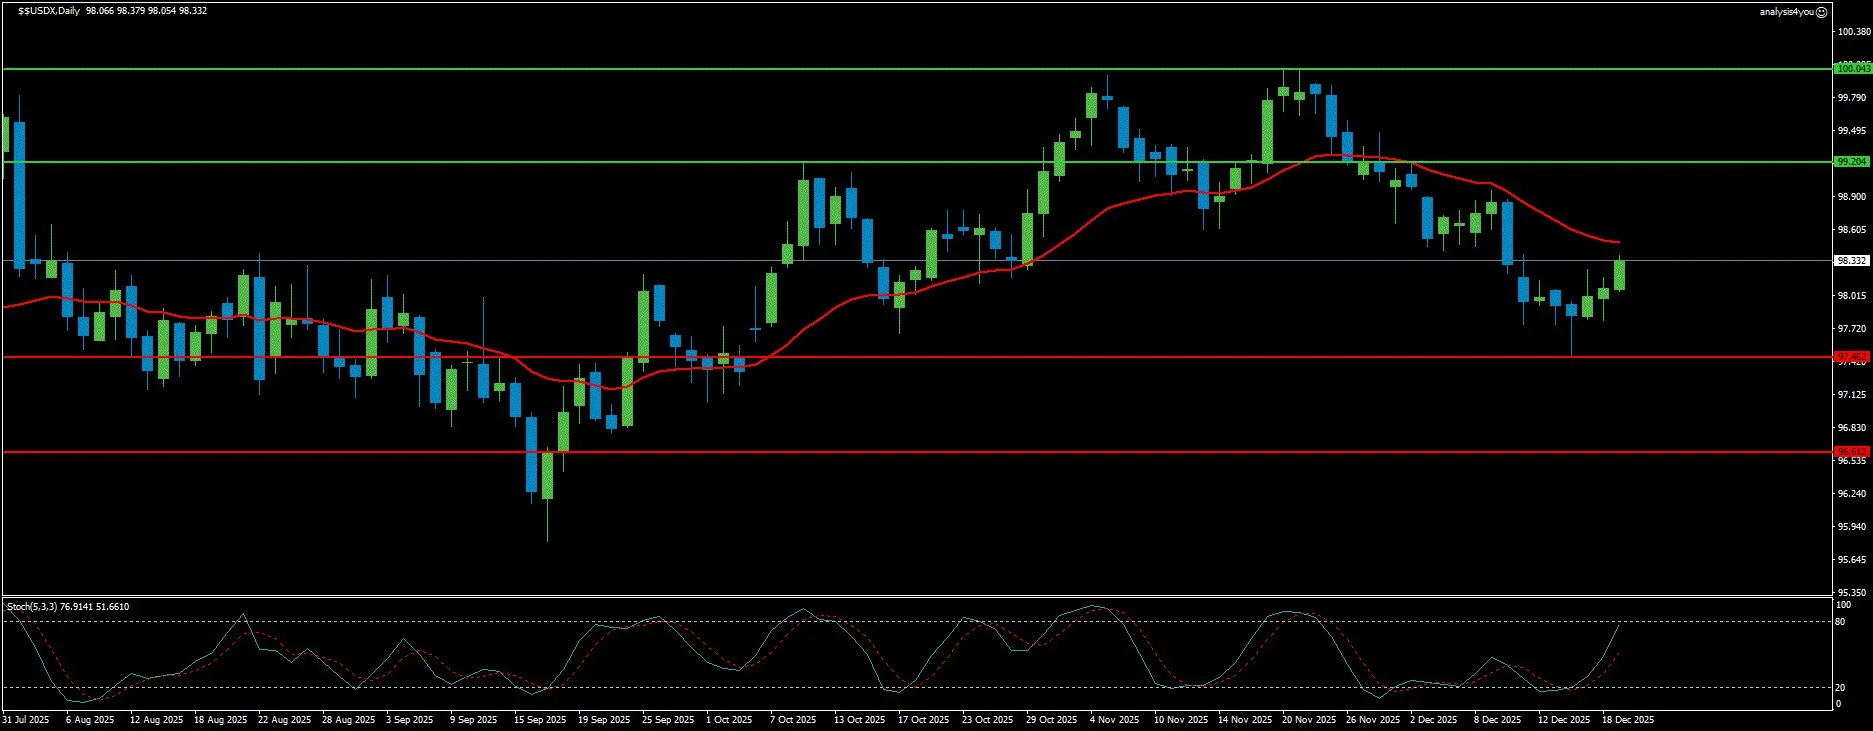
Technical analysis shows the DXY Index remains above pre-pandemic levels, with first major support at 96.30 (three-year lows), then the 200-month moving average near 92.00. Upside resistance sits at the 100-week MA near 103.40, with the 110.00 area and post-pandemic peak of 114.80 marking key levels if risk-off sentiment returns.
2026 Forecast Range: DXY 94.00-103.00 | Probability: 60% moderate decline, 25% bullish reversal, 15% deeper correction
Potential Resistance: 99.20; 100.04
Potential Support: 97.46; 96.61
GBP/USD: Bullish Structure Intact Despite Headwinds
2026 Outlook: Cautiously Bullish Key Drivers: Fed-BoE Policy Divergence, UK Economic Data, Political Volatility
GBP/USD wrapped up 2025 roughly 6.5% higher after a volatile journey from 15-month lows of 1.2100 in January to nearly four-year highs of 1.3789 in July. The Pound capitalized on intense Dollar weakness as Trump’s tariff threats and US asset sell-offs fueled a “Sell America” scenario. The pair found additional support from growing expectations of Fed-BoE monetary policy divergence, with markets predicting limited UK rate cuts compared to more aggressive Fed easing.
However, 2026 presents headwinds. The BoE cut rates by 100 basis points in 2025, bringing the Bank Rate to 3.75%, its lowest since January 2023. Governor Bailey’s December comments that further easing will be a “closer call” as rates approach neutral (estimated 2-4%) have markets pricing only one-and-a-half cuts in 2026. Goldman Sachs expects cuts in March, June, and September to 3.00%, while Deutsche Bank forecasts two cuts ending at 3.25%.
UK economic data disappoints: GDP contracted or flatlined from August-October 2025, the trade deficit widened to £6.7bn, and unemployment rose to 5.1%. However, annual CPI inflation fell sharply to 3.2% in November from 3.6%, below the BoE’s 3.4% forecast, potentially allowing for more cuts. The BoE projects zero Q4 GDP growth and expects inflation to revert toward 2% more quickly in the near term.
Political volatility remains a key risk. Labour Together’s survey of alternative leadership options has sparked speculation about PM Keir Starmer’s position ahead of the May 2026 local elections. Chancellor Reeves’ tax increase plans and fiscal pressure could weigh on sentiment, though her budget may have reduced near-term uncertainty.
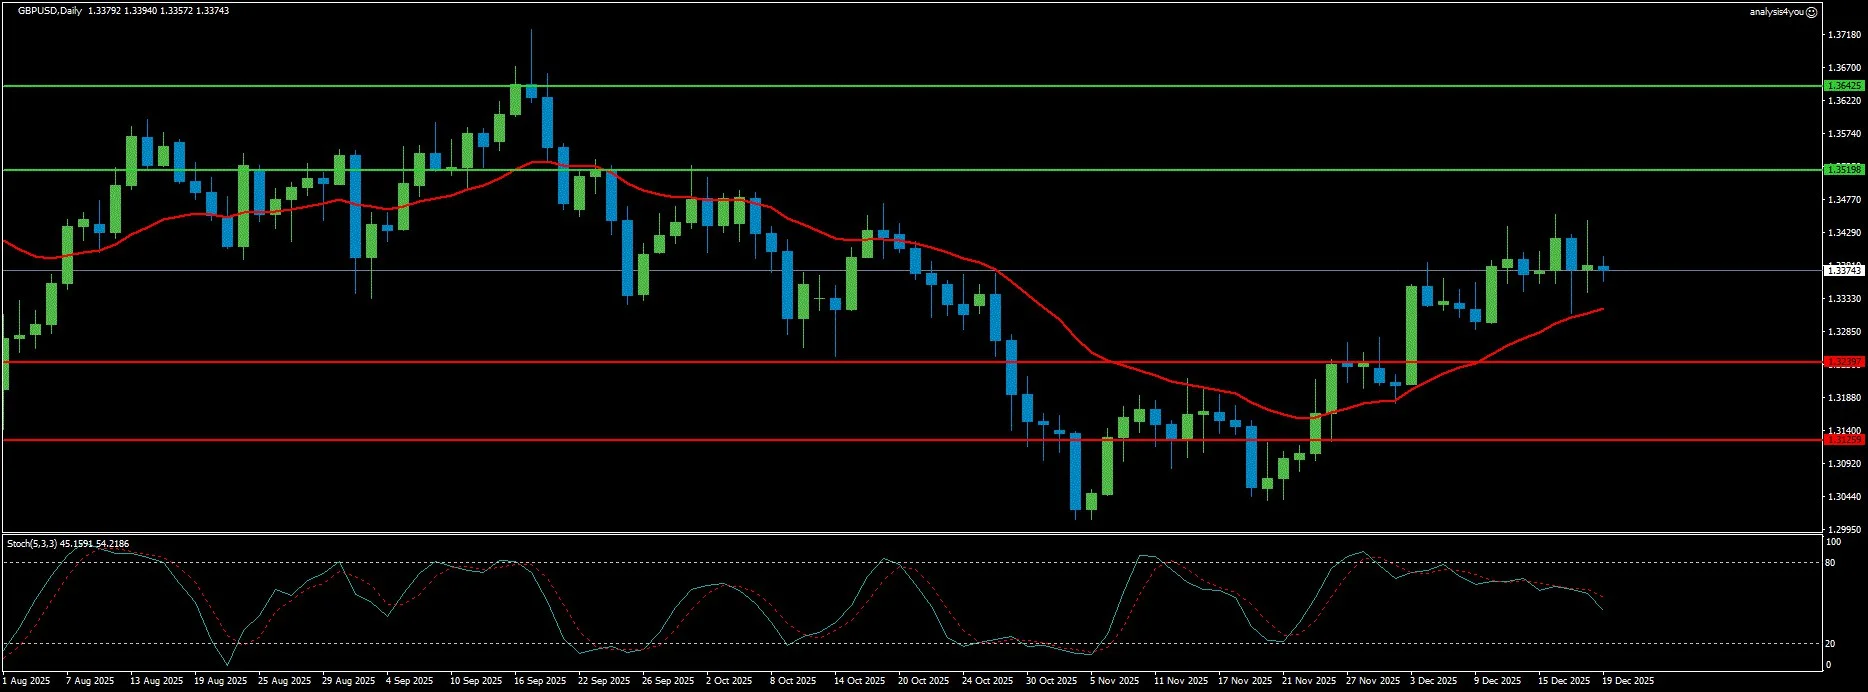
The monthly technical setup paints a bullish picture, with an ascending triangle formation suggesting upside potential. The pattern’s horizontal resistance at 1.3785 represents the key breakout level, with targets toward the 200-month SMA at 1.4142 and the psychological 1.4000 mark. Downside risks include the rising trendline near 1.3100 and confluence support at 1.3030-1.2960, where the 21- and 100-month SMAs align.
2026 Forecast Range: 1.3000-1.4200 | Fed-BoE divergence expectations likely to outweigh UK economic softness
Potential Resistance: 1.3520; 1.3643
Potential Support: 1.3240; 1.3126
EUR/USD: Policy Divergence and Growth Concerns in Focus
2026 Outlook: Neutral to Slightly Bearish Key Drivers: ECB Rate Cuts, Eurozone Growth, US Fiscal Policy
EUR/USD ended 2025 trading around 1.1730 after fluctuating throughout the year. The ECB left rates unchanged at its December meeting but revised economic growth forecasts upward to 1.4% in 2025, 1.2% in 2026, and 1.4% in 2027. However, President Lagarde’s acknowledgment that they “can’t offer forward guidance” given uncertainty, combined with close attention to Euro appreciation, signals caution.
The ECB is widely expected to deliver a 25-basis-point rate cut to 2.25% in early 2026—potentially the last cut of the year—driven by persistently low inflation and concerns over US tariffs. This contrasts with the Fed’s more cautious approach, creating policy divergence that could pressure the Euro. Europe’s deeper structural challenges—weak trend growth, limited fiscal flexibility, and earlier central bank easing than the US—cap upside potential.
US-Eurozone trade tensions add uncertainty. Trump’s threat of 50% tariffs on EU goods (later extended to July 9) and continued trade friction could weigh on European exports and economic sentiment. German 10-year Bund yields have declined toward 2.50%, while US yields remain elevated, maintaining a negative yield differential for the Euro.
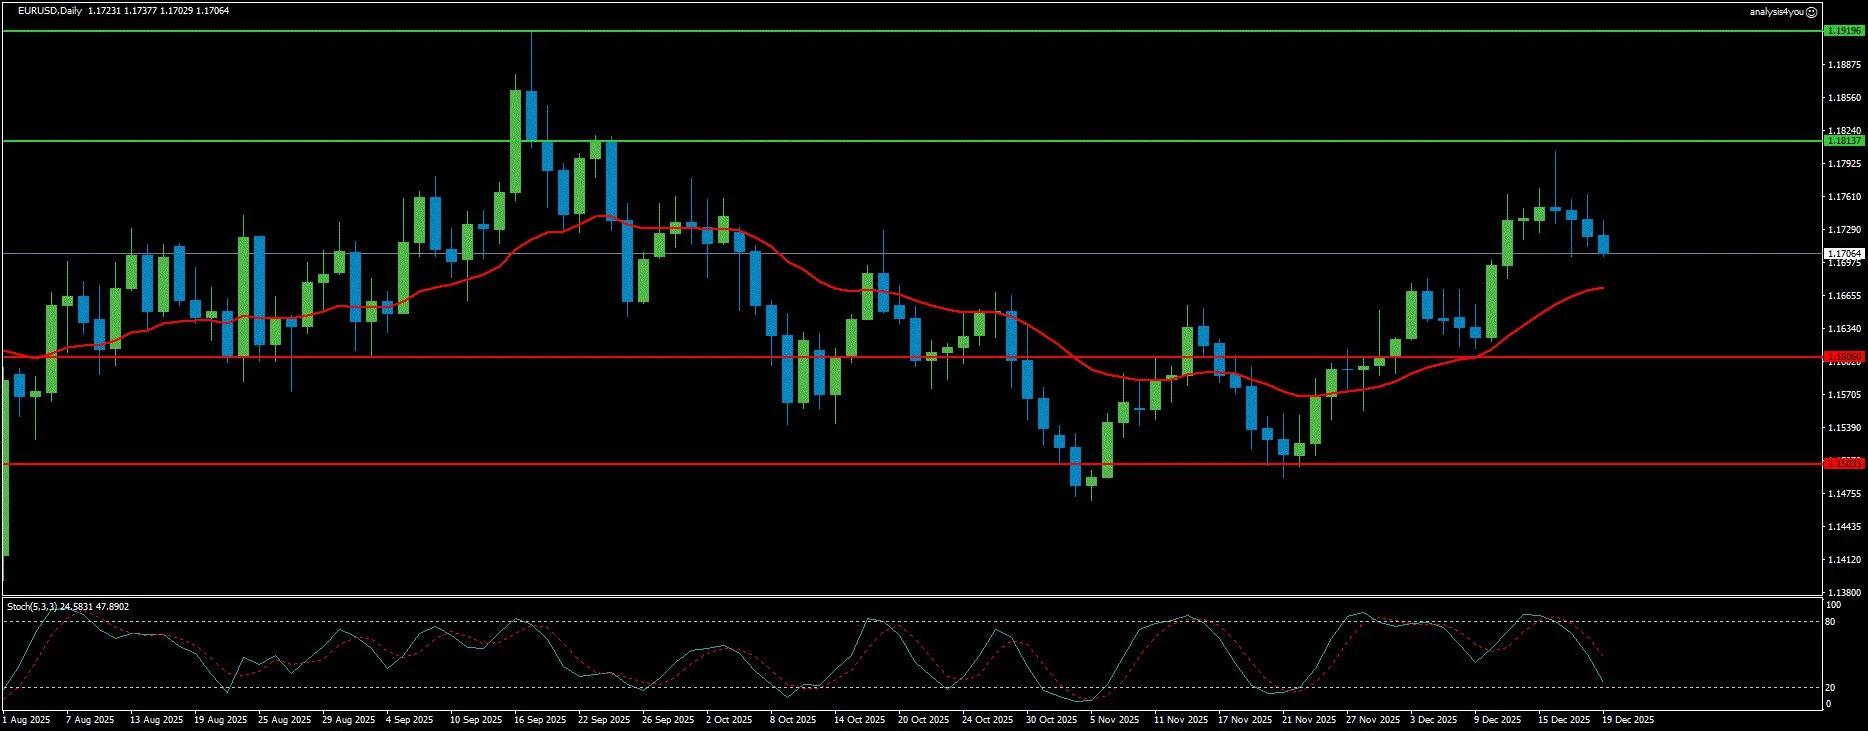
Technical indicators show the 20-period SMA flattening at 1.1738, capping near-term upside, while the RSI sits at 46, below the midline, pointing to subdued momentum. The pair trades within an ascending regression channel, with the mid-point at 1.1765 acting as immediate resistance.
2026 Forecast Range: 1.1000-1.2000 | Eurozone structural issues and ECB dovishness likely to limit sustained rallies
Potential Resistance: 1.1814; 1.1920
Potential Support: 1.1606; 1.1503
Commodities
Gold: Record Highs Possible But 2025-Like Rally Unlikely
2026 Outlook: Bullish (Moderate) Key Drivers: Fed Policy, Geopolitics, Central Bank Demand
Gold delivered one of its strongest annual performances since the late 1970s in 2025, setting over 50 record highs and rising more than 60%. The precious metal hit an all-time high of $4,381 in October before correcting to around $4,280 by year-end. The rally was fueled by trade war fears, geopolitical instability (Israel-Iran tensions, Russia-Ukraine conflict), central bank buying, and Fed rate cuts totaling 75 basis points.
Looking to 2026, the most likely scenario is moderate sideways action with gradual gains rather than another explosive rally. The Fed is expected to remain dovish to support the labor market but will avoid aggressive cuts unless inflation drops significantly to pre-pandemic levels. If other major central banks (ECB, BoJ, BoE) adopt neutral or hawkish stances, the Dollar may remain weak alongside falling Treasury yields, supporting Gold, though capital could also flow to EUR and GBP.
Central bank demand remains a key pillar. China and emerging economies are likely to remain net buyers of Gold reserves, continuing the trend that saw China’s holdings rise throughout 2025. The World Gold Council notes that “forces of softer growth, accommodative policy, and persistent geopolitical risks are more likely to support Gold than undermine it.”
The bullish scenario ($4,900-$5,000 targets) requires aggressive Fed easing, deteriorating US labor market conditions, stable inflation, and escalating geopolitical tensions. Goldman Sachs forecasts $4,900 by end-2026, while Bank of America raised its target to $5,000 with a $4,400 average, citing unorthodox White House policies, fiscal deficits, and intentions to reduce the current account deficit while pushing for rate cuts with 3% inflation.
The bearish scenario (deep correction below $3,500) appears unlikely but would require much stronger-than-expected US economic performance, labor market recovery faster than current conditions suggest, and a return of inflation that delays Fed easing indefinitely. A significantly improved geopolitical landscape—lasting Middle East peace and Russia-Ukraine settlement—combined with improving global growth, could also reduce safe-haven demand.
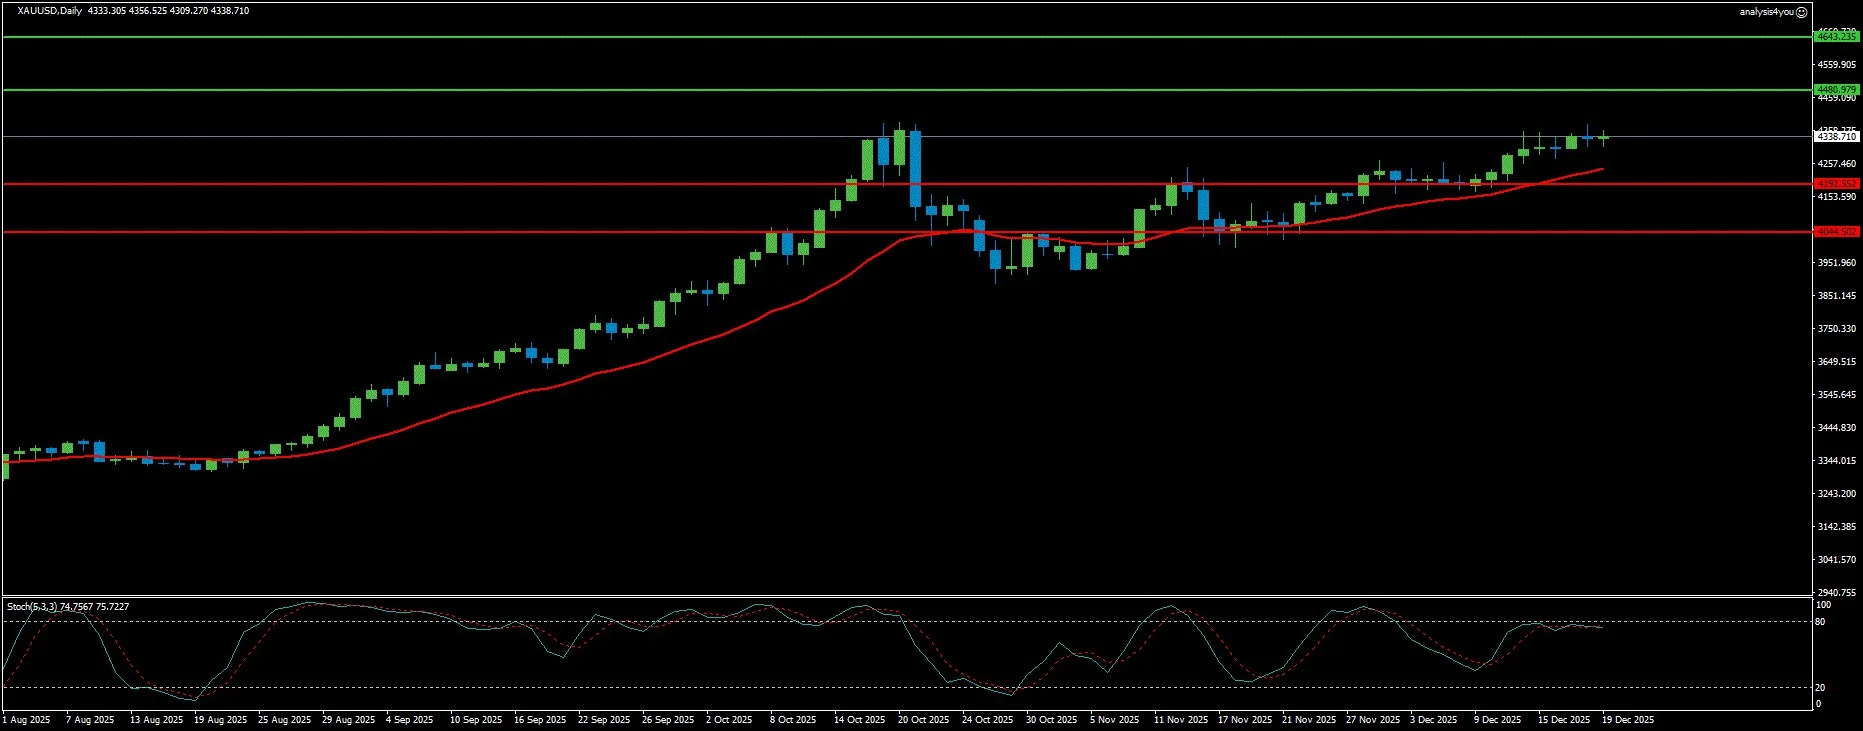
Weekly technical analysis shows Gold holding above the upper limit of a 14-month ascending channel with the RSI above 70, suggesting overbought conditions that hint at potential correction before uptrend continuation. First support appears at $3,900 (channel mid-point, 20-week SMA), then $3,575 (channel lower limit) and $3,435 (50-week SMA). Breaking below the channel could open downside toward $3,200, then $3,000. Upside, clearing the $4,381 record could target the psychological $5,000 level.
2026 Forecast Range: $3,800-$4,900 | New highs possible but volatility likely elevated
Potential Resistance: 4480.98; 4643.23
Potential Support: 4192.55; 4044.50
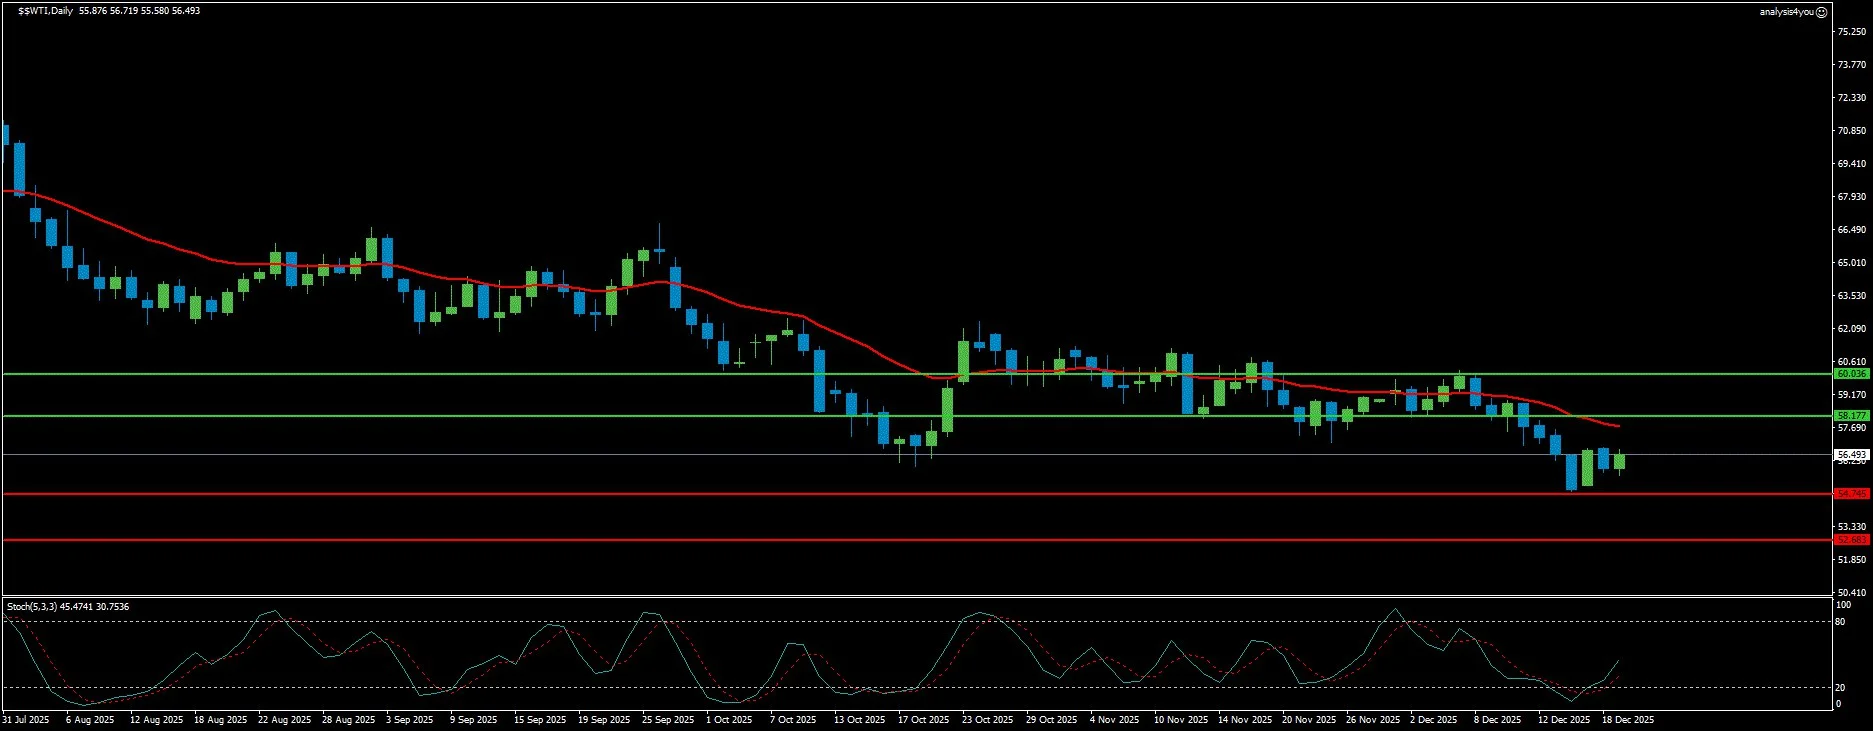
WTI Crude Oil: Bearish Regime as Oversupply Dominates
2026 Outlook: Bearish Key Drivers: Global Surplus, OPEC+ Policy, Demand Weakness
Crude oil faces a difficult 2026 as structural oversupply overwhelms demand growth. WTI trades around $56-57 per barrel and Brent near $60-61, both near four-year lows after declining roughly 18-20% from January-December 2025. The fundamental picture is stark: the IEA projects global oil demand to rise only 830,000 bpd in 2025 and 860,000 bpd in 2026, while supply is expected to grow by 3.0 million bpd in 2025 and 2.4 million bpd in 2026, driven by non-OPEC+ producers (US, Brazil, Canada, Guyana).
This mismatch has already materialized in inventories. Global oil stocks stand at 8.03 billion barrels, the highest in four years, with builds averaging 1.2 million bpd over the first ten months of 2025. The IEA calculates an implied surplus of approximately 3.7 million bpd from Q4 2025 through 2026—roughly 4% of world consumption, representing a structural glut rather than a minor overshoot.
Forward price forecasts reflect this reality. The EIA projects Brent averaging $55 in 2026 (down from $69 in 2025) and WTI around $51 (from $65). Sell-side surveys peg Brent around $62 and WTI near $59, while some banks see Brent at $56 and WTI at $52, with risk of temporary dips into the $40s if non-OPEC supply continues overshooting or global growth stalls.
OPEC+ behavior signals acceptance of a lower floor rather than proactive defense of $70+ oil. The group has paused additional production increases in Q1-2026, citing oversupply risk, effectively tolerating the current price level while betting that project deferrals and shale discipline eventually tighten the balance. Russia’s Urals crude trading at $34-36 per barrel (discounts of $23-25 versus Brent) shows how sanctions are crushing netbacks without removing volumes from the market.
US shale economics are feeling the squeeze. The oil rig count is down 77 versus a year ago as WTI in the mid-$50s pushes many new wells toward breakeven. Despite this, US crude output edged up to 13.84 million bpd. The structural headwind from the battery storage boom—global utility-scale additions expected to reach 92 GW in 2025, up 23% from 2024—further caps long-run oil demand growth.
2026 Forecast Range: WTI $50-$62, Brent $55-$65 | Downside risks to low $50s WTI if surplus persists
Potential Resistance: 58.18; 60.04
Potential Support: 54.75; 52.68
Crypto
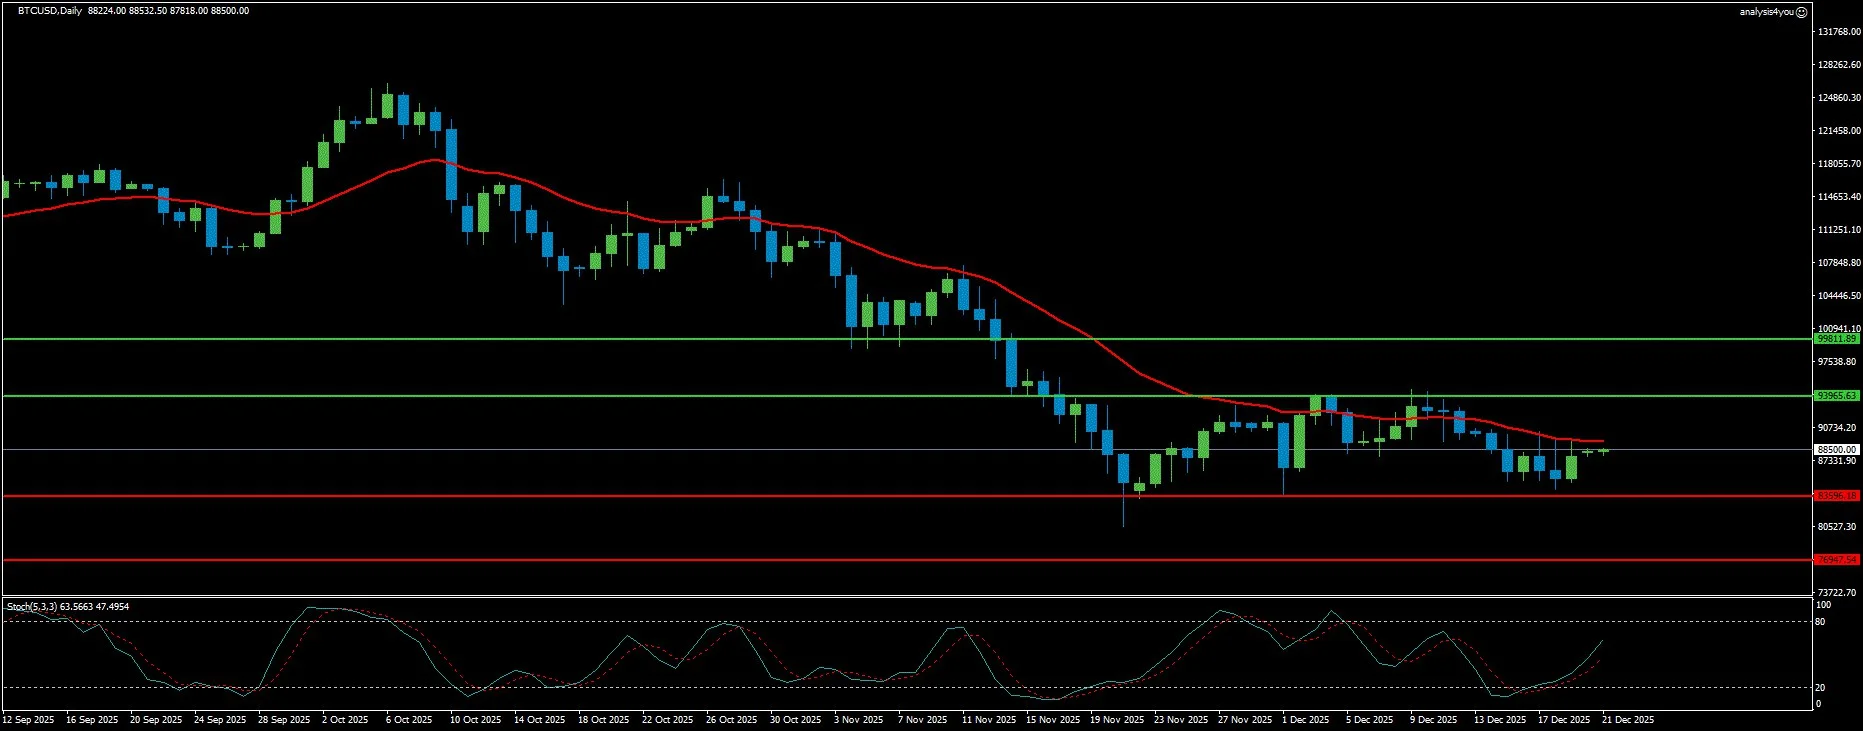
Bitcoin: Long-Term Bullish Structure Despite 30% Correction
2026 Outlook: Constructive Key Drivers: Institutional Adoption, Regulatory Clarity, Fed Policy
Bitcoin is wrapping up 2025 as one of its most eventful years, marked by unprecedented institutional participation, major regulatory milestones, and extreme volatility. BTC surged to a new all-time high of $126,199 on October 6, briefly lifting its market cap above $2.47 trillion (ranking as the world’s seventh-largest asset), before correcting sharply to around $85,000 by mid-December, leaving annual performance flat to slightly negative.
Despite volatility, 2025 marked Bitcoin’s maturation. President Trump’s pro-crypto stance, including the creation of World Liberty Financial (WLFI) and filing for a Bitcoin ETF through his Trump Media group, boosted confidence. Key regulatory milestones included the SEC’s crypto task force formation, the first White House Crypto Summit in March, and the GENIUS Act establishing federal stablecoin regulations. The Strategic Bitcoin Reserve executive order and multiple US states (New Hampshire, Arizona, Texas) establishing their own BTC reserves signaled mainstream adoption.
Institutional demand showed mixed flows. US-listed spot ETFs recorded $22.65 billion in net inflows year-to-date, though November saw $3.48 billion in outflows. Bitcoin ETF AUM peaked at $165.15 billion in October before falling to $123 billion by December. BlackRock’s IBIT dominated with $70.12 billion in net assets. Corporate demand surged, with Strategy (MSTR) increasing holdings from 446,000 BTC to 671,000 BTC (3.19% of total supply), while mining companies and global firms expanded their positions.
Looking to 2026, the outlook appears constructive despite short-term weakness. K33 Research suggests Bitcoin has transitioned away from heavy distribution, with the 2-year supply projected to end its multi-year downtrend and close 2026 above 12.16 million BTC, signaling renewed holding behavior. With nearly 20% of the total supply already reactivated over the past two years, on-chain sell-side pressure is approaching saturation, setting the stage for net buy-side demand.
The 21Shares report highlights that Bitcoin’s traditional four-year halving cycle is fading as the asset matures into a global macro hedge. While halvings still anchor transparent monetary policy (issuance now below 1% annually), structural inflows, macro realignment, and regulatory clarity now anchor the market more than halving-driven supply shocks. Each cycle delivers fewer exponential returns but also milder corrections.
Fed policy remains crucial. The CME FedWatch tool shows over 75% probability of at least two rate cuts by end-2026, despite the Fed’s dot plot indicating only one more cut to 3.4%. Trump’s continued endorsement of additional cuts and weak US labor market conditions support dovish expectations, potentially increasing investor risk appetite for Bitcoin.
Geopolitical settlement—potential resolution of Russia-Ukraine tensions, US-China trade stabilization, and other conflicts—could trigger risk-on sentiment, boosting Bitcoin. Conversely, renewed escalation could support safe-haven flows to BTC alongside Gold.
Technical analysis shows BTC stabilizing around $85,000-$86,000, just above key support zones: an ascending trendline (from October 2023 lows), the 100-week EMA at $85,732, and the yearly low at $74,508. The overall market structure suggests a healthy correction within a broader bull cycle, with the long-term bullish structure intact unless BTC closes below $74,508.
2026 Forecast Range: $90,000-$180,000 | Institutional adoption and regulatory clarity support upside, though 2025-style rallies are unlikely.
Potential Resistance: 93965.63; 99811.89
Potential Support: 83596.18; 76947.54
Final Outlook
2026 is shaping up as a transition year rather than a regime change. The US Dollar faces moderate softening but not collapse, supported by safe-haven flows and one-sided positioning despite fiscal concerns and Fed easing. The Pound Sterling looks positioned for further gains on Fed-BoE divergence, while the Euro faces pressure from ECB dovishness and structural growth challenges.
Gold appears well-supported by accommodative policy, geopolitical risks, and central bank buying, with potential for new record highs, though not a repeat of 2025’s 60% surge. Crude oil confronts a bearish regime as 3-4 million bpd global surplus pushes prices toward mid-$50s WTI and high-$50s Brent. Bitcoin maintains a long-term bullish structure despite short-term weakness, with institutional adoption, regulatory clarity, and Fed policy providing support.
The year ahead demands selective opportunism rather than broad directional bets. Volatility will likely remain elevated across asset classes as markets navigate policy transitions, geopolitical uncertainty, and structural economic shifts. The challenge for investors will be distinguishing between cyclical pullbacks and structural turning points—with the former far more likely than the latter across most major markets.

