Death Cross Confirmed, Oil Above $100, NFP on Good Friday

Market Sentiment Overview
The week of March 30 to April 3 is unlike any other in this five-week-old war cycle. It is a holiday-shortened week as markets observe Good Friday on April 3, yet it carries perhaps the heaviest data and geopolitical load of the entire conflict. The week closes with the March Nonfarm Payrolls report releasing on Good Friday, when most markets are shut, meaning the full market reaction will be delayed until Monday, April 6. That Monday also happens to be the deadline Trump set for Iran to allow safe passage through the Strait of Hormuz or face resumed strikes on energy infrastructure. The April 6 nexus of NFP reaction plus war deadline makes it one of the most consequential single dates of 2026. The macro backdrop has deteriorated further in every dimension. The S&P 500 has posted five consecutive weekly losses (worst streak since 2022) and has now confirmed a death cross with the 50-day and 200-day moving averages crossing bearishly. WTI crude has broken decisively above the $100 psychological barrier, closing the week at $102.11, with Iraq’s force majeure, Kuwait refinery attacks, and the looming threat of US ground operations on Kharg Island all adding to the supply shock narrative. Gold remains under pressure, down nearly 17% in March (worst monthly performance since October 2008), as rising Treasury yields and the hawkish Fed rate-hike probability eliminate the precious metal’s appeal despite the geopolitical crisis. The ceasefire narrative produced the week’s most dramatic price swings. Trump’s Monday announcement of a five-day pause in strikes on Iran’s power plants triggered a sharp risk-on surge. EUR/USD and GBP/USD both rallied sharply, WTI dropped, and equities bounced. But Tehran’s categorical denial of any negotiations turned the optimism to ash within 48 hours. By Thursday, Trump had extended the pause by another ten days to April 6; Iran denied any request for such an extension, and markets largely ignored both announcements. The message from price action is clear: markets no longer believe the diplomatic signals from either side. Only actions (reopening the Strait or escalating to ground troops) will move markets durably now.
Currencies
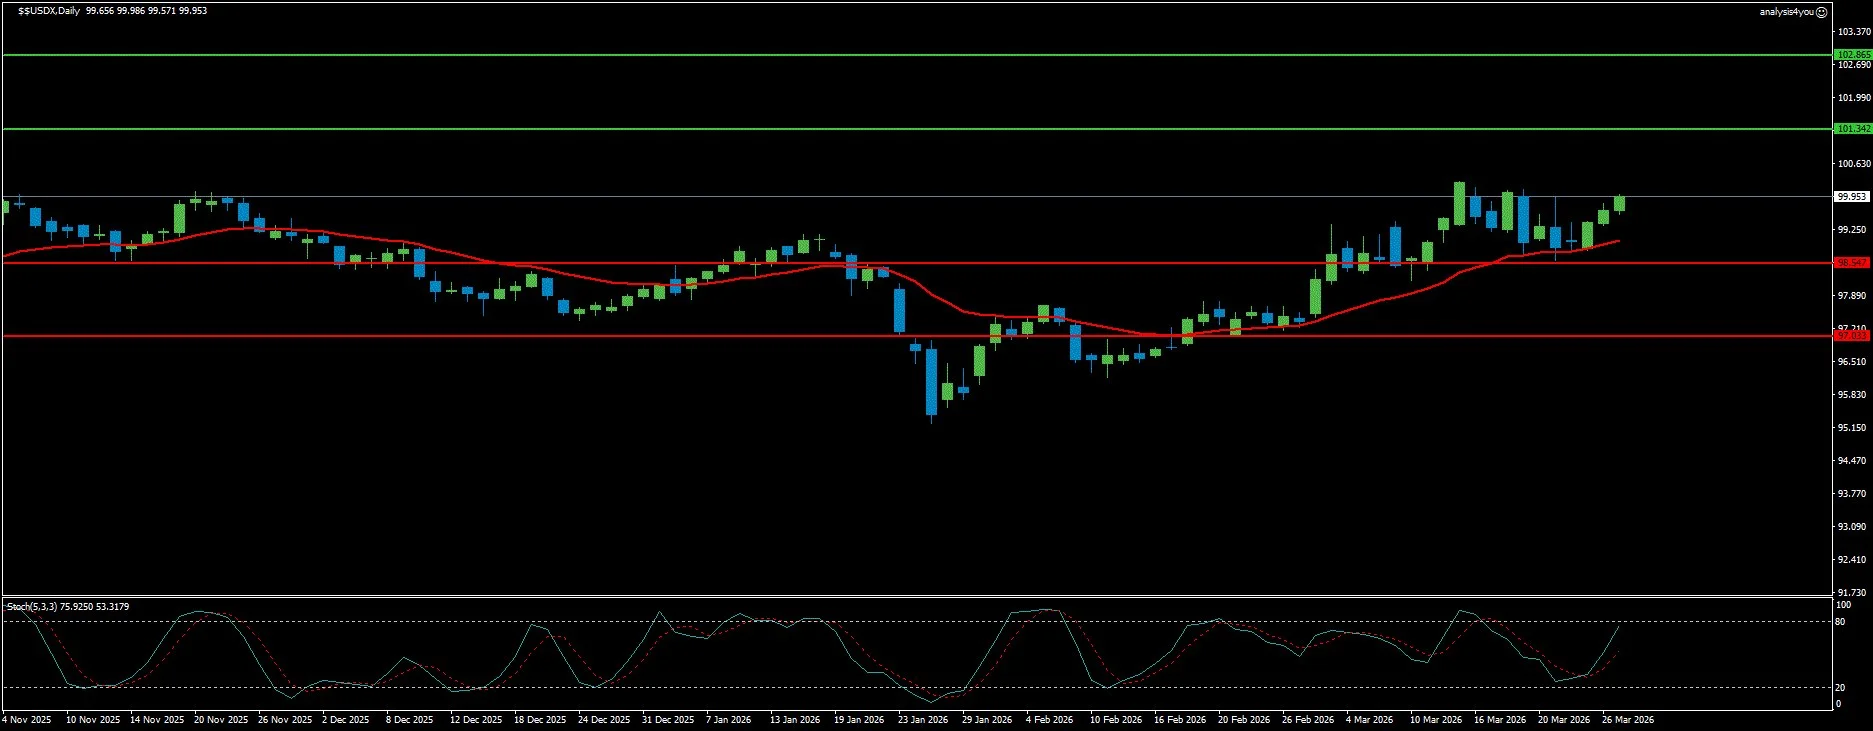
USD Index: Reclaimed 100, Holding Firm (99.953)
Current Trend: Bullish
Market Sentiment: Safe Haven Dominance
Resistance: 101.34 | 102.86
Support: 98.55 | 97.03
The US Dollar has re-established itself above the 100.00 level after the brief correction the prior week, and the macro story supporting it has only strengthened. The USDX closed Friday near 99.95 (effectively at the 100.00 threshold), underpinned by rising Treasury yields, a hawkish Fed, and the safe-haven premium from a war that shows no signs of resolution. CFTC positioning data confirms the tide has turned: speculative accounts shifted to a net long of approximately 3,693 contracts in the week to March 17, reversing from a net short of 5,882 contracts the week prior. Open interest rose to 35,456 contracts, confirming fresh participation rather than simply short-covering. The direction of travel has changed as investors rebuild Dollar exposure. The Fed narrative continues to evolve in the Dollar’s favor. Governor Cook stated the scales have tipped toward inflation, bearing the brunt of risks. Goolsbee warned that inflation appears to have stalled and described oil shocks as historically stagflationary. Barkin noted progress on inflation was already at risk of stalling before the latest oil shock. The 37% probability of a rate hike by year-end is the most striking repricing of monetary expectations since the war began. The week’s dominant Dollar event is Fed Chair Powell’s appearance at Harvard University on Monday, where his tone will set the stage. Given the deteriorating inflation picture (oil above $100 with Citi targeting $120, 10-year yields at 4.48%, and March NFP on Friday), Powell will face sharp questioning about the Fed’s path. Technically, the daily chart shows USDX firmly back above the rising moving average, which has resumed its upward curl after the brief dip. Price is consolidating just below the 100.24 prior high, with the Stochastic at 75.93/53.32 in the upper half of its range. Momentum is present but not yet overbought, leaving room for continuation. Resistance at 101.34 is the first meaningful ceiling. On the downside, 98.55 must hold to maintain the bullish structure; a break below extends the corrective phase toward 97.03.
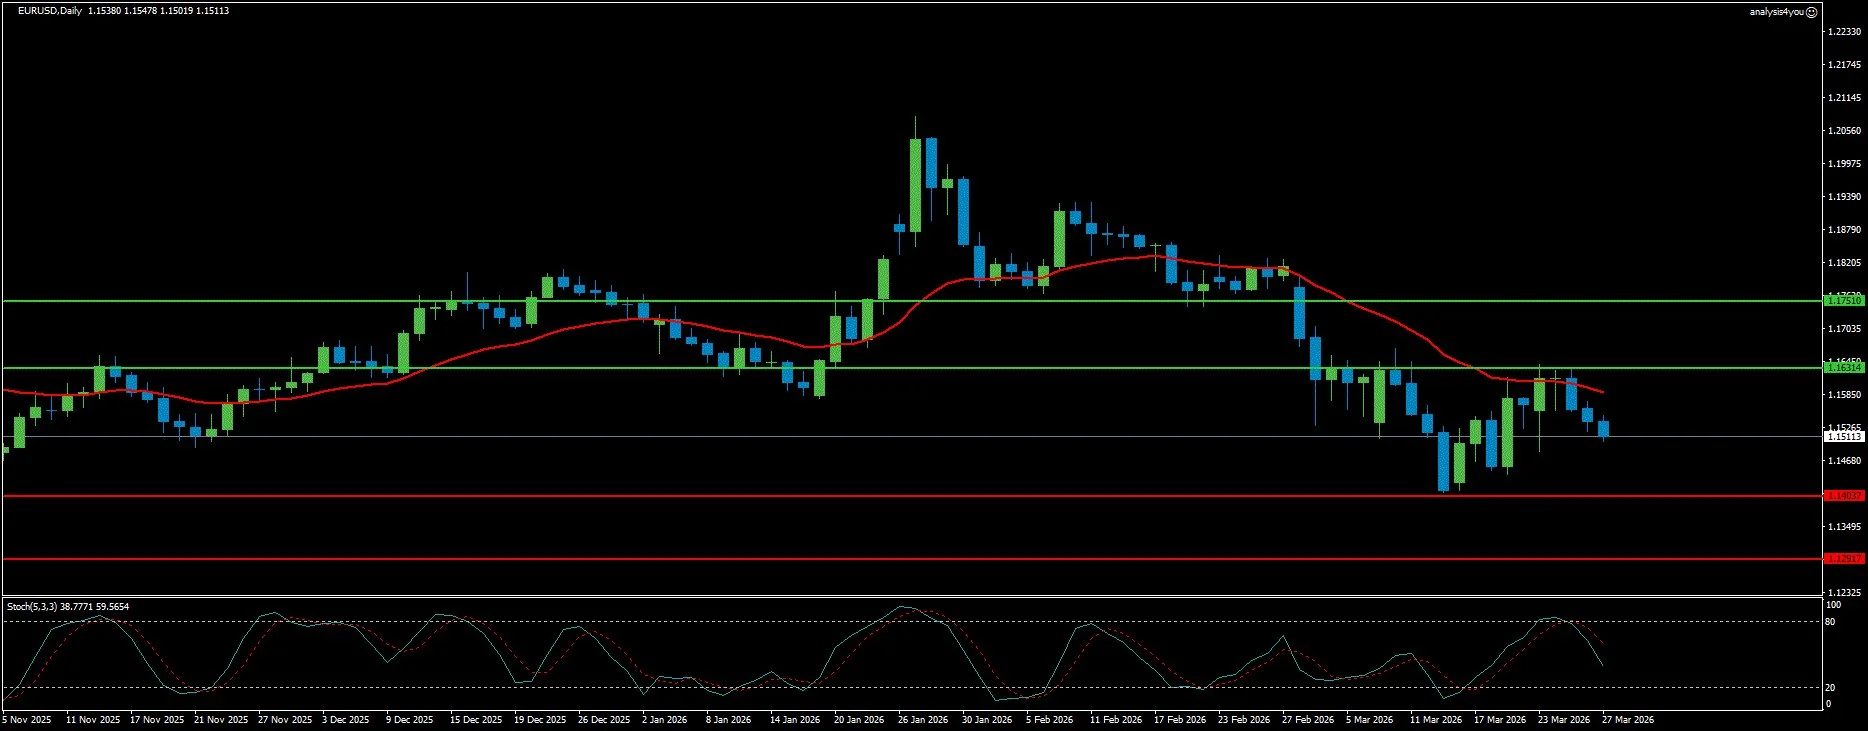
EUR/USD: Trapped in Range, Bearish Bias Intact (1.1511)
Current Trend: Bearish
Market Sentiment: Range-Bound
Resistance: 1.1631 | 1.1751
Support: 1.1404 | 1.1292
EUR/USD ended the week around 1.1530, barely changed from its open but well off the 1.1640 peak hit on Monday when Trump’s ceasefire pause triggered a risk-on surge. The pair’s inability to sustain the Monday rally (giving back almost the entire move by Friday) encapsulates the fundamental predicament. Every piece of optimism about de-escalation is immediately overwhelmed by the structural weight of a strengthening Dollar, a hawkish Fed, and Europe’s acute energy vulnerability. The Eurozone data released during the week confirmed that the fog of uncertainty is affecting confidence before the real economic damage has even landed. The Eurozone Composite PMI printed at 50.5 in March (down from 51.9 in February and below the 51.1 expected). Germany’s IFO Business Climate eased to 86.4 from 88.4. German ZEW had already collapsed earlier in the month. ECB President Lagarde characterized the current environment as one of ‘profound uncertainty’ and reiterated that decisions will be taken meeting-by-meeting depending on data. The week ahead brings key macro events from the US that will shape EUR/USD more than any Eurozone release. Monday’s Powell speech, Tuesday’s German Retail Sales and Eurozone HICP for March (previously 1.9% YoY, expected to edge higher given energy), Wednesday’s US ISM Manufacturing PMI and Consumer Confidence, Thursday’s JOLTS and ADP, and Friday’s NFP are all scheduled for a week that ends with Easter Friday market closures. The EUR reaction to NFP will be muted on Friday and concentrated into Monday, April 6, the same day Trump’s extended deadline expires. Technically, the daily chart shows that EUR/USD is navigating a tight range below the declining 20-day SMA (approximately 1.1570), which is now converging with the 100-day and 200-day SMAs overhead around 1.1631 to 1.1751. The moving average continues to point lower, and the Stochastic at 38.78/59.57 is in neutral mid-range, reflecting the range-bound consolidation rather than trending behavior. The 20-day SMA at approximately 1.1570 is providing immediate resistance, with 1.1631 as the first meaningful level above. On the downside, 1.1404 is the critical support drawn from the 2026 low at 1.1411. A break below 1.1404 confirms the long-term bearish continuation targeting 1.1292 and then the 1.1300 psychological area.
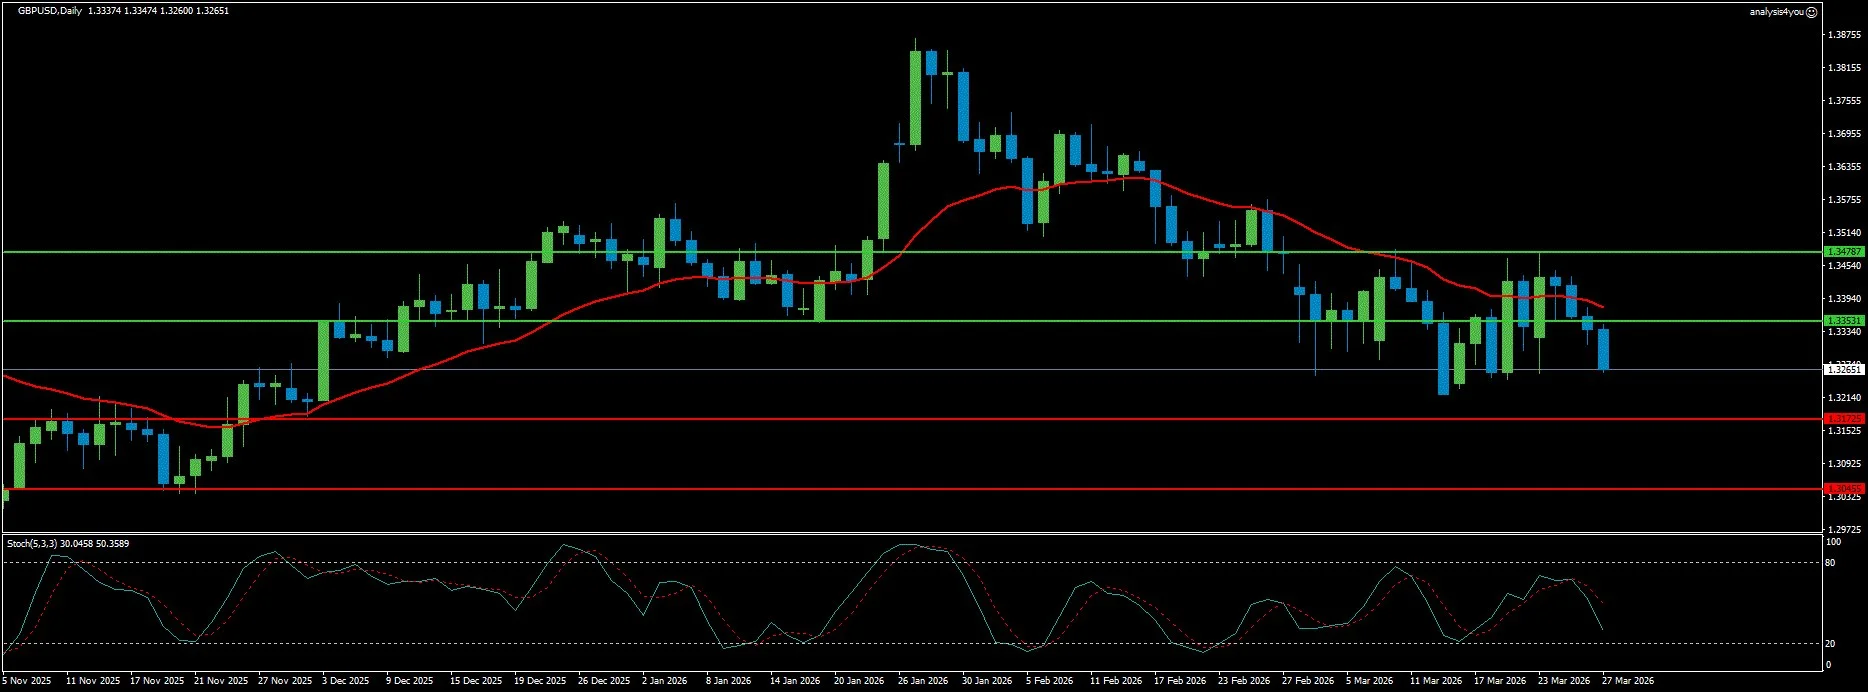
GBP/USD: Drifting Lower, War Uncertainty Caps Recovery (1.3265)
Current Trend: Bearish
Market Sentiment: Defensive
Resistance: 1.3353 | 1.3479
Support: 1.3173 | 1.3045
GBP/USD ended the week near 1.3265, having failed to sustain the Monday ceasefire-inspired rally above 1.3500 and drifting back below all major moving averages into the weekend. The pair is caught in a classic stagflation trap: the BoE cannot cut rates because energy-driven inflation is entrenching above 2% (UK CPI confirmed at 3% for February, unchanged from January), yet the economy is visibly weakening (zero GDP growth in January, retail sales falling 0.4% in February, and unemployment rising to a five-year high of 5.2%). The hawkish BoE hold from the prior week (all nine MPC members voting unanimously to hold at 3.75%) provided structural support but not enough to overcome the USD safe-haven bid that reasserted itself in the second half of the week. The WSJ reports that the Pentagon is considering sending up to 10,000 additional ground troops to the Middle East (even as Trump extended the diplomatic pause), which injected new risk-off flows that weighed on Sterling. The UK’s position in the G7 coalition to escort ships through the Strait of Hormuz is a positive signal for UK diplomatic standing, but provides no near-term relief for the currency. The week ahead is dominated by US data, given the sparse UK calendar. UK clocks turn back over the weekend, and the data docket is thin (no major UK releases until Friday’s retail sales update, which covers February and pre-dates the full war impact). Sterling will trade on the US employment narrative and geopolitical headlines. The April 6 war deadline is the week’s single most important event for GBP. Technically, the daily chart confirms the mildly bearish structure. Price sits below all four major SMAs (the 21-day, 50-day, 100-day, and 200-day are all clustered in the 1.3353 to 1.3479 zone, creating a formidable resistance ceiling). The Stochastic at 30.05/50.36 is approaching oversold territory, suggesting a short-term bounce is possible, but the RSI at 43 remains below the neutral 50 level, keeping the downside bias intact. The immediate resistance at 1.3353 is the 21-day SMA, a level that has capped every recovery attempt in recent weeks. On the downside, 1.3173 is the first meaningful support above the 1.3219 three-month low. A break below 1.3173 exposes 1.3045, with the 1.3000 psychological level as the ultimate near-term floor.
Stocks
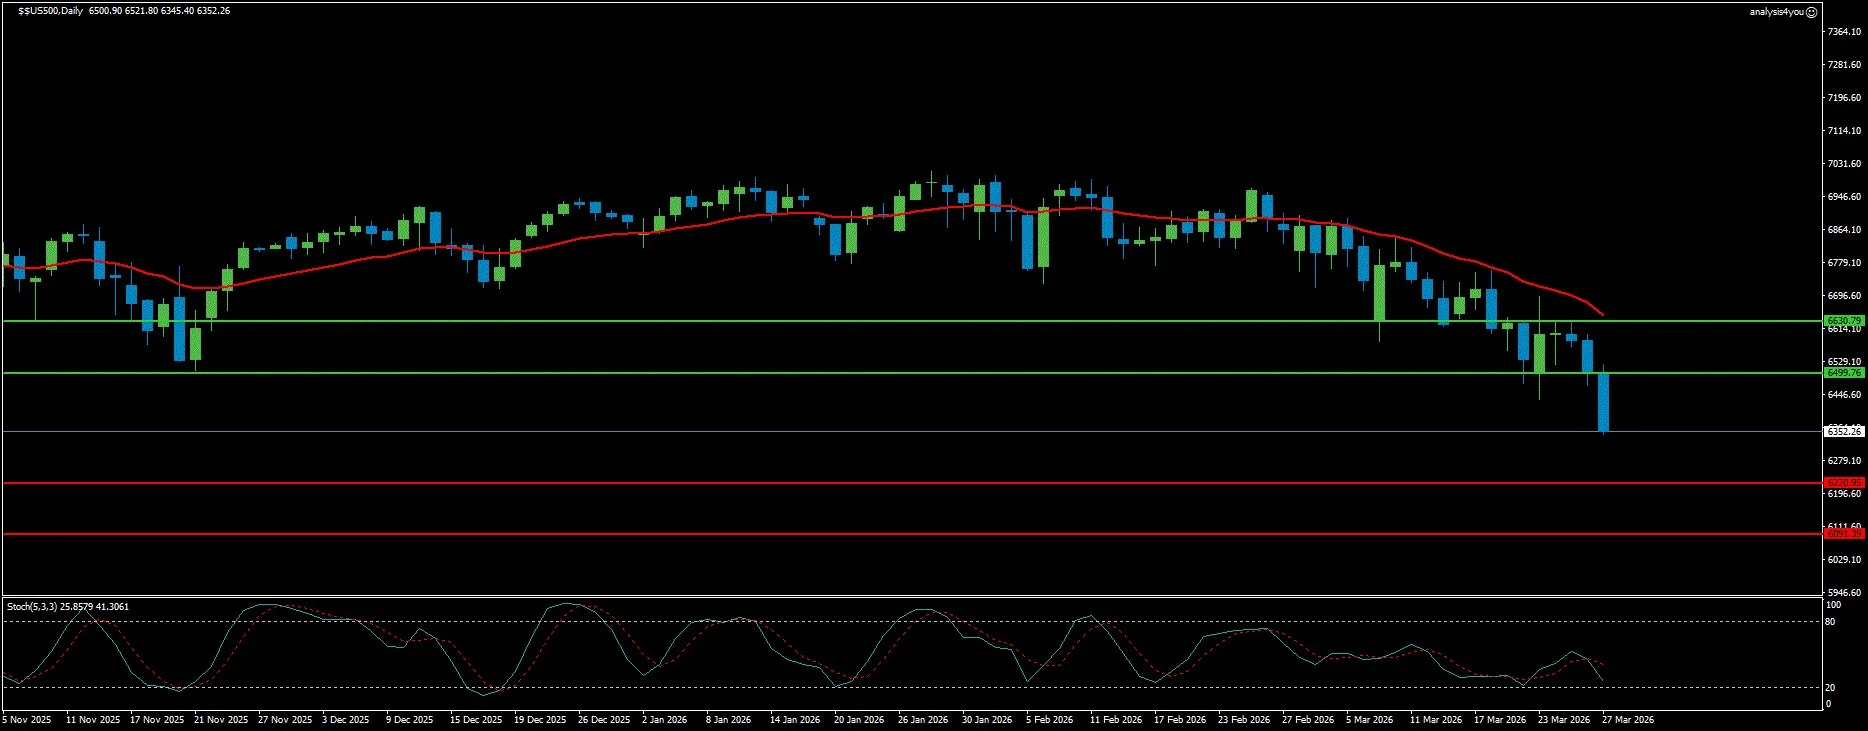
S&P 500: Death Cross Confirmed, NFP on Good Friday (6,352)
Current Trend: Bearish
Market Sentiment: Risk-Off
Resistance: 6,500 | 6,631
Support: 6,221 | 6,091
The S&P 500 closed the week at 6,352, extending its streak of consecutive weekly losses to five (worst run since 2022). The index has now confirmed a death cross, with the 50-day and 200-day weighted moving averages crossing bearishly, a pattern that historically precedes sustained downtrends. The S&P is down 8.74% from its late January peak, approaching correction territory at -10%, while the Nasdaq has already entered correction territory, and the Russell 2000 has been there for weeks. The week’s price action was a microcosm of the broader crisis: Monday’s ceasefire optimism produced a strong bounce, followed by a progressive deterioration as Iran’s denials, ground troop preparation reports, and resurging oil prices overwhelmed the bulls. The selling was driven by a toxic combination of forces that are simultaneously bearish for equities: WTI above $100 threatening to push CPI toward 4% to 5% by summer, a 37% probability of Fed rate hikes by year-end (up from near zero before the war), 10-year Treasury yields at 4.48% (highest since July), and an ADX of 40 on the daily chart signaling the downtrend is accelerating. The sector rotation story continues to be the most important structural development beneath the headline index. Energy stocks are up 18% month-to-date (Exxon and Chevron at all-time highs, ConocoPhillips, Halliburton, and Occidental at multi-year highs). Defense names RTX, LMT, and NOC are up 17% to 22% for the month. LNG exporters Venture Global and NextDecade are up 20% to 37% MTD. Against these, consumer discretionary is down 12%, tech is down 10%+, and homebuilders are suffering as 30-year mortgage rates have risen from 6% to 6.4% since the war started. The S&P’s modest decline masks a profound structural reshaping of the US equity market. The week’s defining event is the March NFP report on Good Friday, April 3. The consensus estimate is 60,000 jobs created (a recovery from February’s catastrophic -92,000), with unemployment expected to tick up from 4.4% to 4.5%. Crucially, the expected increase is partly because of over 30,000 Kaiser Permanente healthcare employees returning after ending their strike, artificially inflating the headline. The underlying picture remains one of labor market deterioration. Markets will be closed when NFP releases, meaning the full price reaction happens on Monday, April 6 (the same day Trump’s war deadline expires). Technically, the daily chart is deeply bearish. The most recent candle is one of the largest bearish candles on the entire chart, confirming a decisive breakdown below all prior support levels. The death cross has formed, the MA is pointing steeply downward, and the price is well below the lower end of the prior consolidation range. The Stochastic at 25.86/41.31 is in oversold territory (which could trigger a technical bounce toward 6,500 resistance), but the trend momentum is firmly down. The immediate support level is 6,221. A clean break below that exposes 6,091 and then the Goldman Sachs worst-case scenario zone around 6,000. Resistance at 6,500 caps any bounce, with 6,631 the stronger ceiling.
Commodities
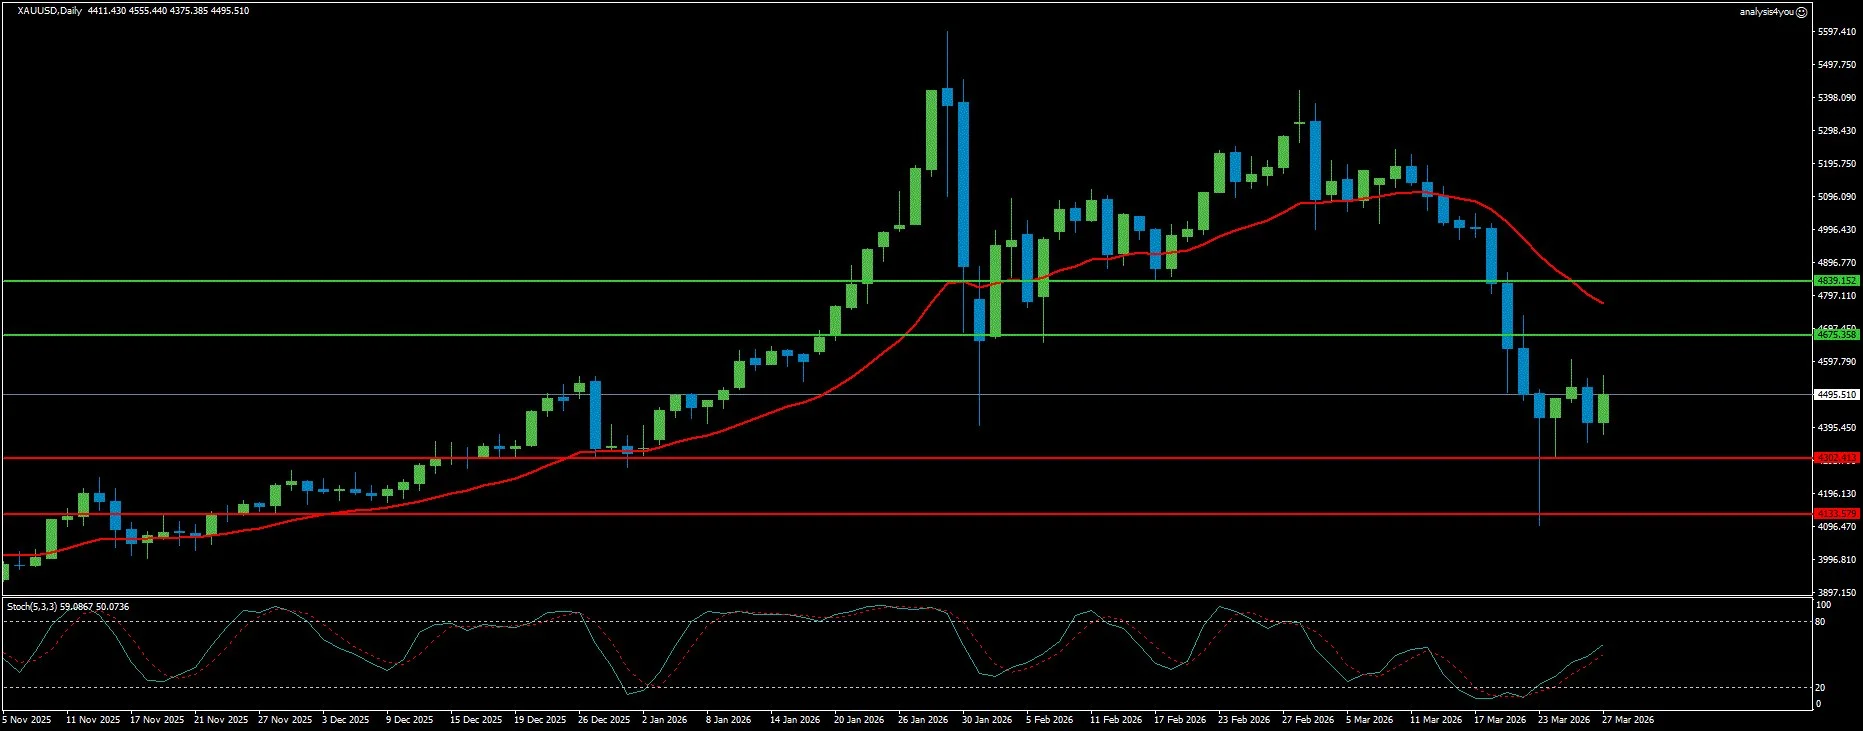
Gold: Volatile Recovery, Ceasefire Uncertainty Limits Upside (4,496)
Current Trend: Neutral (Recovering from Extreme Oversold)
Market Sentiment: Volatile
Resistance: 4,675 | 4,839
Support: 4,302 | 4,134
Gold’s week was the most volatile since the war began. XAU/USD crashed to near $4,100 on Monday morning after Trump’s weekend threat to obliterate Iran’s power plants within 48 hours sent oil prices spiking and inflation fears to new extremes (pushing the 10-year yield higher and the Dollar stronger). But the $4,100 level proved to be a firm floor, coinciding with both the 200-day SMA and the March 23 swing low. Gold reversed sharply in the afternoon session when Trump announced the five-day pause in energy infrastructure strikes. The yellow metal recovered to close near $4,400 on Monday, then pushed above $4,600 on Tuesday as Israeli Channel 12 reported a potential one-month ceasefire was being negotiated via a 15-point proposal. The recovery then stalled and reversed. Iran categorically rejected the 15-point proposal. The White House refused to rule out ground operations. Fed Governor Barr warned that a price shock from the conflict could shift inflation expectations and lead to more inflation persistence. Fed Vice Chair Jefferson noted geopolitical tensions posed upside inflation risks. The 10-year Treasury yield pushed above 4.45% (highest since July), eliminating the rate-differential case for Gold. By Thursday, Gold fell nearly 3% as Trump’s extended pause announcement was met with investor indifference, and XAU/USD ended the week near $4,495 (having round-tripped from $4,100 to $4,600 and back). The fundamental paradox for Gold persists and is perhaps becoming more entrenched. Gold is down nearly 17% in March (worst monthly performance since October 2008) despite a war that has pushed oil up 55% since February 28. The inverse correlation between oil and Gold in this environment is now the dominant market reality: higher oil means higher inflation, higher inflation means higher-for-longer rates, higher rates mean higher real yields and a stronger Dollar, and that combination is structurally bearish for Gold regardless of geopolitical fear. The only scenario that is unambiguously bullish for Gold is a confirmed ceasefire (oil drops sharply, inflation fears ease, the Fed can pivot back to dovish, real yields fall, and Gold rallies decisively). The week ahead focuses on US employment data and the ISM Manufacturing Prices Paid component (both will further define the Fed’s path). CME FedWatch shows less than 10% probability of a rate cut by year-end and approximately 37% probability of a hike. For Gold, the NFP print on Good Friday is critical. Technically, the daily chart shows Gold in a recovery phase after the extreme sell-off, but still operating in deeply damaged technical territory. Price has bounced from the $4,100 low (the 200-day SMA support) back to $4,495, but remains well below the 100-day SMA (which now acts as resistance around $4,625) and below the declining longer-term moving average that has rolled over sharply from the February peaks. The Stochastic at 59.09/50.07 has recovered from extreme oversold levels, suggesting the bounce from $4,100 has been meaningful. First resistance at $4,675 (Fibonacci 61.8% retracement, formerly key support). Above that, $4,839 (Fibonacci 38.2%) is the stronger barrier. On the downside, $4,302 (Fibonacci 78.6%) is the next support, with the $4,100 to $4,120 region as the critical floor where the 200-day SMA and the March low converge.
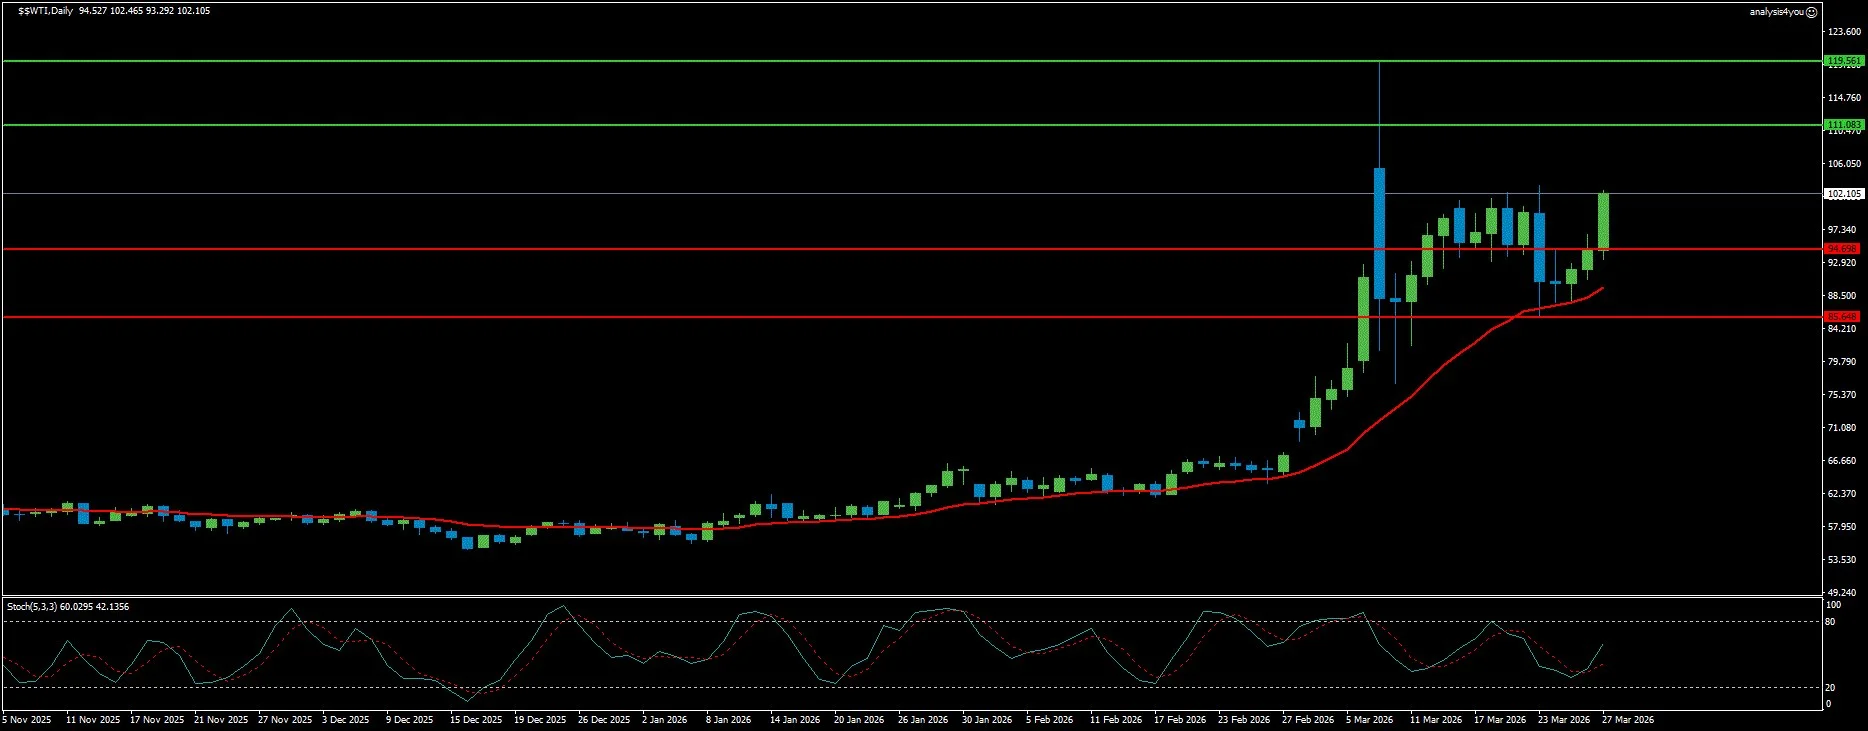
WTI Crude Oil: Above $100, Ground Troop Risk Threatens $110+ (102.11)
Current Trend: Bullish
Market Sentiment: Fear (Supply Crisis)
Resistance: 111.08 | 119.56
Support: 94.70 | 85.65
WTI crude has achieved and confirmed the $100 breakout that defined last week’s outlook as the defining threshold. Closing Friday at $102.11 (having touched $101 briefly at the week’s open before crashing to $84 on ceasefire optimism, then recovering back above $100), the oil market has demonstrated both the extreme volatility and the structural bullish bias that characterizes the Hormuz supply shock. The intraweek range of nearly $17 from high to low is something even large institutional players are not accustomed to managing. The supply disruption has broadened materially. Iraq’s force majeure on all foreign-operated oilfields removes one of the world’s largest export programs from global supply. Kuwait’s Mina Al-Ahmadi and Mina Abdullah refineries were hit by drones, causing fires and precautionary shutdowns. Qatar has declared potential force majeure on LNG contracts, losing 12.8 million tons per year of capacity for three to five years. Brent crude closed Friday at $112.57. Citi targets $120 for both Brent and WTI over the next one to three months, with a bull case of $150 if disruptions intensify. Saudi officials have privately warned of $180 if disruptions persist through late April. The ground troop dimension introduces the biggest near-term upside risk to oil. WSJ reported the Pentagon is considering sending up to 10,000 additional troops to the Middle East. The White House has indicated that a Congressional authorization would not be needed for a ground operation. If US forces move to take Kharg Island (which manages nearly all of Iran’s crude exports), the market reaction could be explosive upward. The potential offsets remain: Trump’s 10-day extended pause (until April 6) and talks with Iran, the G7 naval coalition working to restore Hormuz passage, and Bessent’s Iranian crude sanction relief proposal (potentially 140 million barrels). But Iran’s consistent denial of any negotiations undermines all diplomatic signals. The April 6 deadline is now the oil market’s most important near-term date. Technically, the daily chart confirms the $100 breakout as a genuine technical event. Price is now consolidating above the $100 level, with the aggressively rising moving average providing dynamic support from well below. The Stochastic at 60.03/42.14 is in mid-range territory (a healthy position for a trend continuation setup), with the bearish crossover in the signal line suggesting a brief consolidation or shallow pullback is possible before the next leg. Resistance at $111.08 is the next meaningful level above the current price. Beyond that, $119.56 represents the upper extreme consistent with Citi’s bull case. On the downside, $94.70 is the first support, with $85.65 the stronger floor.
Crypto
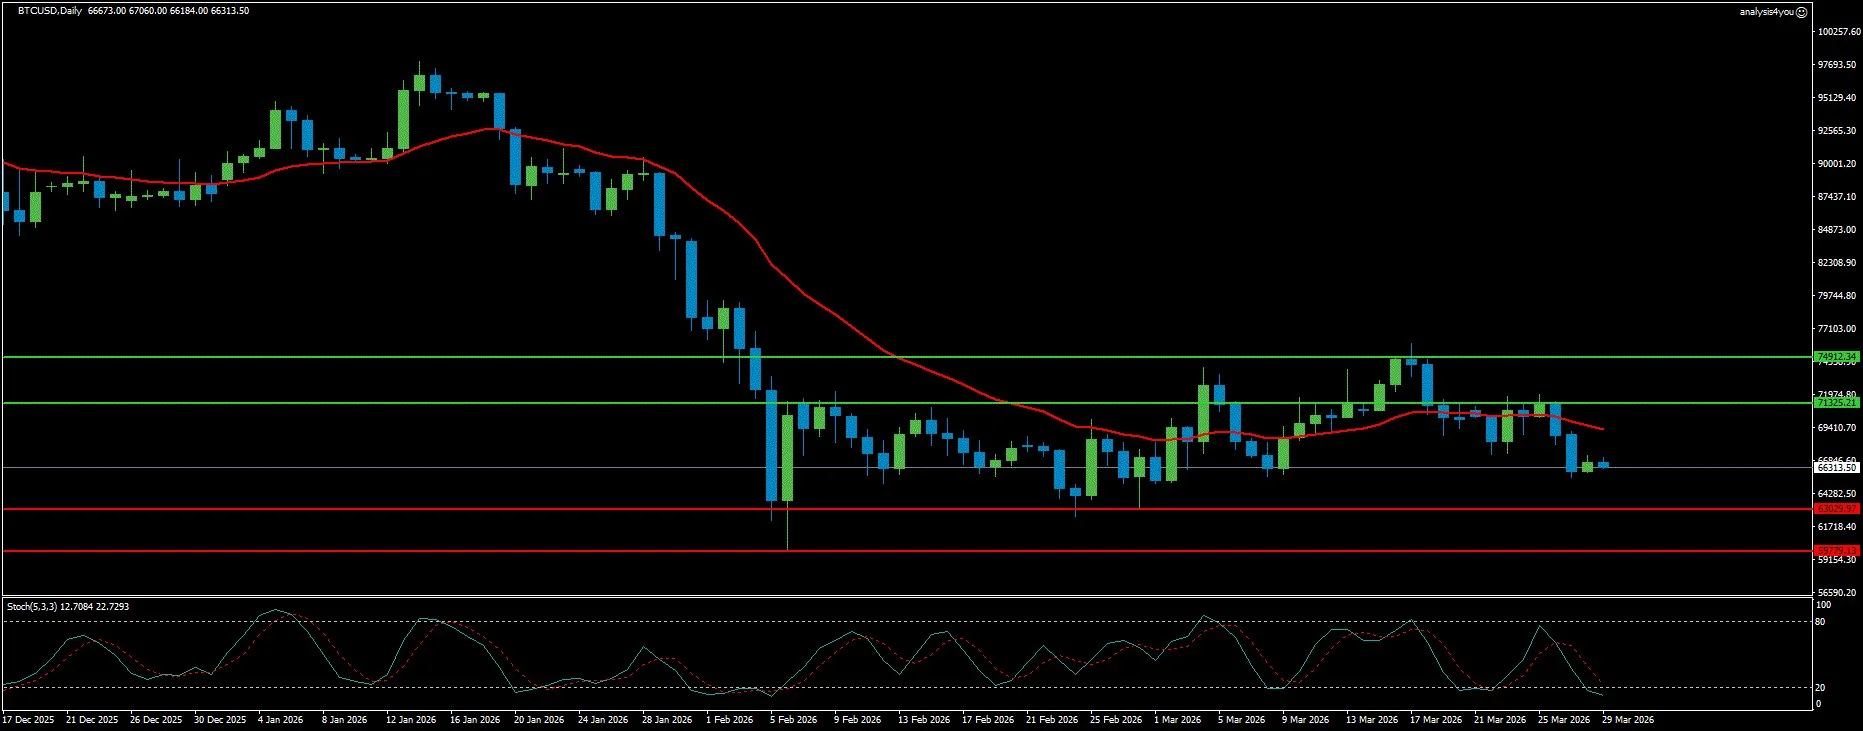
Bitcoin: War Uncertainty Finally Weighs, $63K Floor in Focus (66,314)
Current Trend: Bearish
Market Sentiment: Vulnerable
Resistance: 71,325 | 74,912
Support: 63,030 | 59,779
Bitcoin has finally succumbed to the war uncertainty that every other risk asset has been pricing for weeks. BTC slipped below $69,000 by Friday (nearly erasing the entire week’s recovery) as the Fed’s hawkish tone, Iran ceasefire confusion, and a net weekly ETF outflow broke the resilience that had been Bitcoin’s defining characteristic since the war began. The Crypto King closed the week at approximately $66,313, down sharply from the $76,000 high hit earlier in the month. The institutional flow picture has turned decisively negative for the first time since late February. Spot Bitcoin ETFs saw a net outflow of $70.71 million for the week as of Thursday, with $163.52 million outflow on Wednesday (post-Fed) and $171.22 million on Thursday. If Friday’s flows confirmed the negative trend, the four-week streak of positive ETF flows since the end of February will have been broken. CryptoQuant’s weekly report added a sobering structural observation: Strategy (MSTR) is now the sole driver of Bitcoin treasury demand, having accumulated over 45,000 BTC in the last 30 days (the highest 30-day purchase since April 2025). Meanwhile, all other treasury companies combined purchased only 1,000 BTC in the last 30 days, a 99% decline from the 69,000 BTC peak in August 2025. CryptoQuant’s Julio Moreno stated plainly: Strategy by itself cannot support Bitcoin’s price for long. Overall demand needs to grow, which is not the case today. The $12.88 billion BTC options expiry on Friday (Good Friday, when most markets are closed) added a technical dimension. The max pain price sits around $74,000 (above current trading levels), suggesting markets could gravitate toward that level over time, but current conditions suggest the pull may not fully materialize near-term. The war uncertainty, negative ETF flows, and broader risk-off environment are dominating the options dynamics. The week ahead brings NFP on Good Friday (market closed, reaction on Monday, April 6) and the war deadline on April 6. Technically, the daily chart shows a significant deterioration from the $76,000 high. Price has broken back below the 200-week EMA support zone and is now trading at $66,313, with the declining moving average providing overhead resistance. The Stochastic at 12.71/22.73 is at its most oversold level since early February (comparable to the extreme readings seen at the $65,000 floor during the war’s initial shock). This extreme oversold reading warns of a potential technical bounce, but the trend structure remains bearish. Resistance at $71,325 is the first meaningful barrier (the channel top and near the 50-day EMA cluster). A sustained daily close above $71,325 is needed to neutralize the immediate bearish momentum and open the path toward $74,912. On the downside, $63,030 is the critical floor (this aligns with the 78.6% Fibonacci retracement level at $65,520 and represents the make-or-break level for the Bitcoin bull case). A break below $63,030 exposes $59,779 and the capitulation zone around $55,000 to $56,000, identified by multiple analysts.
Key Events This Week (March 30 – April 3, 2026)
NOTE: Easter holiday week. Many global markets closed on Good Friday, April 3. NFP releases on a closed market day (full reaction delayed to Monday, April 6, which is also Trump’s war deadline).
Monday, March 30: Fed Chair Powell speaks at Harvard University. This is the week’s first major market mover. Powell’s tone on inflation, rate hikes, and the war’s economic impact will set the USDX direction for the week. German Preliminary HICP (March) is expected to show rising inflation from 2% in February.
Tuesday, April 1: German Retail Sales (February). Eurozone HICP Flash Estimate (March) (previous 1.9% YoY, expected higher given energy prices). US Consumer Confidence (March) (watching for war-related deterioration). US JOLTS Job Openings (February) (labor market health check ahead of NFP).
Wednesday, April 2: US ADP Employment Change (March) (key NFP preview). ISM Manufacturing PMI (March) (the Prices Paid Index component is the critical inflation signal this week). US Retail Sales (February) (economic resilience check).
Thursday, April 3: US Initial Jobless Claims. Multiple Fed speakers. BoE speakers Alan Taylor and Megan Greene. Markets begin to wind down ahead of Good Friday.
Friday, April 3 (Good Friday): US Nonfarm Payrolls (March) and Unemployment Rate released on a closed market day. Consensus: +60K jobs, unemployment rising to 4.5%. Market reaction will be fully delayed to Monday, April 6. NOTE: Partial Kaiser Permanente effect (+30K healthcare workers) may inflate headline (watch private sector component for underlying trend).
Monday, April 6 (Post-Easter): FULL MARKET REACTION DAY with NFP reaction plus Trump’s war deadline expiration. This is potentially the most volatile single market day of 2026.
Week Ahead Outlook
The week of March 30 to April 3 builds toward a single defining moment: April 6, the convergence of NFP market reaction and Trump’s war deadline. Everything that happens this week (Powell’s Harvard speech, ISM Prices Paid, ADP, European inflation data) feeds into that April 6 positioning.
Scenario 1: April 6 Escalation (Ground Operations / Oil Toward $115, approximately 35%): US ground forces move on Kharg Island or broader Iran operation. WTI spikes toward $111 to $120. S&P 500 gaps lower below 6,221 toward 6,091 and the 6,000 Goldman worst-case zone. Gold spikes sharply on genuine safe-haven demand as the USD temporarily loses ground amid fear of uncontrollable escalation. EUR/USD and GBP/USD crash through support as risk-off dominates. Bitcoin tests $63,030 critical floor. Fed emergency meeting speculation returns.
Scenario 2: April 6 Stalemate (Deadline Extended Again, approximately 40%): Trump extends the deadline for a third time. Iran continues denying negotiations. Oil consolidates between $95 to $105. Markets largely ignore the extension as they did the previous two. USDX holds a 98.55 to 101.34 range. EUR/USD stays trapped between 1.1404 and 1.1631. GBP/USD range-trades 1.3173 to 1.3353. S&P 500 dead-cat bounce possible toward 6,500 before resuming lower. Gold consolidates $4,302 to $4,675. Bitcoin holds a $63,030 floor. NFP drives the week.
Scenario 3: April 6 Ceasefire (Confirmed by Both Sides, approximately 25%): Iran and US confirm ceasefire, Hormuz reopens. Oil crashes $20 to $25 in a single session toward $75 to $80. Risk-on explosion: EUR/USD gaps above 1.1631 toward 1.1751. GBP/USD surges above 1.3479. S&P 500 gaps higher above 6,500 toward 6,631+. Gold rallies sharply as inflation fears ease and the Fed can pivot back toward cuts (price moves toward $4,839 and potentially reclaims $5,000). Bitcoin surges above $71,325 toward $74,912. USDX sells off sharply toward 98.55 support.
Key Trading Priorities: Powell Monday (first directional catalyst of the week for USD and rates). ISM Prices Paid Wednesday (inflation signal that determines Fed hike probability trajectory). ADP Wednesday (NFP preview, shapes positioning into Good Friday). NFP Friday (releases on closed market, full reaction April 6). April 6 war deadline (the week’s binary event that supersedes all data). WTI $100 hold critical support now ($111 resistance on escalation, $87 to $88 on ceasefire). EUR/USD 1.1404 (break below confirms medium-term bearish continuation to 1.1292). S&P 500 6,221 (next support target, break exposes 6,091). Gold $4,302 (critical floor after $4,100 bounce; must hold). BTC $63,030 (make-or-break level for the Bitcoin bull case).
Bottom line: Five weeks of war, a death cross on the S&P 500, oil above $100, a 37% probability of Fed rate hikes, Gold in its worst month since 2008, and Bitcoin finally breaking down. The market has spent five weeks pricing in hope of a quick resolution and is now beginning to price in duration. April 6 is the moment of truth (either Trump finds the off-ramp he has been signaling, or the escalation to ground operations begins). Position for volatility in both directions. The trades that have worked (long USD, long energy, long defense, short equities) remain valid until the Strait of Hormuz reopens. When it does reopen, the reversal will be as violent as the original selloff.


