June CPI Tuesday, Warsh Congressional Testimony Tue-Wed, MOU Clock Has Three Weeks Left
Market Sentiment Overview
The week of July 13 to 17 opens after one of the most dramatic single-week whipsaws in this series. Iran introduced new transit fees for vessels passing through the Strait on Monday, which the US immediately opposed. On Tuesday, an oil tanker was struck by an Iranian projectile. The US revoked Iran’s oil export licence, reimposed sanctions, and launched retaliatory airstrikes against Iranian air defence and drone launch sites. Iran responded by targeting US military installations in Bahrain and Kuwait. On Wednesday, President Trump declared the MOU was over and threatened to target Kharg Island (Iran’s primary oil export terminal). By Thursday, the dynamic shifted: Trump said Iran had called to make a deal, the US and Iran stopped exchanging strikes late Thursday, and a US official confirmed that technical talks continue. Markets stabilized into Friday’s close. The net result across markets was a volatile but ultimately contained week. WTI surged more than 5% midweek before pulling back. The Dollar ended the week slightly positive around 101.00 (the war escalation providing safe-haven support that partially offset the NFP-driven dovish repricing). EUR/USD finished essentially unchanged near 1.1400 to 1.1440, trapped below the 20-day SMA all week. GBP/USD was the standout performer, closing near 1.3420 and retaining gains above all three moving averages. Gold’s bullish reversal signal from the prior week was not confirmed (the metal sold off Tuesday through Wednesday as the war escalation drove Dollar safe-haven demand rather than Gold bids, recovering Thursday to end near 4,100 to 4,120). The S&P 500 posted a weekly gain of approximately 1% to 7,575, driven by Meta surging nearly 15% on AI cost reduction commentary and SK Hynix’s record Nasdaq debut at 26.5 billion dollars. Bitcoin recovered to 64,000, with spot ETF flows turning net positive for the first time in eight weeks at approximately 107 million dollars through Thursday. The FOMC Minutes from the June meeting confirmed the hawkish stance but revealed a nuance the market had missed: only ‘a few’ participants judged that further tightening could eventually become appropriate (softer language than the nine dots in the SEP implied). July hike probability sits at approximately 20% and September at 60% per CME FedWatch. The conflict has now seen five rounds of US military strikes on Iran, each following the same pattern: Iranian provocation, US retaliation, brief de-escalation, renewed tension. With approximately three weeks remaining before the 60-day MOU window expires around August 14, the war narrative is entering its most consequential phase since the original ceasefire was signed. Week 19 is the most consequential scheduled data week since the Warsh FOMC debut. The centerpiece is US CPI for June on Tuesday July 15.
Currencies
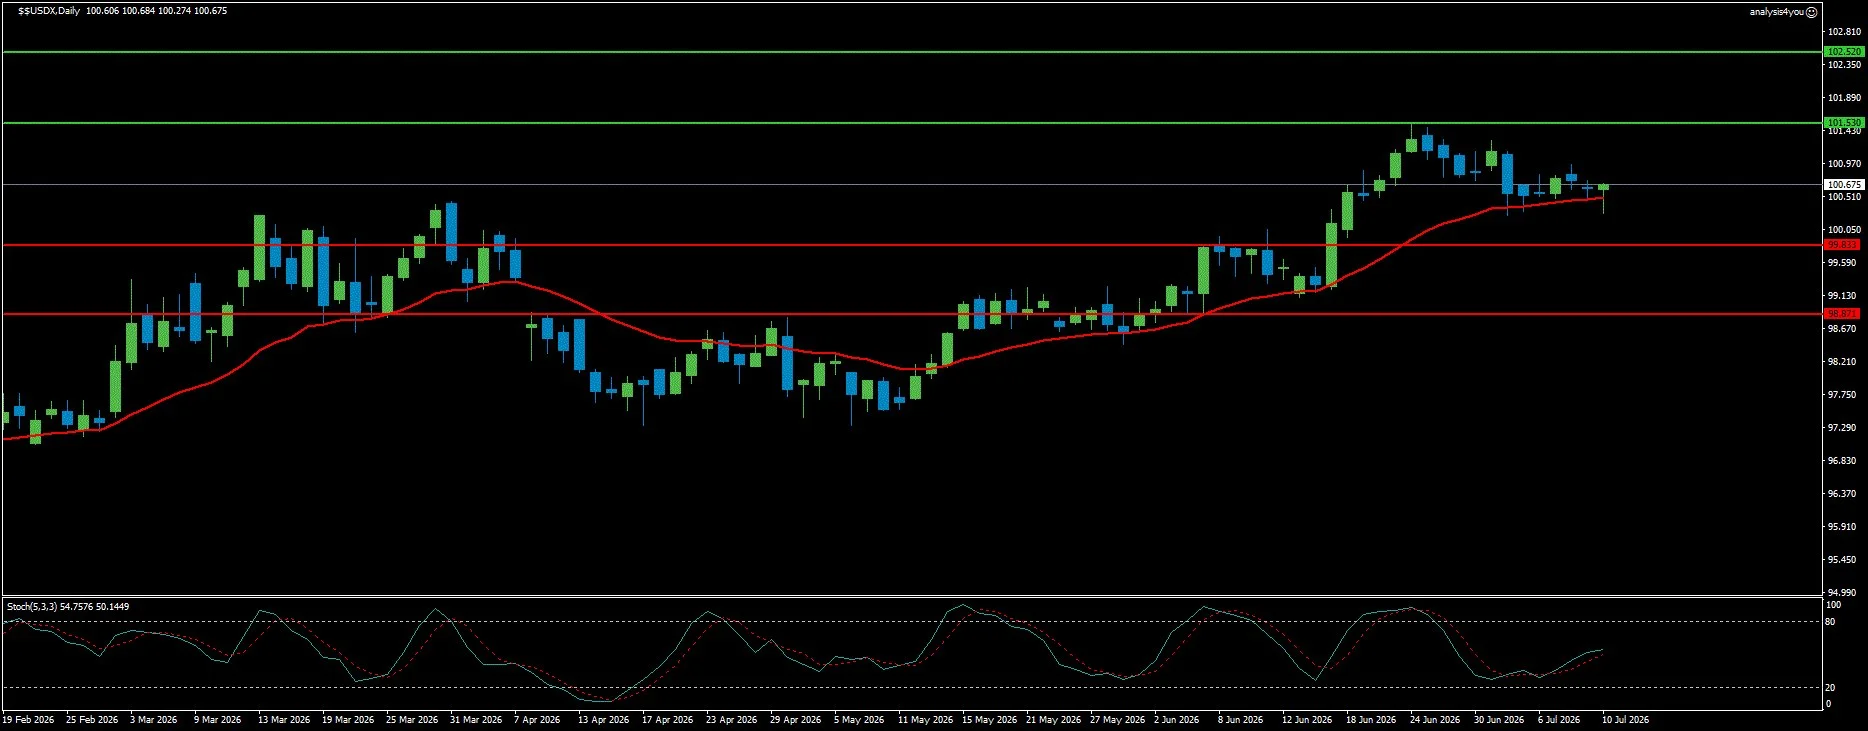
USD Index: War Escalation and Rate Expectations Provide Double-Barrel Support (100.68)
Current Trend: Bullish
Resistance: 101.53 | 102.52
Support: 99.83 | 98.87
The Dollar Index ended Week 18 slightly positive near 101.00, successfully defending against the NFP-driven dovish repricing as the Iran re-escalation provided a competing safe-haven bid. The week illustrated a dynamic that defined the early months of the conflict: when geopolitical risk rises sharply, Dollar safe-haven demand and rate-hawkishness work in the same direction, creating a double-barrel support structure. CFTC speculative positioning showed net longs essentially flat at 13,000 contracts. The positioning at the 57th percentile of the five-year range confirms this is not a crowded trade, leaving room for further Dollar accumulation if CPI data supports the higher-for-longer narrative this week.
The chart shows the DXY above all three moving averages with the MA in a continued upward slope. The current bar is at the middle Bollinger Band and bullish. Stochastic is in an uptrend and overbought with a bullish signal. RSI is neutral. The 101.53 resistance from the recent peak remains the key ceiling.
For Week 19, the Dollar’s trajectory is almost entirely dependent on Tuesday’s CPI release and Warsh’s congressional testimony. A hot CPI print (particularly any surprise in core) would be the most powerful available catalyst for a Dollar rally toward 101.53 and potentially 102.52. A soft print confirming the pace dividend in energy costs would trigger renewed Dollar selling. Warsh’s testimony adds a secondary catalyst: any language suggesting the committee is leaning toward September would support the Dollar; any acknowledgment that the labor market softening is meaningful would weigh on it.Resistance at 101.53 / 102.52.Support at 99.83 / 98.87.
EUR/USD: Trapped Below 20-Day SMA for Three Consecutive Weeks, CPI Is the Binary (1.1415)
Current Trend: Bearish
Resistance: 1.1504 | 1.1609
Support: 1.1333 | 1.1228
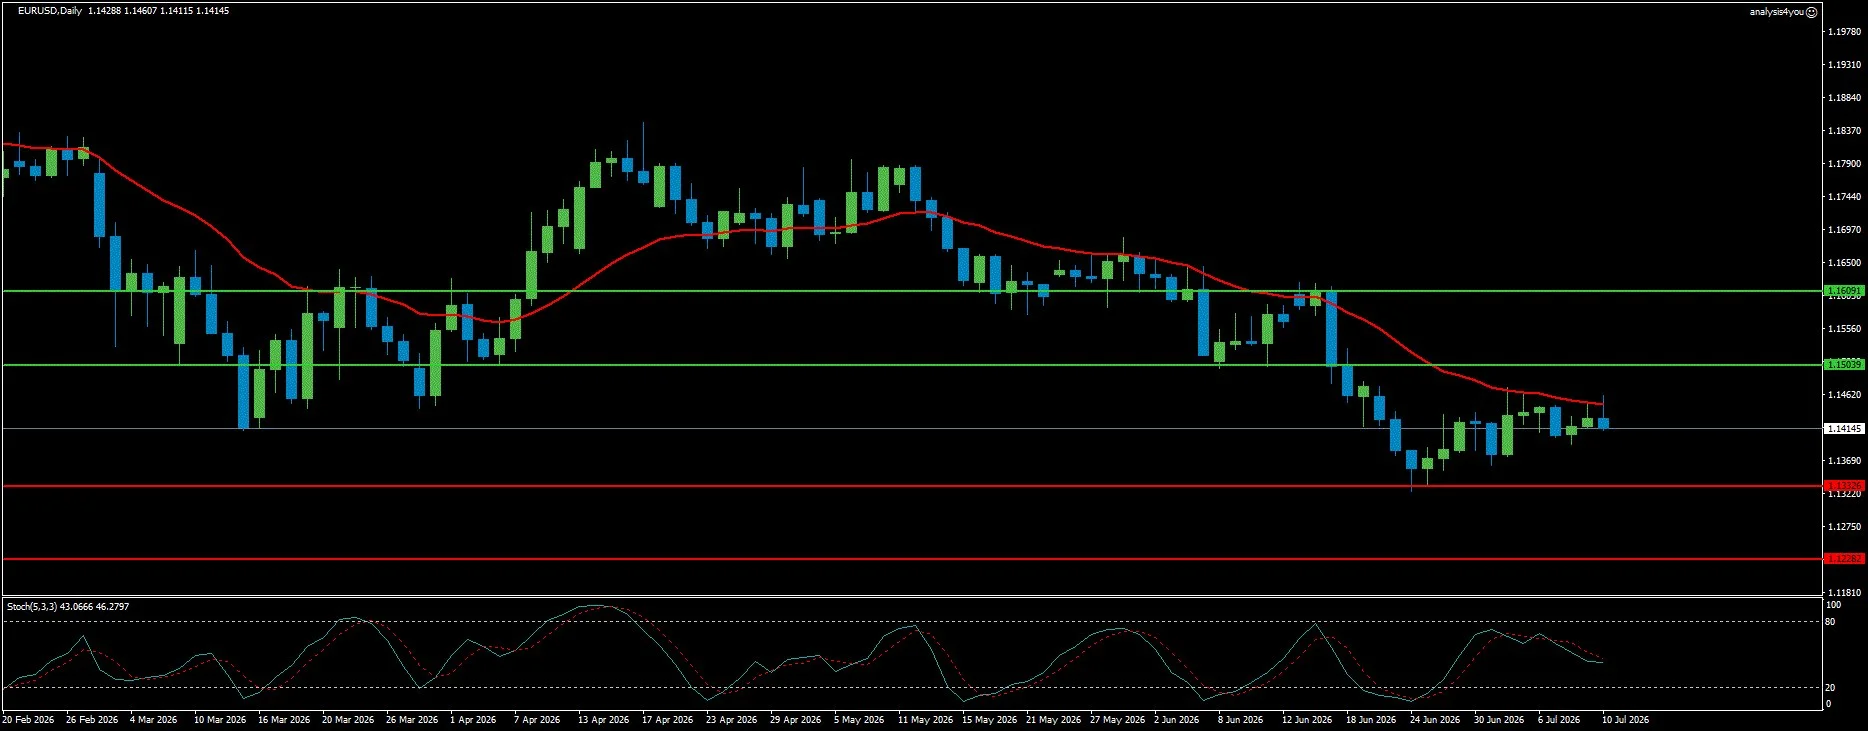
EUR/USD spent the entire week of July 6 to 10 trapped between 1.1400 and 1.1470, with the 20-day SMA acting as a ceiling on every rally attempt. This is the third consecutive week the pair has failed to establish directional momentum. The fundamental picture is one of competing pressures without a clear resolution: the Fed’s rate advantage over the ECB remains intact, but the magnitude of that advantage has been reduced by the NFP miss and the ECB’s own move away from further hikes. Eurozone PPI jumped 5.9% YoY (reinforcing the stagflationary undertow). ECB officials were cautious throughout the week.
The chart confirms the stalemate: EUR/USD is below all three moving averages. The current bar is at the middle Bollinger Band and bearish. Stochastic is in a downtrend and overbought with a bearish signal (the recent recovery bounce is losing steam without a catalyst to extend it). RSI is neutral. The 1.1504 resistance remains intact as the MA cluster ceiling.
Week 19 is the clearest binary setup EUR/USD has faced since the Warsh FOMC meeting. A soft US CPI (particularly a deceleration in core) combined with any dovish nuance from Warsh’s testimony would lift EUR/USD through 1.1504 toward 1.1609. A hot core CPI would confirm the Fed’s hawkish stance and break EUR/USD below 1.1333, potentially toward 1.1228 and the prior multi-year low. The ECB’s lack of fresh hawkish catalysts means EUR/USD is essentially a USD-direction trade this week.
GBP/USD: Standout Performer, Above All Three MAs for First Time Since Conflict Began (1.3398)
Current Trend: Bullish
Resistance: 1.3500 | 1.3605
Support: 1.3298 | 1.3191
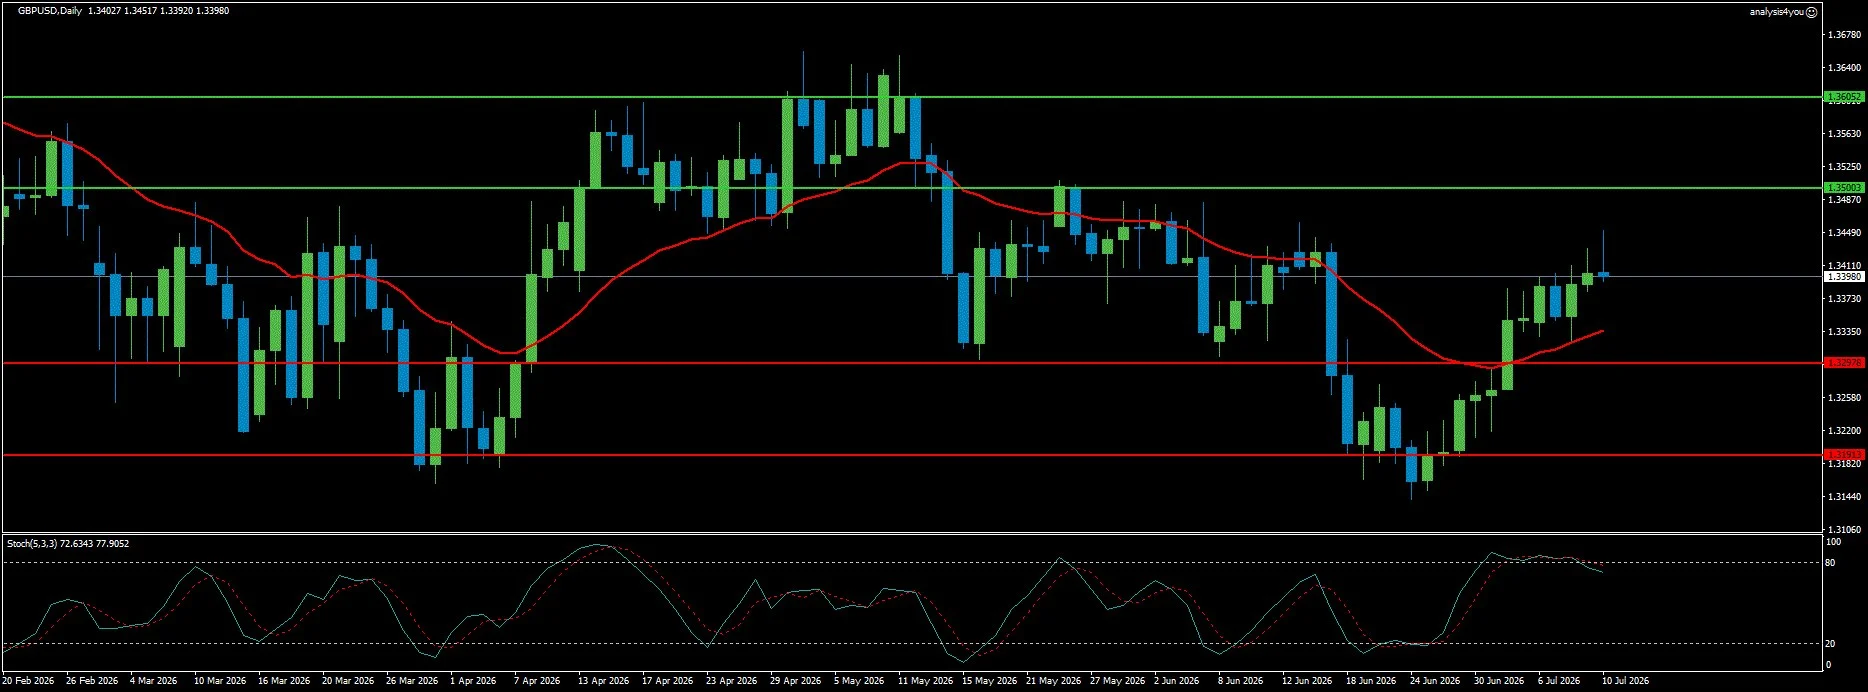
GBP/USD is the standout performer among the major currency pairs entering Week 19. The pair closed Week 18 near 1.3420 and is now above all three moving averages (MA20, MA50, and MA200) for the first time since the conflict began.
The fundamental drivers of Sterling’s outperformance are clear and sustained. First, the BoE-Fed rate differential is moving in Sterling’s favor (money markets price a 70% probability of a BoE hike by year-end versus only 46% for the Fed). Second, the incoming Burnham government confirmed commitment to existing fiscal rules, removing the immediate fear of fiscal deterioration. Third, lower oil prices as Hormuz flows partially normalized reduced UK inflation risks.
The chart confirms the bullish structure. GBP/USD is above all three MAs. The current bar is at the upper Bollinger Band and bearish (a natural pause after the strong run-up). Stochastic is in a downtrend and overbought with a bearish signal. RSI is neutral. These overbought readings suggest the immediate near-term path is consolidation rather than extension. The 1.3500 resistance is the next psychological level (a break above this would confirm the pair is entering a new structural range).
For Week 19, if US CPI disappoints, GBP/USD would be among the biggest beneficiaries given its bullish technical structure. If CPI is hot, the pair would pull back but is unlikely to break below 1.3298 given the underlying BoE-Fed support differential. Resistance at 1.3500 / 1.3605. Support at 1.3298 / 1.3191.
Stocks
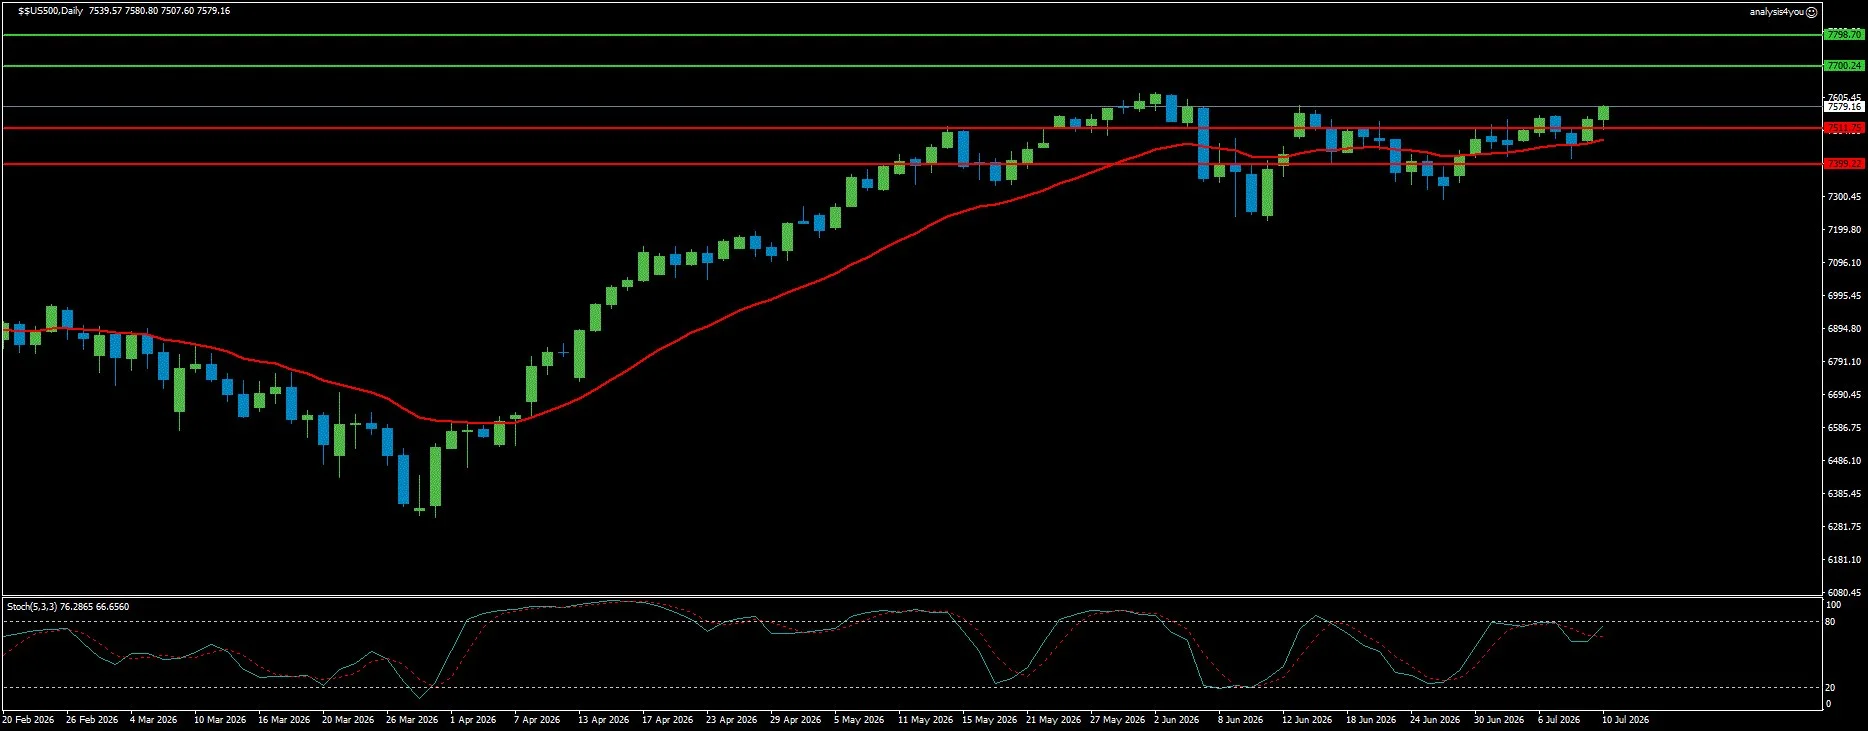
S&P 500: Within 0.6% of Record High, AI Earnings to Drive Direction (7,575)
Current Trend: Bullish
Resistance: 7,700 | 7,799
Support: 7,512 | 7,399
The S&P 500 closed Week 18 at 7,575.39, gaining approximately 1% and bringing the index within 0.6% of its June 2 record closing high of 7,620.90. The weekly performance was driven by a narrow but powerful cohort: Meta Platforms surged nearly 15% on AI infrastructure cost reduction commentary, Nvidia gained 4%, and SK Hynix-led Nasdaq debuted (the largest US listing by a foreign company in history at 26.5 billion dollars) underscored the relentless investor appetite for AI exposure.
The rally’s breadth remains a concern highlighted by multiple strategists. The VIX continued to ease throughout the week, suggesting market participants are becoming more comfortable with the current geopolitical backdrop as long as oil remains contained.
The chart shows the S&P 500 above all three moving averages. The current bar is at the middle Bollinger Band following a pullback from the upper band (a normal consolidation within an uptrend). Stochastic is in a downtrend from overbought with a bearish signal. RSI is neutral. The 7,700 resistance is the next major target. Support at 7,512 is the MA20 floor.
Week 19 could determine whether the S&P 500 makes a new record high or begins a more serious consolidation. A soft CPI print reduces rate pressure on equity valuations (particularly for growth stocks trading at elevated multiples) and could trigger a break above 7,620. A hot CPI would reintroduce the rate premium and test the 7,512 support. Major bank earnings typically kick off the season mid-July, and their commentary on loan demand, net interest margins, and credit quality will set the tone for the broader reporting season. Resistance at 7,700 / 7,799. Support at 7,512 / 7,399.
Commodities
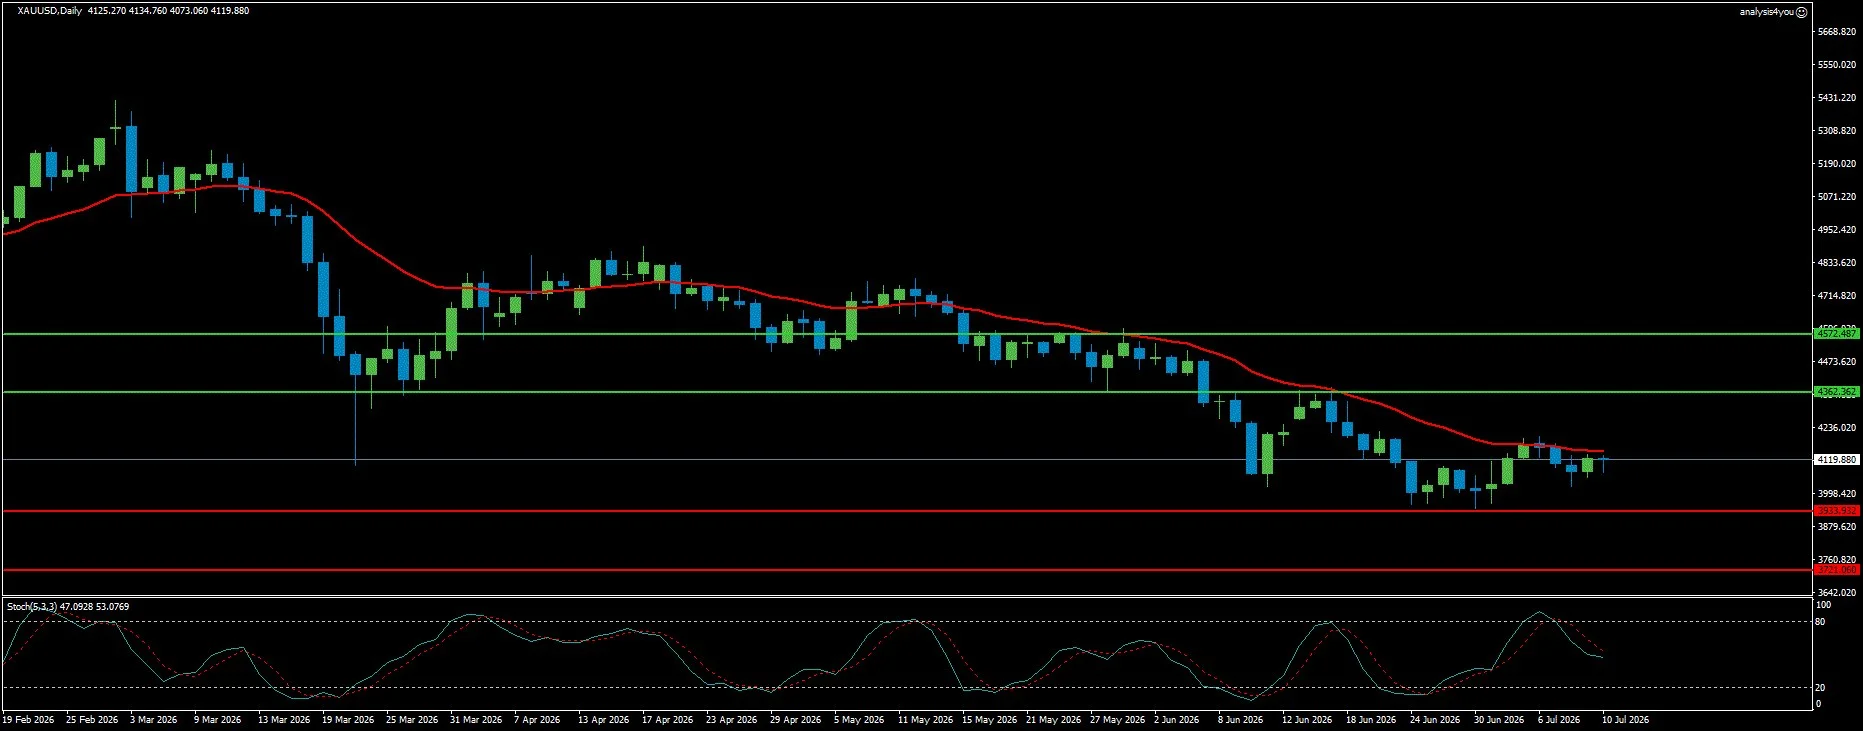
Gold: Bullish Reversal Failed, Bearish Bias Restored, CPI Is the Catalyst (4,120)
Current Trend: Bearish
Resistance: 4,362 | 4,572
Support: 3,934 | 3,721
Gold’s attempted bullish reversal from Week 17 has definitively failed. The metal rose more than 2% the week of June 29, but Week 18 erased those gains as the Iran re-escalation drove Dollar safe-haven demand rather than Gold bids (the same dynamic that characterized the early months of the conflict). When geopolitical risk is accompanied by Dollar strength and rising Treasury yields, Gold loses its safe-haven advantage. The metal dropped more than 1.5% on Monday as the initial Iran escalation hit, continued falling Tuesday through Wednesday as the Dollar surged on war premium, and closed the week near 4,100 to 4,120 (below the critical 20-day SMA and the descending trend line).
The chart is unambiguous. Gold is below all three moving averages. The MA continues its steep downward slope from the January highs near 5,300. The current bar is at the middle Bollinger Band and bearish. Stochastic is in a downtrend and overbought with a bearish signal. RSI is neutral. The descending trend line and 20-day SMA near 4,130 remain intact as the ceiling. China’s PBoC has been increasing Gold reserves for a 20th consecutive month (a structural support factor).
Week 19 places Gold at a genuine crossroads. If June CPI shows both a soft headline and any deceleration in core, rate expectations would pull back and Gold could stage a recovery attempt toward 4,130 and then 4,200. This would be the second attempt at a bullish reversal (and it would need a sustained daily close above 4,130 confirmed by RSI climbing above 50 to be taken seriously). A hot CPI print would be the most bearish outcome for Gold, potentially driving the price toward 3,934. Resistance at 4,362 / 4,572. Support at 3,934 / 3,721.
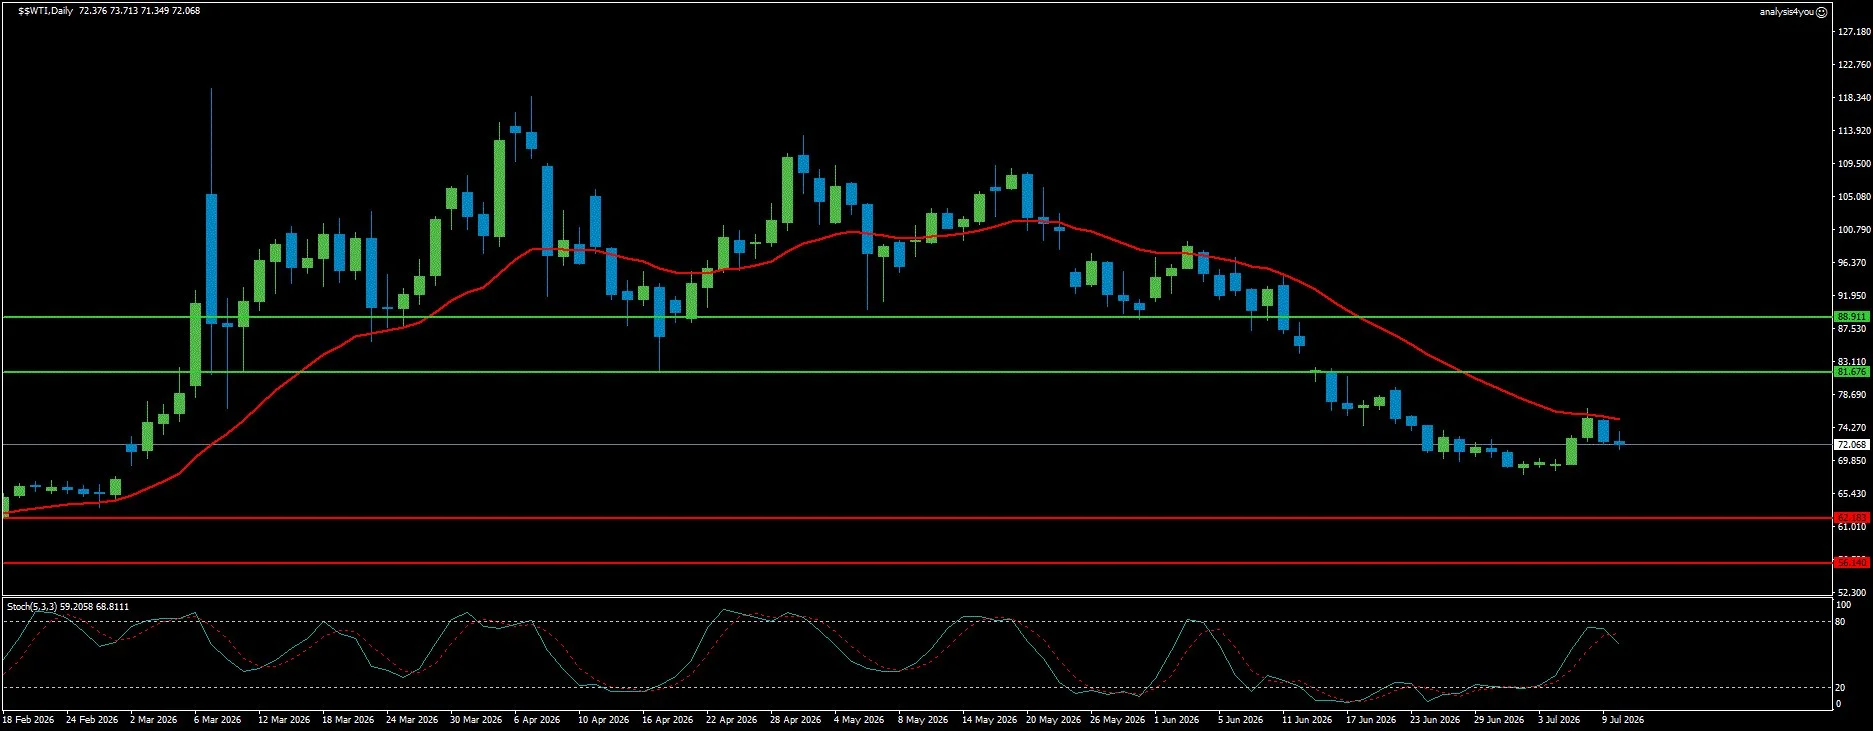
WTI Crude Oil: War Premium Re-Entering, Near Pre-War Support, MOU Clock Ticking (69.36)
Current Trend: Volatile
Resistance: 81.68 | 88.91
Support: 62.18 | 56.14
WTI Crude Oil closed the week at approximately 69.36, near its pre-war levels, but with a weekly gain of over 4% reflecting the mid-week Iran escalation. Oil had nearly completed a full round-trip from the pre-war level of 65 to 70 to the war peak above 115 and back, but the renewed Strait closure and tanker attacks have injected fresh uncertainty into the supply normalization thesis. Tanker traffic through the Strait was near-standstill as of Thursday’s close. The IEA stated directly that the latest escalation undermines its forecast of a significant oil market surplus next year.
Trump’s decision to avoid targeting Iranian energy infrastructure was interpreted as a restraining factor (the market drew reassurance from the fact that refineries and oil fields remained off-limits). The chart shows WTI below all three MAs, at the lower Bollinger Band, with a bullish recovery candle. Stochastic is in an uptrend and overbought with a bullish signal. RSI is neutral. The resistance levels have been revised upward: 81.68 and 88.91 reflect the mid-week escalation spike levels.
For Week 19, WTI remains the most geopolitically sensitive instrument in the portfolio. Any confirmed tanker attack or Strait closure would spike WTI toward 81.68 rapidly. A clean resumption of transit would allow the downtrend to resume toward 62.18. The 60-day MOU window expiring in mid-August creates a countdown dynamic that will increasingly dominate oil market sentiment. Resistance at 81.68 / 88.91. Support at 62.18 / 56.14.
Crypto
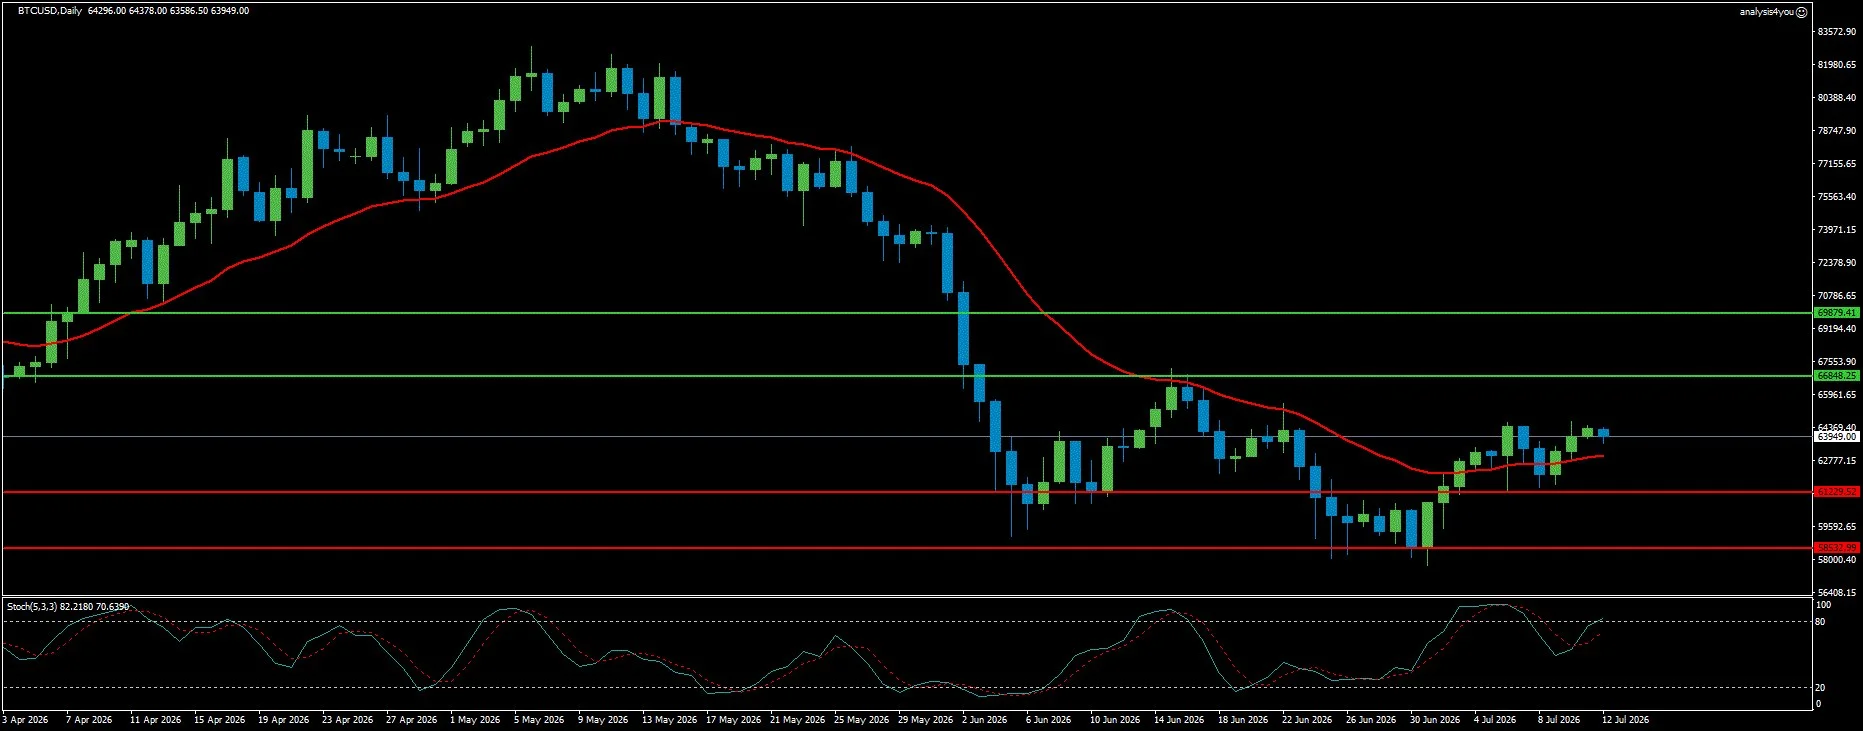
Bitcoin: ETF Flows Turn Positive for First Time in Eight Weeks, CPI Is the Catalyst (63,949)
Current Trend: Cautiously Bullish
Resistance: 66,848 | 69,879
Support: 61,229 | 58,532
Bitcoin extended its recovery to close the week near 63,949 to 64,000, above its 20-day moving average and the 200-week SMA at approximately 62,874. The most important development of the week was the first positive net ETF flow reading in eight weeks (approximately 107 million dollars through Thursday, a modest but symbolically significant inflection). Strategy’s sale of 3,588 BTC for 216 million dollars was initially interpreted as a bearish signal, but the market absorbed it without significant disruption (described as evidence that Bitcoin can function as a genuine liquid corporate treasury asset).
The recovery has been driven by three concurrent factors: the broader improvement in risk sentiment from reduced Fed hike expectations, the quarter-end rebalancing tailwind, and the Iran de-escalation signal on Thursday. The chart shows Bitcoin above its MA20 but still below MA50 and MA200 (which remain in a downward slope overhead). The current bar is at the upper Bollinger Band and bearish (momentum is fading at the resistance zone). Stochastic is in an uptrend and overbought with a bullish signal. RSI is neutral. The 66,848 resistance is the immediate ceiling (where the price has repeatedly failed to sustain over the past month). The 200-week SMA at 62,874 is the critical support floor.
Week 19 presents a clear test for Bitcoin’s recovery momentum. A soft CPI print would reduce Dollar strength, ease rate pressure on risk assets, and provide the macro tailwind that has been absent for two months. If ETF flows remain positive for a second consecutive week alongside a soft CPI, the probability of a sustained recovery toward 66,848 increases materially. A hot CPI would restore the higher-for-longer narrative and likely push Bitcoin back toward the 61,229 support. Resistance at 66,848 / 69,879. Support at 61,229 / 58,532.
Key Events (July 13–17, 2026)
Monday, July 14: Markets open processing the weekend Iran situation. Any Strait incident over the weekend determines Monday’s opening tone.
Tuesday, July 15: US June CPI (THE WEEK’S MOST IMPORTANT DATA RELEASE). The pace dividend month (oil prices were falling sharply in June as the MOU took effect). Consensus expects headline CPI to show a monthly decline of 0.1% following May’s 0.5% increase (producing meaningful deceleration from May’s 4.2%). Core CPI expected to remain sticky near 2.9%. Warsh delivers his Semiannual Monetary Policy Report testimony before the House Financial Services Committee.
Wednesday, July 16: Warsh testifies before the Senate Banking Committee. US PPI for June. Major bank earnings kick off Q2 earnings season.
Thursday, July 17: US June Retail Sales. US Initial Jobless Claims. UK Financial Stability Report.
Friday, July 18: Preliminary Michigan Consumer Sentiment. Continued Q2 earnings.
Week Ahead Outlook
Week 19 is the clearest binary setup of the month. June CPI covers the peace dividend month when energy prices were falling. The outcome determines the direction of every instrument.
Bull Case: Soft CPI Unlocks Risk Rally (approximately 35%)
June CPI shows both a soft headline and any deceleration in core (say core
monthly at 0.1 or 0.2% versus the 0.3% prior). September hike odds fall toward
40%. The Dollar sells off toward 99.83. EUR/USD breaks through 1.1504. GBP/USD
tests 1.3500 and potentially 1.3605. Gold pushes through the 4,130 trend line
toward 4,200 and then 4,280. The S&P 500 breaks to a new record above 7,620.
Bitcoin tests the 66,848 resistance.
Base Case: Split Print, Range Continuation (approximately 40%)
Headline CPI shows meaningful deceleration due to falling gasoline prices, with
core remaining sticky near 2.9%. The market reaction to a split print (soft
headline, sticky core) generates intraday whipsaw before settling. The Dollar
remains supported near 100.50 to 101.00. EUR/USD continues to range between
1.1333 and 1.1504. Gold stabilizes near 4,100 to 4,130, unable to break above
the descending trend line. The S&P 500 consolidates near 7,500 to 7,600
ahead of earnings.
Bear Case: Hot Core CPI Restores September Hike (approximately 25%)
Core CPI prints at 0.4 or 0.5% month-on-month (tariff pass-through and services
inflation accelerating independent of energy). September hike expectations surge
back toward 80%. The Dollar rallies toward 101.53 and tests 102.52. EUR/USD
breaks below 1.1333 toward 1.1228. GBP/USD falls back below 1.3300. Gold is
pushed toward 3,934. The S&P 500 sells off toward 7,399. Bitcoin tests
61,229.
Bottom line: Nineteen weeks into the Iran war, the market is facing its most important single data point since the war began. June CPI, which covers the month when the MOU took effect and Hormuz began reopening. The answer this report delivers will either validate the peace dividend thesis (disinflation underway) or confirm the higher-for-longer narrative (energy relief has not yet moved core). With the MOU clock showing approximately three weeks before expiry on August 14, the countdown dynamic will increasingly dominate all risk asset decisions regardless of this week’s data outcomes. Traders should calibrate risk management accordingly as August approaches.


