S&P 500 Snaps Five-Week Losing Streak, WTI Above $112, April 6 War Deadline Looms
Market Sentiment Overview
The week of April 6 to 10 opens at the most consequential inflection point of the six-week-old Iran war. Monday April 6 is the day all roads converge: the delayed market reaction to Friday’s stronger-than-expected NFP report (178K jobs, unemployment falling to 4.3%), the expiry of Trump’s war deadline to Iran, and the full re-opening of global markets after the Easter holiday closure. The intersection of these three forces on a single trading day makes April 6 potentially the most volatile market open of 2026. The prior week delivered a striking contradiction that defines the current market regime. The S&P 500 posted its best weekly gain since November (up 3.4%, snapping a five-week losing streak) while WTI crude simultaneously surged above $112 per barrel, its highest close in nearly four years. Both moves happened in the same week. This is not a normal risk-on environment. What it reflects is a market bifurcating along a single axis: those positioned for de-escalation (buying equities on ceasefire hope) versus those positioned for continued supply disruption (buying oil on escalation fear). The tension between these two narratives will define every trading day this week. The fundamental picture has shifted materially from a month ago. March NFP crushed expectations at 178K (a complete reversal from February’s revised -133K). US ISM Manufacturing surged to 52.7 with Prices Paid jumping to 78.3 from 70.5, the highest reading in years. German and Eurozone HICP both spiked sharply in March (Germany at 2.8% versus 2% in February, Eurozone at 2.5% versus 1.9%). CME FedWatch now shows an 83% probability the Fed holds rates unchanged through year-end with a non-trivial probability of hikes. The labor market resilience combined with accelerating inflation is the textbook stagflation setup, and it is tightening its grip on every major economy simultaneously.
Currencies
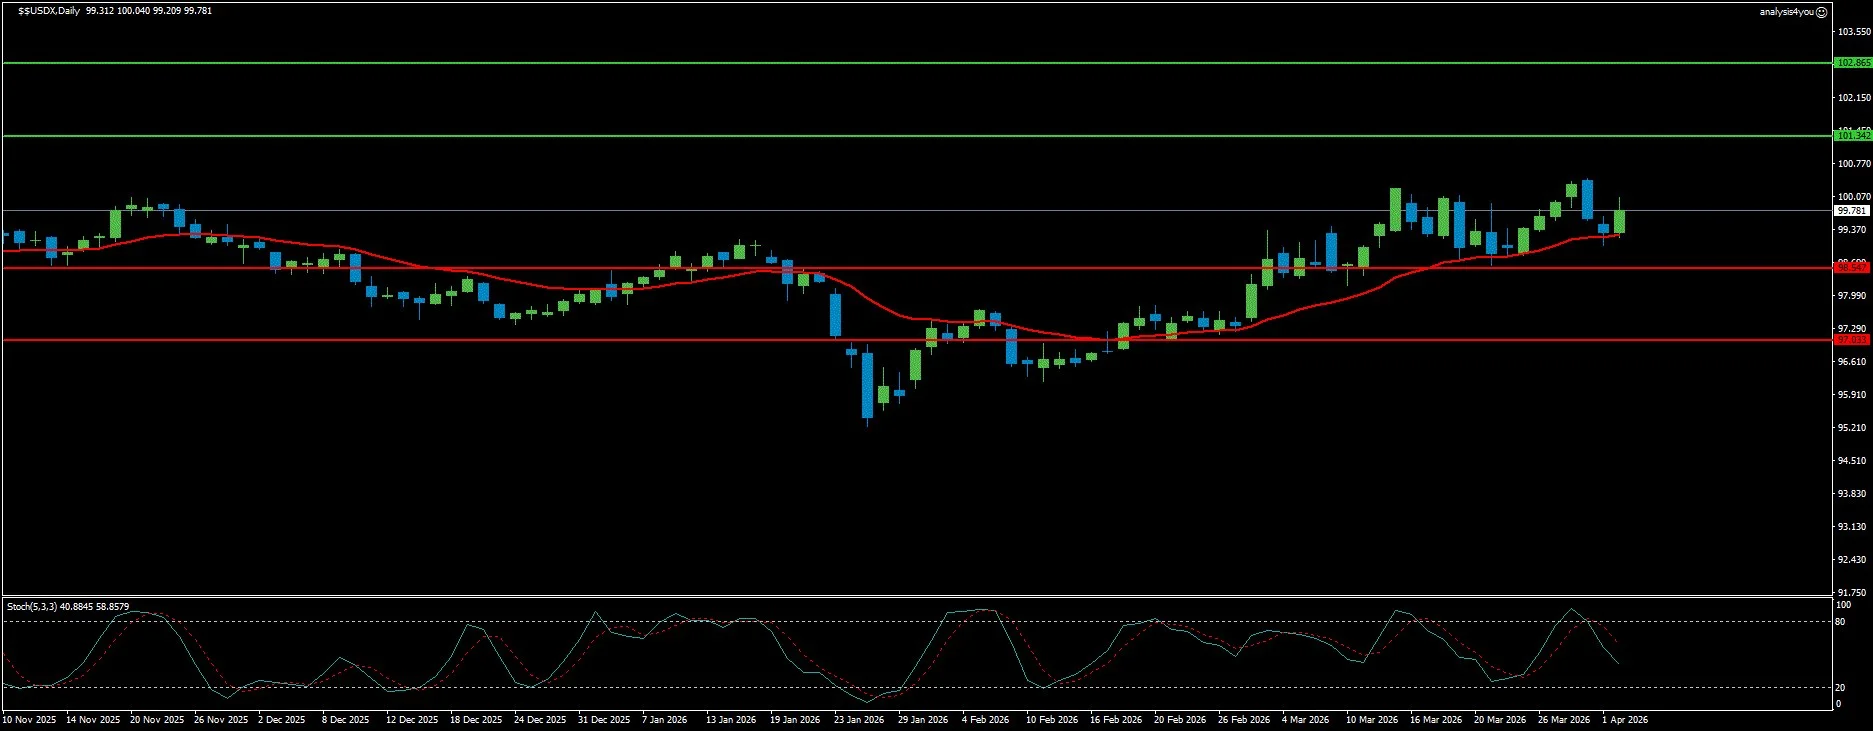
USD Index: Policy Anchor Holds, Geopolitics Tests (99.78)
Current Trend: Bullish
Market Sentiment: Mixed
Resistance: 101.34 | 102.86
Support: 98.55 | 97.03
The US Dollar posted marginal losses last week despite a backdrop that should have been unambiguously bullish (a blowout NFP, surging ISM Prices Paid, and oil above $100). The DXY held comfortably above 100.00, but the inability to push meaningfully higher reflects the genuine two-sidedness of the current environment. On one hand, strong US data reduces Fed rate cut probability and supports the Dollar. On the other, every ceasefire signal (however fleeting) triggers a risk-on surge that briefly undermines the Greenback as capital rotates back into risk assets. The NFP report is the week’s most important retrospective data point. Adding 178K jobs in March (after February’s catastrophic -133K revised figure) tells a story of labor market resilience that complicates the Fed’s calculus enormously. The unemployment rate falling to 4.3% and wage growth easing to 3.5% (from 3.8%) sends a mixed signal: the labor market is not collapsing, which means the Fed has no urgency to cut, but wage growth easing slightly provides some relief on the inflation-from-wages front. The real inflation threat now comes from energy (ISM Prices Paid at 78.3 is near its historical peak range and signals that producer-level inflation is building rapidly). Fed speakers during the week reflected a central bank that is increasingly uncomfortable but not yet ready to act. Powell and Williams held the center with a patient stance. Miran pushed a dovish case, arguing the Fed may already be doing enough. Schmid and Logan pushed back, warning that price pressures may prove stickier than expected. The speculative positioning rebuild (from net short to modest net long with open interest rising) confirms that the market is beginning to align with the Dollar’s underlying support from firm yields and the hawkish Fed backdrop. The FOMC Minutes on Wednesday will be the week’s key Fed event, potentially revealing the internal debate about rate hike scenarios if energy inflation persists. The week’s primary USD catalyst is Friday’s March CPI. After Germany’s HICP jumped from 2% to 2.8% and the Eurozone’s rose from 1.9% to 2.5% in March, a similar upside surprise in US CPI is now the base case expectation. Technically, the daily chart shows DXY consolidating just below the 100.00 level, with the moving average curling upward and providing dynamic support. The Stochastic at 75.93/53.32 is in the upper half of its range, reflecting the positioning rebuild without being overbought. The structure remains a bullish flag (strong base above 98.55 with energy building for a breakout above 101.34). A decisive close above 101.34 (most likely triggered by a hot CPI print or an escalation in the war that drives safe-haven demand) opens 102.86. On the downside, 98.55 is the critical support; a break below on ceasefire news extends the correction toward 97.03.
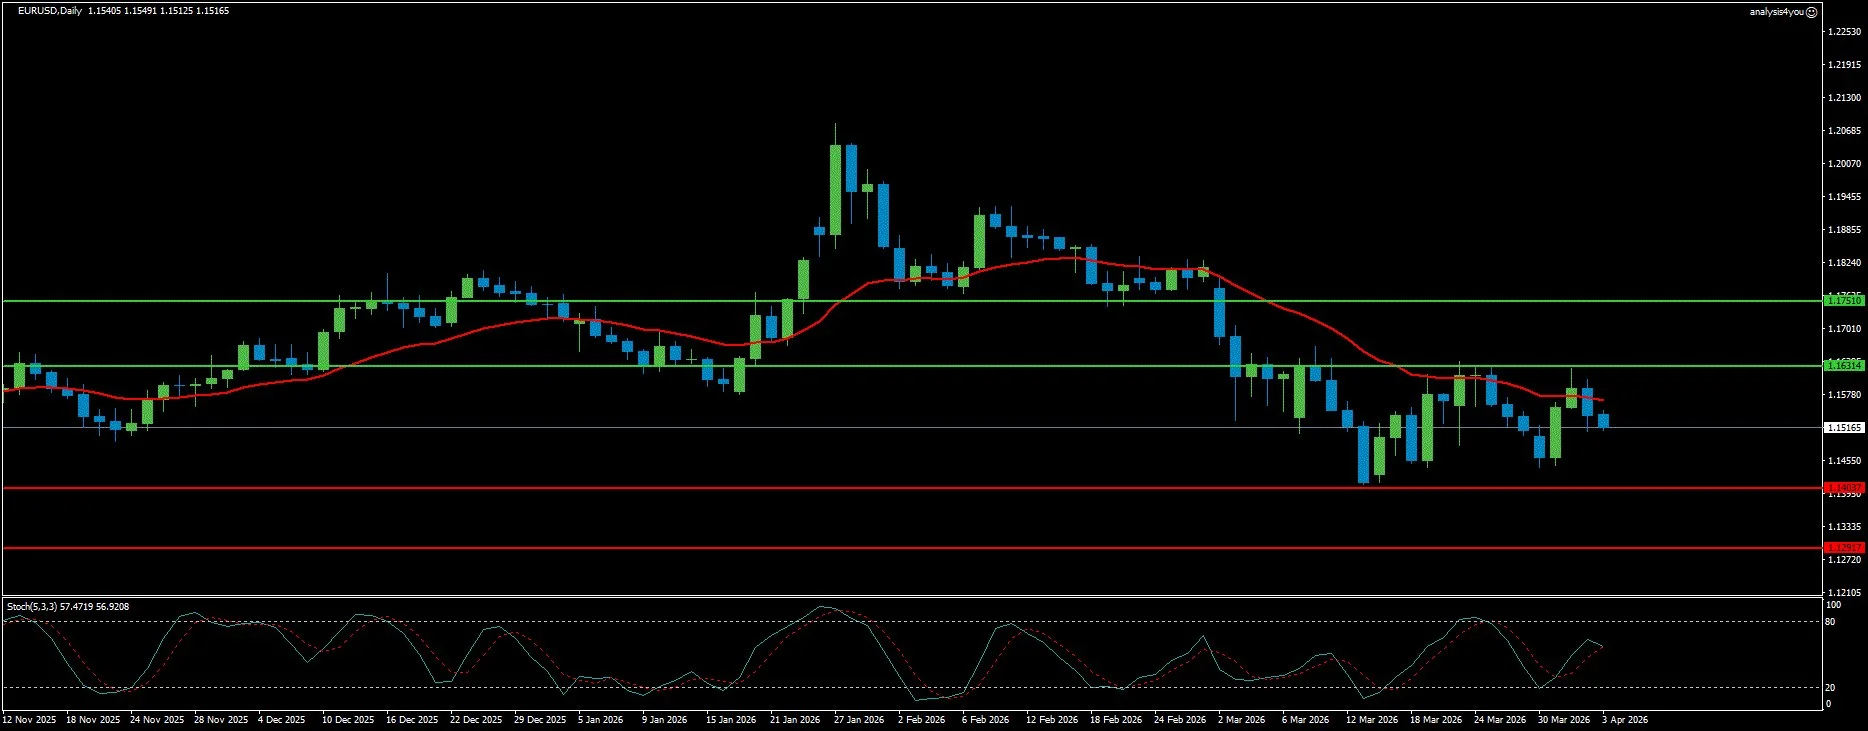
EUR/USD: Fourth Consecutive Range-Bound Week, Bears Wait (1.1517)
Current Trend: Bearish
Market Sentiment: Range-Bound
Resistance: 1.1631 | 1.1751
Support: 1.1404 | 1.1292
EUR/USD has now completed four consecutive weeks of range-bound trading, locked between approximately 1.1400 and 1.1640 without a decisive directional break. The pair seesawed in line with Trump’s war rhetoric (falling on escalation language, recovering on ceasefire signals) but ended the week virtually unchanged near 1.1517. The lack of trend reflects the genuine uncertainty gripping the market: neither bulls nor bears have enough conviction to commit to a sustained directional move until the war resolution becomes clearer. The Eurozone inflation data released last week was the most significant fundamental development for the EUR in weeks. Germany’s HICP jumped from 2.0% to 2.8% in March, and Eurozone HICP rose from 1.9% to 2.5% (both dramatically above February readings and consistent with the energy shock from the Hormuz closure feeding into consumer prices). This creates an acute dilemma for the ECB: the institution has pledged to react promptly if inflation runs out of control, yet hiking rates into a growth slowdown risks triggering a recession in an already fragile European economy. The market is beginning to price the ECB into a hawkish corner (rate hike expectations are firming for later in 2026), and this is providing some structural EUR support that is preventing a deeper selloff below 1.1400. The Houthis entering the conflict with missile attacks on Israel (expanding the war beyond the US-Iran bilateral framework) is an incremental negative for the Eurozone, which sits downstream of Middle Eastern energy supplies. Trump’s suggestion that the US might pull out of NATO due to European allies’ refusal to help reopen the Strait adds a geopolitical dimension that threatens European security architecture. The week ahead brings the most important data sequence of the month. FOMC Minutes on Wednesday could shift Fed expectations if they reveal a hawkish internal debate about tightening. US CPI on Friday is the week’s defining release (any acceleration in headline or core inflation reinforces the higher-for-longer narrative and pressures EUR/USD below 1.1404 support). Technically, the daily chart shows EUR/USD holding below the declining 20-day SMA around 1.1550, which continues to slide under the flattened 100-day and 200-day SMAs clustered near 1.1680 to 1.1690. The RSI hovers in the mid-40s (not oversold, not bullish), consistent with the fourth week of directionless consolidation. The Momentum indicator turned lower and is pressing its midline from above, signaling strengthening downside pressure building beneath the range. The pair has held within a tight range for four consecutive weeks. This type of compression typically resolves with a sharp directional break. The bias remains to the downside given the declining SMA structure. Initial resistance at 1.1600, reinforced by the 20-week SMA at 1.1675. On the downside, the 2026 low at 1.1411 is the first key support (a sustained break below that level exposes the 100-week SMA zone near 1.12 as the next bearish target).
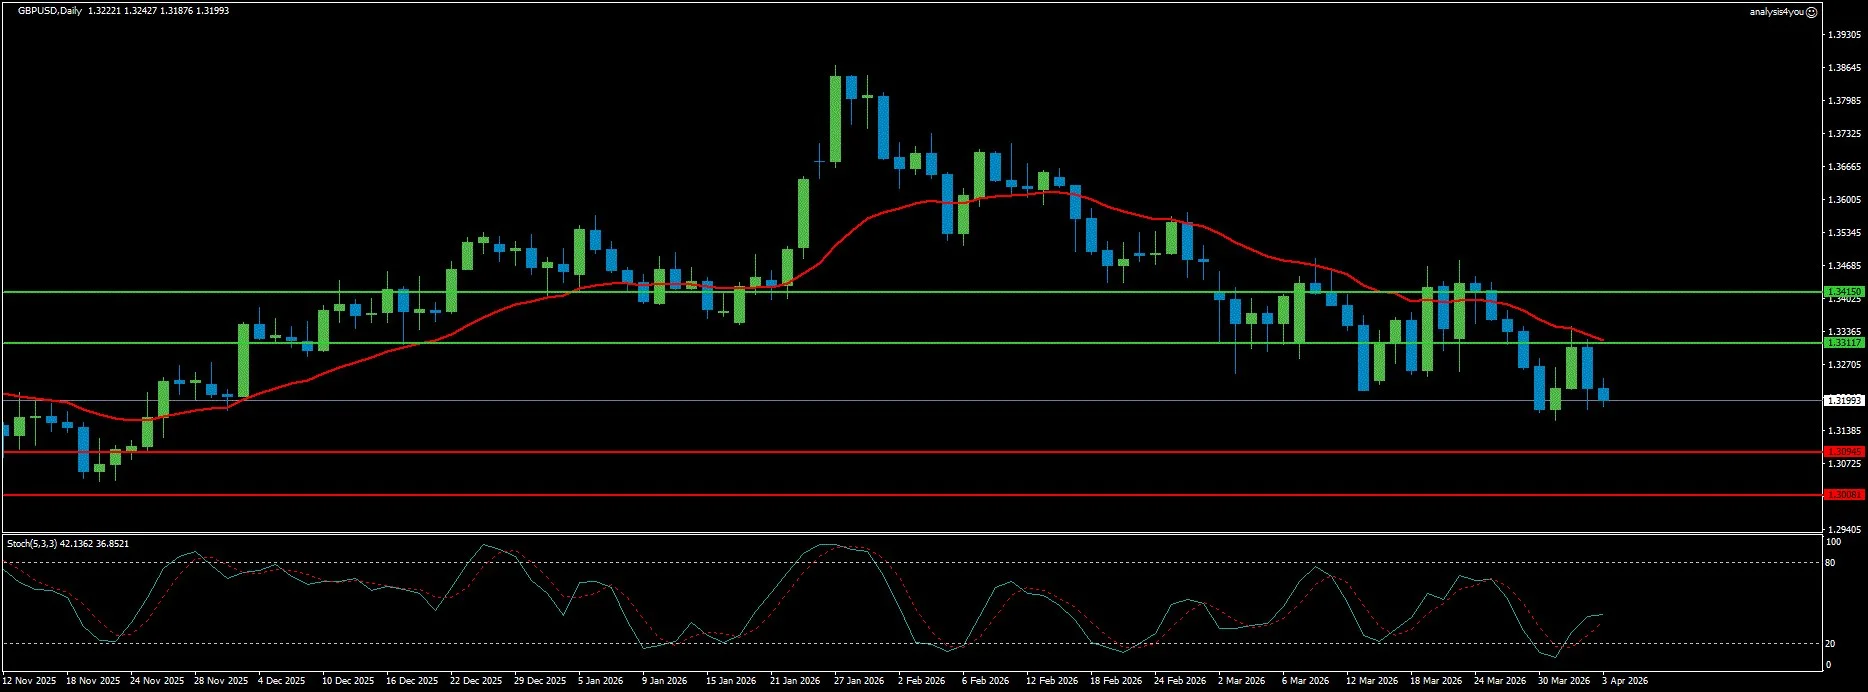
GBP/USD: Rates Supporting, Fundamentals Fragile (1.3199)
Current Trend: Bearish
Market Sentiment: Fragile
Resistance: 1.3312 | 1.3415
Support: 1.3095 | 1.3008
GBP/USD recorded its second consecutive weekly loss, drifting to 1.3199 as geopolitical risk-off flows and a recovering Dollar offset the structural support from the BoE’s hawkish repricing. The pair remains solid on the surface but fragile underneath. The rates story is doing all the heavy lifting (markets are now pricing approximately 50 basis points of BoE tightening by year-end, a dramatic shift from rate cut expectations just months ago) but this support is largely priced in and may begin to fade if economic data deteriorates. The UK stagflation narrative is becoming more entrenched. UK CPI confirmed at 3% for February, already above target before the full energy shock has fed through. The BoE cannot cut without risking inflation entrenchment. But hiking rates into zero GDP growth and a labor market showing unemployment at 5.2% (a five-year high) risks triggering a genuine recession. The UK’s current account deficit and sensitivity to higher borrowing costs add structural vulnerabilities that gilts are beginning to price. Rising long-end gilt yields signal growing concern about fiscal sustainability (not historically a positive backdrop for Sterling). The positioning picture adds nuance. Speculative net shorts in GBP have been narrowing steadily over three weeks, but price action is not confirming the shift. Cable has been navigating the mid-1.33 to 1.34 area without extending meaningfully higher (a pattern that looks more like a slow short squeeze than genuine bullish accumulation). Open interest is declining, pointing to position reduction rather than fresh long-building. If prices do not follow through more strongly, this adjustment could lose momentum quickly (particularly if the Dollar gains ground on hot US CPI data on Friday). The week ahead is dominated by the US data calendar rather than UK releases. Powell at Harvard on Monday sets the early tone. FOMC Minutes Wednesday. US CPI Friday. The April 6 war deadline is the binary geopolitical event. Technically, the daily chart shows GBP/USD below all major SMAs (the 21-day, 50-day, 100-day and 200-day are clustered between 1.3312 and 1.3415, forming a formidable resistance ceiling). The Stochastic at 30.05/50.36 is approaching oversold (a technical bounce is possible), but the RSI at 43 remains below neutral, keeping the downside bias intact. Price is pressing toward the 1.3173/1.3095 support zone. Resistance at 1.3312 is the immediate SMA barrier (a break above that level opens 1.3415 where the SMA cluster provides stronger resistance). On the downside, 1.3095 is the first meaningful support, with 1.3008 and the psychological 1.3000 level as the deeper floor.
Stocks
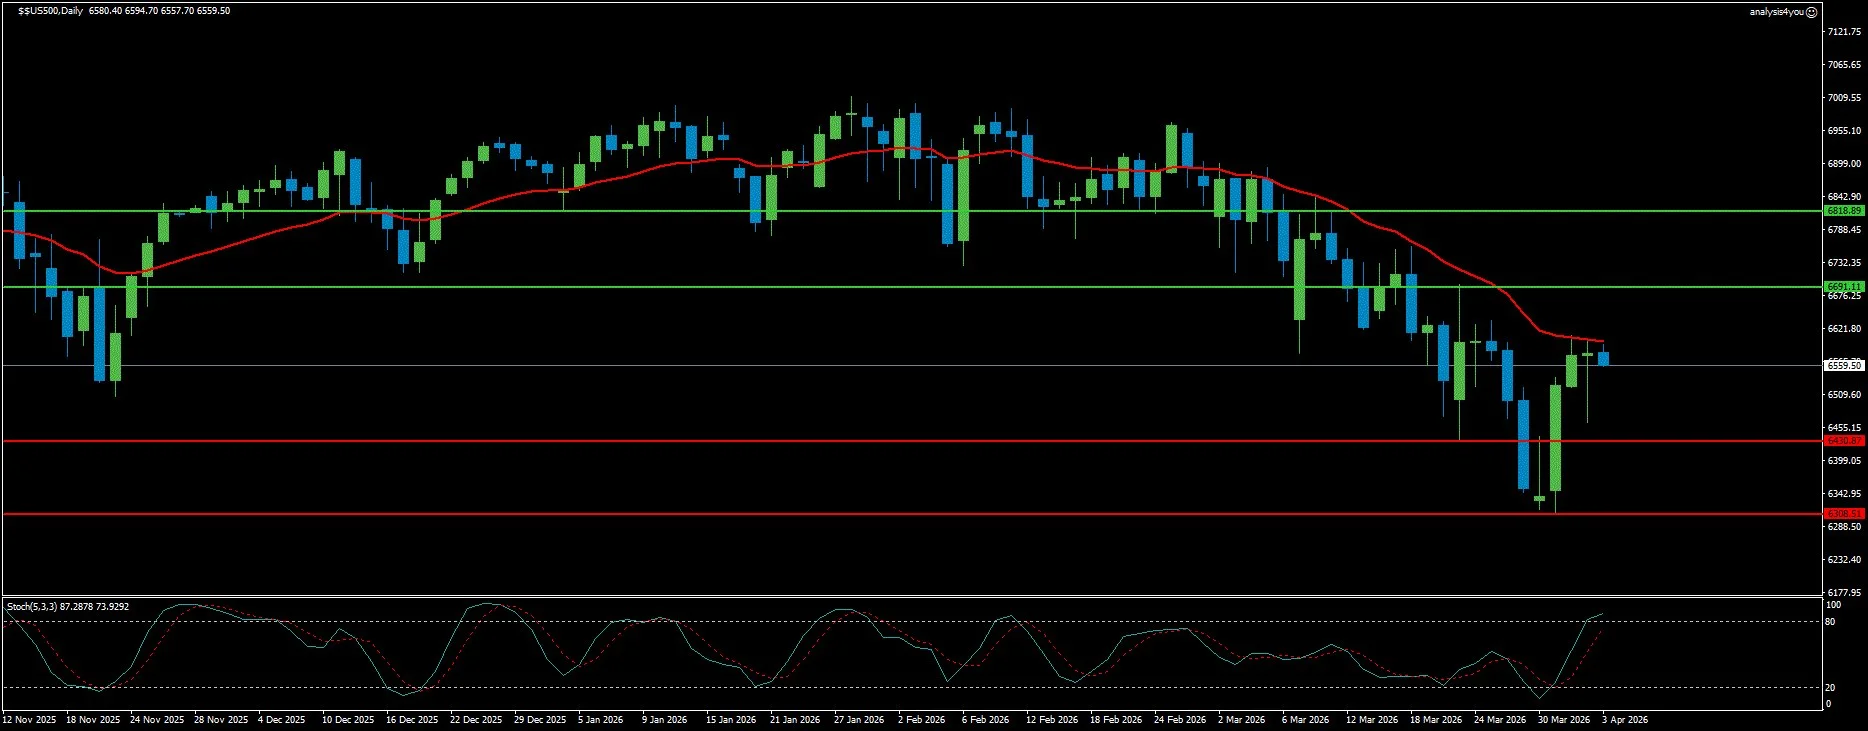
S&P 500: Five-Week Losing Streak Snapped, But Conviction Thin (6,560)
Current Trend: Cautiously Bullish (Counter-Trend Rally)
Market Sentiment: Skeptical
Resistance: 6,691 | 6,819
Support: 6,431 | 6,309
The S&P 500 snapped its five-week losing streak with a 3.4% gain (its best weekly performance since November), closing at 6,560. The recovery was real but the conviction behind it was not. This looked more like a slow tactical dip-buy than a structural return of risk appetite. The market rallied on hope, then wobbled repeatedly when hard details failed to follow. The Cboe VIX remained near 24 (elevated, not fearful, but certainly not complacent), signaling that the underlying anxiety has not dissipated. The week’s price action played out in the pattern that has defined the past six weeks: markets opened sharply lower after Trump’s Wednesday national address undermined Hormuz reopening hopes, then recovered in the afternoon session when Iranian state media reported the Iran-Oman Strait protocol was being finalized. A single geopolitical headline moved the index from -1.5% to +0.4% in a single session. This is not a market trading fundamentals (it is a market trading binary war outcomes with every day presenting a fresh opportunity for the tape to move violently in either direction). The economic data released during the week was genuinely constructive (initial jobless claims fell to one of the lowest levels in nearly two years, Retail Sales beat at +0.6%, ISM Manufacturing surged to 52.7). Under normal circumstances, this data powers a sustained rally. Instead it played second fiddle to geopolitical headlines. The labor market’s resilience (confirmed by Friday’s 178K NFP) eliminates the downside risk of a labor-driven recession in the near term, but the Prices Paid component of ISM at 78.3 signals that the inflation shock from energy is now feeding aggressively into the production economy. The sector rotation continues to define the hidden story beneath the index. Energy remains the standout (oil majors at multi-year and all-time highs, LNG exporters up 20% to 37% month-to-date). Defense names RTX, LMT and NOC have posted substantial gains. These long-war beneficiaries are masking significant damage in consumer discretionary, tech, travel and homebuilders. Tesla falling 5.4% on one of its weakest delivery quarters in years reflects the broader demand destruction from elevated energy costs and consumer confidence erosion. The week ahead brings the most important data sequence for equities: FOMC Minutes on Wednesday (revealing the internal rate hike debate) and US March CPI on Friday (the first full read of energy-driven inflation). Technically, the daily chart shows a meaningful recovery from the 6,352 low, with price now at 6,560. The death cross (50-day and 200-day WMA crossover) remains intact and the declining MA still provides resistance overhead. The Stochastic at 25.86/41.31 is recovering from deeply oversold levels, consistent with the technical bounce. The ADX at 40 still signals an established downtrend. Resistance at 6,691 is the first meaningful ceiling (a break above that level significantly eases bearish pressure and opens the path toward 6,819, where the declining MA provides stronger resistance). On the downside, 6,431 is the first support, with 6,309 below.
Commodities
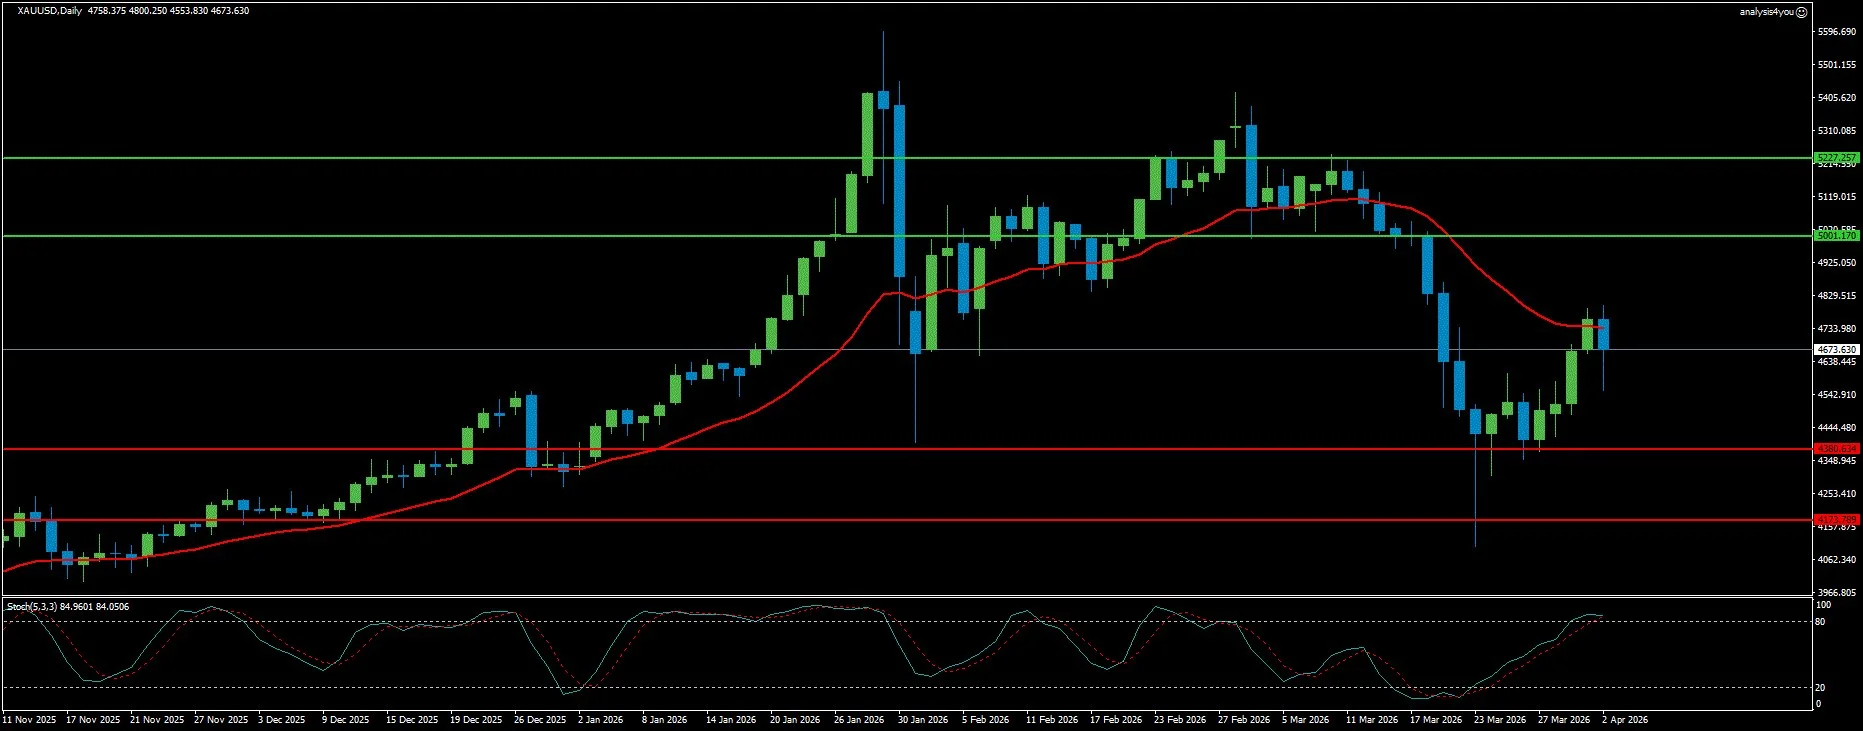
Gold: Bulls Hesitate, CPI and War Deadline Are the Keys (4,674)
Current Trend: Neutral (Range-Bound)
Market Sentiment: Volatile
Resistance: 5,001 | 5,227
Support: 4,381 | 4,174
Gold closed the week at $4,674 after one of its most volatile weekly performances in months (swinging from $4,420 at the open to nearly $4,800 mid-week on ceasefire optimism, then pulling back sharply when Trump’s Wednesday address reintroduced escalation fears). The yellow metal is caught in the same binary war narrative as every other asset class, but with an added complexity: the inverse correlation between oil and Gold that has defined the past six weeks remains operative. Higher oil means higher inflation, higher inflation means higher-for-longer rates, and higher rates are bearish for Gold despite the geopolitical backdrop. The week’s key Gold dynamic was the two-day recovery rally that gained over 5% as de-escalation hopes emerged early in the week. Trump’s suggestion that the US might exit Iran in two to three weeks, Iran’s positive response from President Pezeshkian (who told EU Council President Costa that Iran was ready to end the war given certain guarantees), and the WSJ report that Trump was considering ending the campaign even if Hormuz remains closed (all of these combined to drive a genuine safe-haven and risk-relief bid in Gold). The $4,800 high touched mid-week represents the upper boundary of what ceasefire optimism can price into Gold under current conditions. The pullback from $4,800 to $4,674 was equally instructive. Trump’s Wednesday national address (threatening to hit Iran extremely hard over the next two to three weeks, denying the US needs the Strait of Hormuz, threatening Iran would be sent to the stone age if no deal is reached) immediately revived oil supply fears, pushed crude above $110, drove Treasury yields higher, and pulled the rug from under Gold’s recovery. The Gold market has now established a clear range: approximately $4,400 on the downside (where the 200-day SMA and prior lows provide support) and approximately $4,800 on the upside (where ceasefire optimism is fully priced). CME FedWatch shows approximately 83% probability the Fed holds rates unchanged through year-end (but with a non-trivial rate hike probability creeping in). Wednesday’s FOMC Minutes will be scrutinized for any language around tightening scenarios. Friday’s CPI is the week’s defining data point. Technically, the daily chart shows Gold recovering from the $4,100 war-low and now trading at $4,674 (which coincides precisely with the pivot area at $4,650 to $4,680, where the 100-day SMA and Fibonacci 50% retracement converge). This is a critical technical juncture. Gold failed to stabilize above the 20-day SMA ($4,780) in the prior week, and the RSI turned south after testing the 50 line (highlighting buyers’ hesitancy at this level). A decisive break above the $4,650 to $4,680 pivot and a close above the 20-day SMA at $4,780 opens the path toward $4,860 (Fibonacci 38.2%) and $4,950 (50-day SMA), and eventually the psychological $5,001 resistance. On the downside, $4,500 (Fibonacci 61.8%) is the first meaningful support, with $4,381 the next level and $4,240 (Fibonacci 78.6%) below.
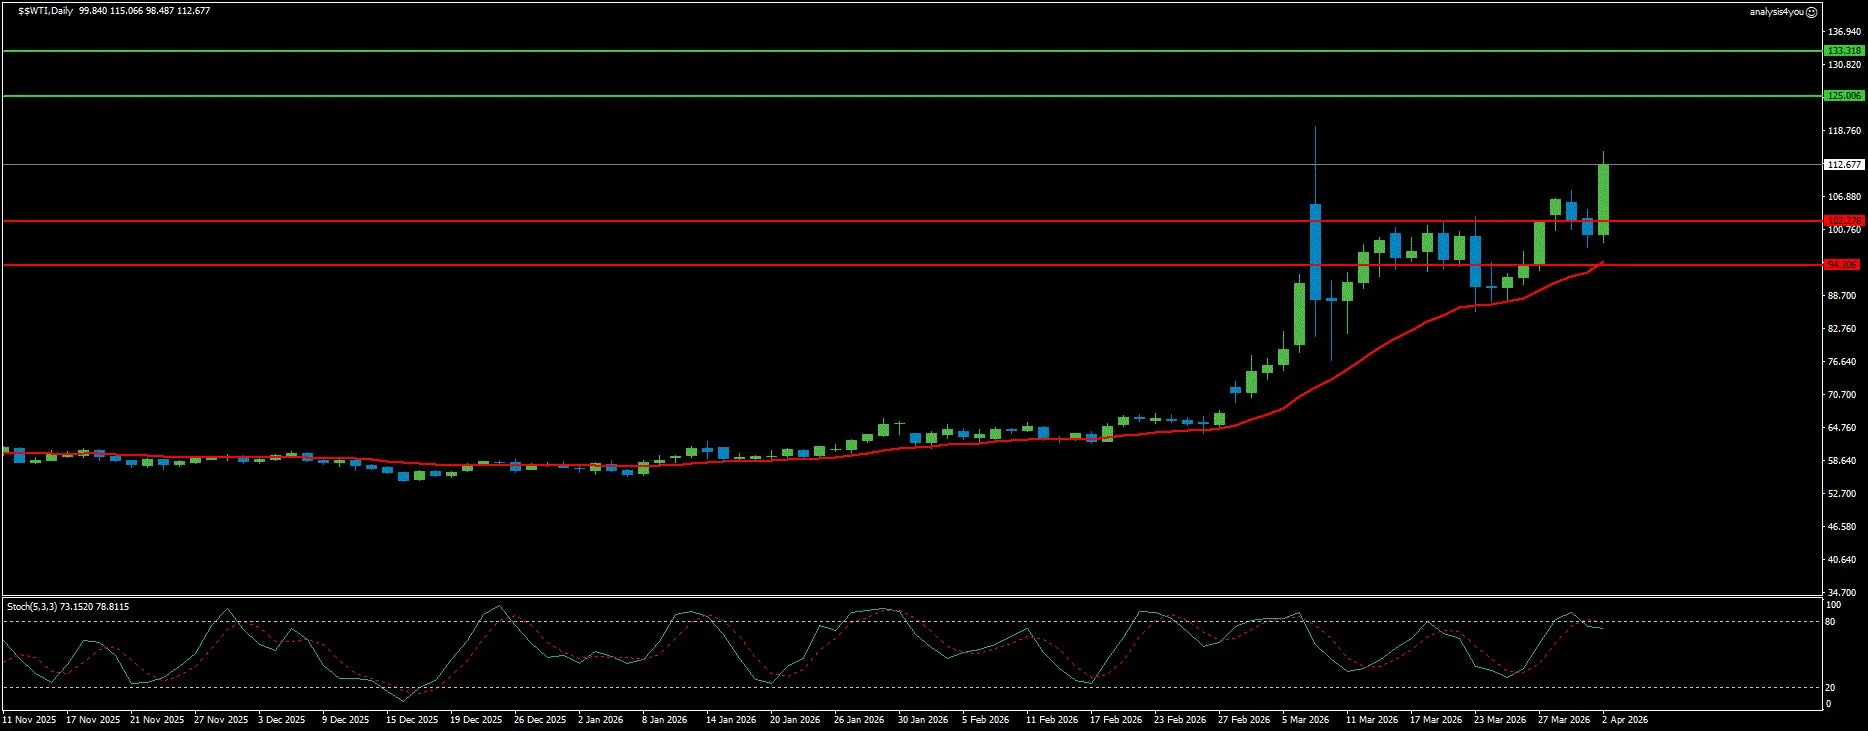
WTI Crude Oil: Above $112, Trump Deadline Opens New Escalation Risk (112.68)
Current Trend: Bullish
Market Sentiment: Fear (Supply Crisis)
Resistance: 125.01 | 133.32
Support: 102.28 | 94.31
WTI crude oil closed the week at $112.68 (having surged approximately 12% in a single session on April 2 when Trump’s national address crushed ceasefire hopes and drove oil above $110 for the first time since 2022). The commodity has now gained over 104% from its lowest level this year and has made history by briefly flipping above Brent crude (the global benchmark) for the first time in years, reflecting the unique US Gulf Coast supply tightness driven by domestic demand for inland barrels. The supply disruption picture has broadened further. WTI’s weekly gain of over 10% was driven by: Trump threatening intensified military action over the next two to three weeks with no clarity on Hormuz reopening; Iran’s IRGC targeting US-linked steel and aluminum facilities; Houthi expansion of missile attacks to Israel; and Iraq’s ongoing force majeure on foreign-operated oilfields. US crude inventories rising 5.5 million barrels to 461.6 million (0.1% above the five-year average) provided a brief bearish counter, but was overwhelmed by the supply fear premium. The constructive signals are few but not absent. Iran and Oman are reportedly finalizing a protocol for Hormuz transit. More ships from China, India and France have been crossing the Strait. The UK is hosting virtual discussions with 40 countries on Hormuz reopening. Trump himself said the war will last only another two to three weeks (implying a self-imposed end date). The week’s defining event for oil is Monday April 6 (Trump’s deadline expiry). Technically, the weekly chart confirms WTI has formed a double-bottom pattern with a neckline at $77.52, moved above a descending trendline connecting highs since September 2023, and the RSI has surged to extreme overbought at 86. A golden cross (50-week and 200-week EMAs converging) is forming. The bullish momentum is historically extreme. However, the RSI at 86 warns of a potential short-term consolidation or pullback before the next leg higher. The next key technical resistance is $120 (Citi’s near-term target). The $102.28 level (former resistance, now support) is the critical floor that must hold to maintain the bullish structure. A break below $102 signals a de-escalation selloff, with $94.31 as the next support. On the upside, $125.01 is the immediate resistance, with $133.32 the next level.
Crypto
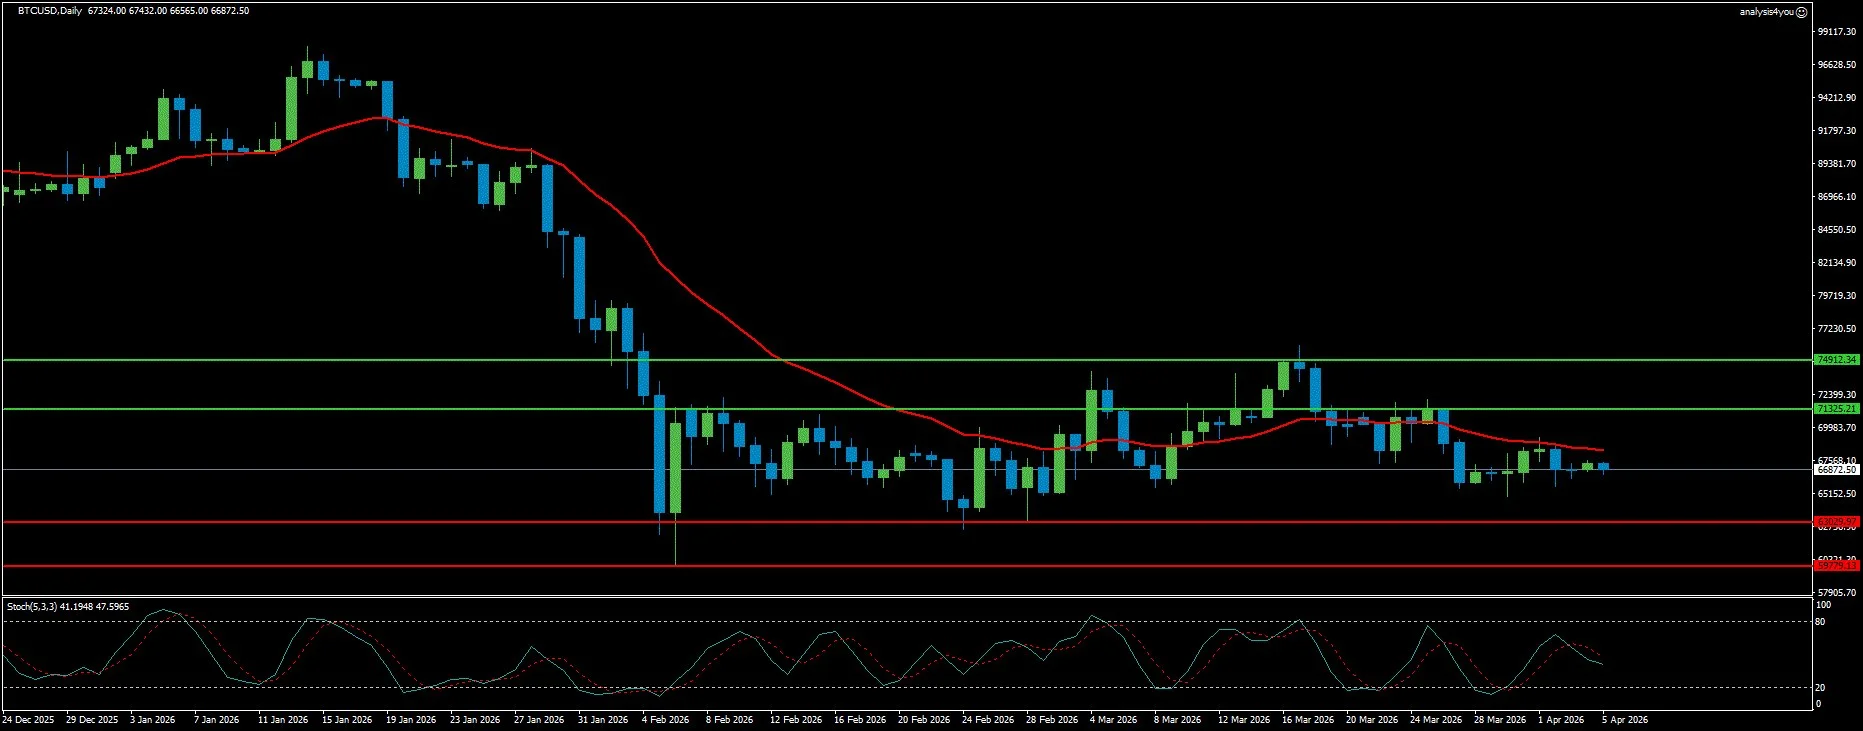
Bitcoin: Key Support Approached, Quantum Fears Add Noise (66,873)
Current Trend: Bearish
Market Sentiment: Vulnerable
Resistance: 71,325 | 74,912
Support: 63,030 | 59,779
Bitcoin approached but held above its key support zone into the end of the week, trading near $66,873 after nearly erasing an earlier weekly recovery. The Crypto King briefly reached $69,310 mid-week as Trump’s early ceasefire signals boosted risk appetite, but reversed sharply when his Wednesday national address reintroduced escalation rhetoric. The pattern of BTC recovering on ceasefire hope and selling on escalation (mirroring equities) has now become well-established, though with a lag relative to equities and with less volatility. The institutional flow picture produced a subtle positive surprise (spot Bitcoin ETFs recorded a net inflow of $22.34 million for the week as of Thursday, with three inflow days and one outflow day). While modest, this represents a reversal from the net outflow of $70.71 million the prior week and suggests institutional investors have not fully abandoned Bitcoin despite the war uncertainty. Strategy (Michael Saylor) continued its aggressive accumulation, purchasing another 1,031 BTC for $76.6 million (though notably smaller than the 22,337 BTC purchased the prior week), bringing total holdings to 762,099 BTC. The most important structural revelation of the week came from CryptoQuant’s analysis: Strategy is now effectively the sole driver of Bitcoin treasury demand, having accumulated over 45,000 BTC in the last 30 days (the highest 30-day purchase since April 2025). All other treasury companies combined purchased only 1,000 BTC in the same period, a 99% collapse from the 69,000 BTC peak in August 2025. CryptoQuant’s Head of Research Julio Moreno stated clearly that Strategy by itself cannot support Bitcoin’s price for long (overall demand needs to grow, which is not the case today). The 30-day apparent demand growth stands at approximately -63,000 BTC, meaning total market selling pressure more than offsets even Strategy’s aggressive buying. Large whale holders (1,000 to 10,000 BTC) have turned net distributors, with the 1-year change in whale holdings reaching -188,000 BTC. Google Quantum AI’s white paper warning about the potential to crack encrypted wallets in under 10 minutes under advanced quantum scenarios added market noise but was appropriately contextualized by QCP Capital (current quantum systems operate at roughly 1,000x below the threshold required for a practical attack). The historical seasonality argument offers a constructive counterpoint. Bitcoin has delivered positive returns in April historically, averaging gains of 11.96%. Technically, the daily chart shows BTC holding within its parallel channel, trading near the lower boundary around $65,900 to $66,000. Price remains well below the clustered 50-day, 100-day and 200-day EMAs between $71,900 and $77,600, which continue to cap any upside and frame the current price action as a corrective bounce within a broader downtrend. The Stochastic at 12.71/22.73 is deeply oversold (the most extreme reading since early February when the $65,000 floor held). The 200-week EMA at $68,031 is the critical dynamic support that BTC has been rejected from repeatedly. A decisive weekly close below $65,520 (78.6% Fibonacci retracement) opens the path toward the $60,000 psychological level.
Key Events This Week (April 6-10, 2026)
Monday, April 6: CRITICAL DAY. Markets fully reopen post-Easter. NFP reaction fully priced in Trump’s war deadline expiry (the most important single event of the week). Fed Chair Powell speaks at Harvard University (moderated discussion). US ISM Services PMI (March) (watch for Services Prices Paid component). EU Sentix Investor Confidence (April).
Tuesday, April 7: US Durable Goods Orders (February). Germany and Eurozone data. Market absorbing the April 6 war headline fallout.
Wednesday, April 8: FOMC Minutes from the March 18 meeting. This is the week’s most important scheduled Fed event. Markets will scrutinize the internal debate around rate hike scenarios if energy inflation persists. Eurozone Retail Sales (February) and PPI data.
Thursday, April 9: US Q4 GDP third estimate. US Initial Jobless Claims. BoE speakers. Additional Fed speakers post-FOMC Minutes.
Friday, April 10: US March CPI. This is the week’s single most important scheduled data release. After Germany’s HICP jumped from 2% to 2.8% and Eurozone HICP from 1.9% to 2.5%, a significant uplift in US headline CPI is the base expectation. Preliminary Michigan Consumer Sentiment (April). Germany final March HICP.
GEOPOLITICAL OVERRIDE: Monday April 6 war deadline expiry dominates all scheduled events.
Week Ahead Outlook
The week of April 6 to 10 is defined by a convergence that no market participant can ignore: the war deadline, the full NFP reaction, the FOMC Minutes, and the first March CPI print (all in a single week). The last time the global market faced this density of binary risk was the week of the first US-Israel strikes on Iran February 28. The difference is that markets are now six weeks wiser about how this conflict evolves (and significantly more skeptical of any diplomatic signal from either side).
Scenario 1: Escalation (Ground Operation Announced, approximately 30%): Trump announces ground operations on Kharg Island or deploys significant land forces in Iran. WTI spikes above $125 toward $133. S&P 500 gaps lower below 6,431 toward 6,309, potential testing 6,000 again. Gold spikes sharply as genuine fear premium returns ($5,001 resistance tested). EUR/USD and GBP/USD sell off as risk-off dominates and USD surges through 101.34 toward 102.86. Bitcoin tests $63,030 critical support and potentially $59,779 below.
Scenario 2: Another Extension / Diplomatic Stalemate (approximately 45%): Trump extends the deadline again or announces a new pause. Iran-Oman Strait protocol talks progress but produce no immediate reopening. Markets largely ignore the extension as they have twice before. WTI consolidates $102 to $112. S&P 500 continues recovery toward 6,691 resistance in dip-buying. Gold holds $4,650 to $4,680 pivot zone and edges toward $4,780. EUR/USD remains range-bound 1.1404 to 1.1631. GBP/USD holds 1.3095 to 1.312 range. Bitcoin remains in $63,000 to $72,600 channel. US CPI on Friday becomes the week’s dominant driver.
Scenario 3: De-escalation (Ceasefire Framework Confirmed, approximately 25%): Both Iran and the US confirm a ceasefire framework. Hormuz reopening timeline announced. WTI crashes $20 to $25 toward $87 to $90 in a single session (the sharpest single-day oil decline since the war began). S&P 500 gaps above 6,691 resistance toward 6,819 and potentially higher. Gold rallies strongly as inflation fears ease ($5,001 and $5,227 targets). EUR/USD surges above 1.1631 toward 1.1751. GBP/USD breaks 1.3415 and targets 1.3500+. Bitcoin jumps above $71,325 toward $74,912. DXY retreats toward 98.55 support.
Trading Priorities: April 6 war deadline (the week’s single most important event). Powell Monday (sets early DXY tone). FOMC Minutes Wednesday (rate hike language = bearish equities and Gold, bullish USD). US CPI Friday (above 3% headline = rate hike fears intensify). WTI $102.28 critical new support (hold = bullish continuation, break = de-escalation trade confirmed). EUR/USD 1.1404 (2026 low, break below confirms bearish continuation to 1.1292). S&P 500 6,691 (first meaningful resistance). Gold $4,780 (20-day SMA). BTC $63,030 (make-or-break support).
Bottom line: Six weeks into the Iran war, the market has developed a well-worn reflexive pattern (rally on peace signals, sell on escalation threats) but the underlying thesis of every risk asset remains negative while WTI holds above $100. The one-week interruption of the five-week equity losing streak does not change the structural picture: the death cross is intact on the S&P 500, Gold is down 12% from its ATH, and Bitcoin is struggling below the 200-week EMA. The trades that have worked (long USD, long energy, long defense, short discretionary) remain valid until the Strait of Hormuz reopens with genuine, confirmed commitment from all parties. April 6 is the day that could change everything (or confirm that this war has at least two to three more weeks to run).

