FOMC Wednesday, BoE Thursday, BoJ Friday, Core PCE Thursday, Big Tech Earnings, Dual Chokepoint
Market Sentiment Overview
The week of July 27 to 31 is the most important scheduled macro week of the entire 21-week series. Three major central banks meet, the Fed’s preferred inflation gauge is published, US advance GDP is released, and the second phase of big tech earnings continues. Week 20 delivered a cascade of simultaneous shocks that overwhelmed markets. Iranian-aligned Houthi forces struck two Saudi Arabian oil tankers in the Red Sea on Thursday July 24, sending WTI surging 6% to a high of 92.50 dollars per barrel. The US carried out its 13th consecutive night of strikes against Iran. The regional confrontation widened as Iran and its allies struck US military assets in Kuwait, Bahrain, and Jordan. Trump was openly weighing whether to launch what sources described as a massive attack against Iran on a scale larger than anything seen during the conflict to date. That strike was widely expected to begin Saturday night but was called off at the last minute (sources attributed the pause to either Iran signaling willingness to resume talks, or the US needing time to replenish military stocks). The Trump administration simultaneously imposed sweeping new tariffs of 10 to 12.5% on goods from 60 of the US’s largest trading partners, covering nearly all US imports. The combination of war escalation and new tariffs pushed September Fed hike expectations to fully priced (80% probability) while the July meeting gained a 35% probability of a hike. The DXY closed the week near 101.50 (its highest level in 15 months). EUR/USD fell to its lowest close in over a year. GBP/USD collapsed from 1.3480 to close near 1.3320, erasing the entire four-week recovery in a single week. Gold hit two-week highs of 4,166 midweek but then fell 2% Thursday as the rate hike repricing overwhelmed the safe-haven bid, closing near 4,050. The ECB held at 2.40% in a meeting markets interpreted as a hawkish hold. Alphabet disappointed on heavy AI spending commitments. Tesla fell more than 10% on weaker-than-expected profitability. The Nasdaq touched a 2-month low. Pakistan announced it was exploring a diplomatic path toward renewed US-Iran negotiations under a framework initiated by China (a potential de-escalation signal that arrived late Friday and is the primary geopolitical wildcard for Week 21 opening). The conflict has now achieved something without modern precedent: the simultaneous disruption of both the Strait of Hormuz and the Strait of Bab al-Mandab, together handling approximately one-third of global seaborne oil trade. The 60-day MOU window expires approximately August 14 (less than three weeks away).
Currencies
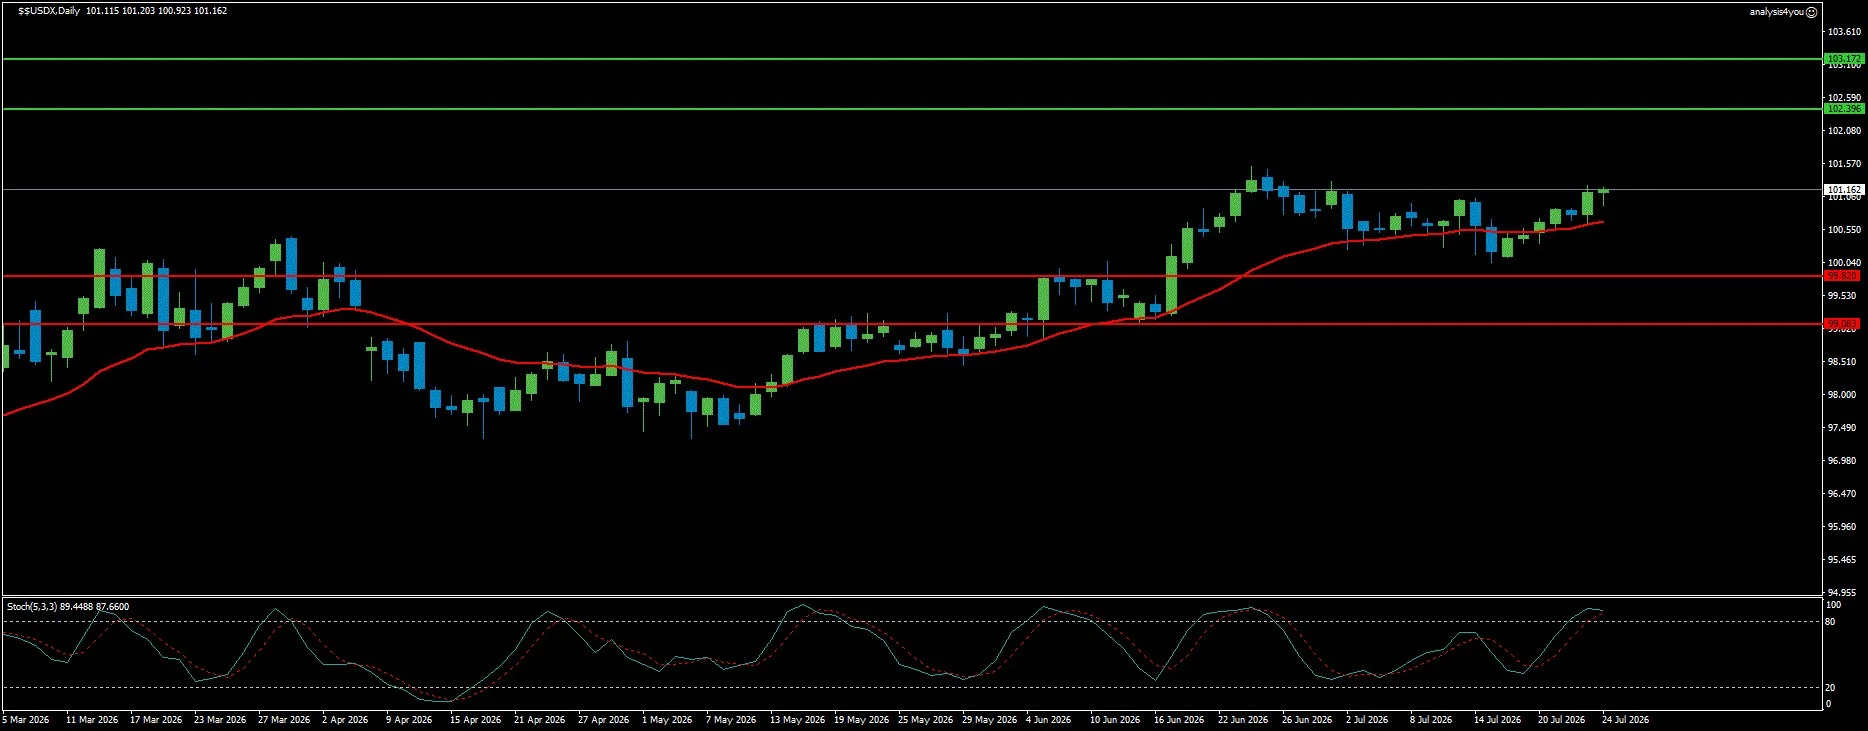
USD Index: 15-Month High, Above All Three MAs, FOMC Wednesday Is the Defining Catalyst (101.16)
Current Trend: Bullish
Resistance: 102.40 | 103.17
Support: 99.82 | 99.08
The Dollar Index closed the week at 101.16 (its highest level in 15 months), having fully reclaimed all three moving averages. The DXY chart is in its most constructively bullish configuration since the series began, with the MA curling upward steeply, price above the upper Bollinger Band, and RSI explicitly bullish.
The drivers are aligned and mutually reinforcing: the war escalation drives safe-haven demand, the tariff announcements add inflationary pressure that supports higher-for-longer rates, and September Fed hike expectations at 80% provide the fundamental anchor.
The 101.39 level is the key long-term resistance (a breakout above this threshold would be technically significant and is within reach from current levels at 101.16). Technically, the DXY is above all three MAs. The current bar is at the upper Bollinger Band and bullish. Stochastic is in a downtrend from overbought territory with a neutral signal (a natural momentum pause at elevated levels rather than a reversal). RSI is bullish.
For Week 21, the Dollar faces a week dominated by the FOMC decision Wednesday. A hawkish hold (that signals September is the baseline) would extend the rally toward 102.40 and potentially 103.17. Any actual July hike would send DXY toward 103.17 rapidly.
The Pakistan-China diplomacy signal introduces the only near-term bearish risk: if a de-escalation framework is announced and oil drops sharply, the war premium in the Dollar would partially unwind.
Core PCE Thursday is the second key catalyst (a soft print at 0.1% would create a brief Dollar pullback). Resistance at 102.40 / 103.17. Support at 99.82 / 99.08.
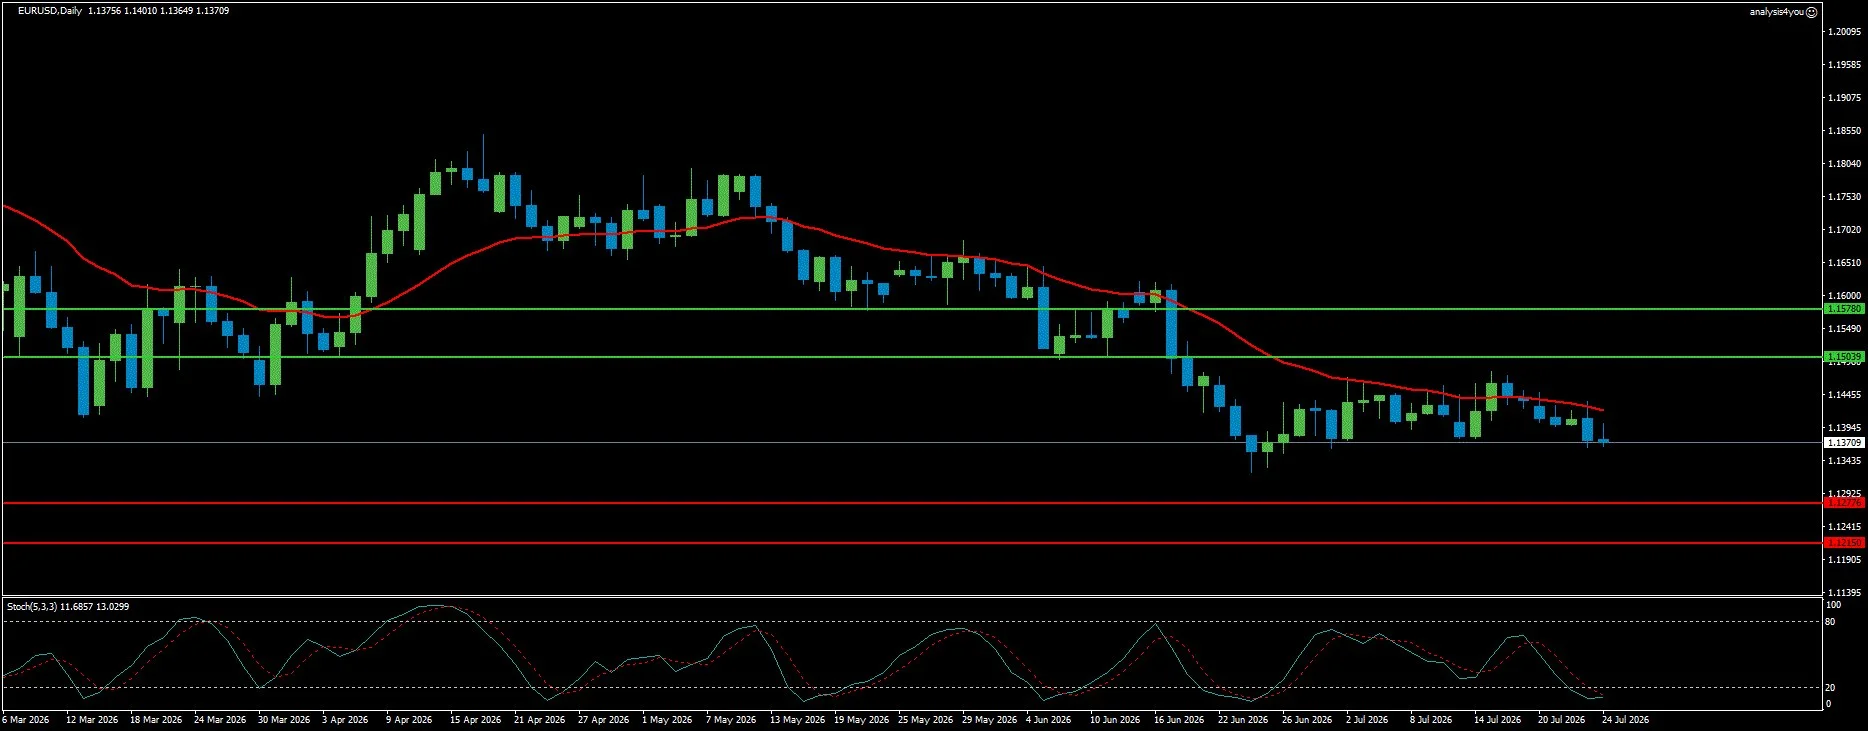
EUR/USD: Approaching Prior Multi-Year Low, Goldman 1.12 Target in Focus (1.1371)
Current Trend: Bearish
Resistance: 1.1504 | 1.1578
Support: 1.1278 | 1.1215
EUR/USD closed the week at 1.1371 (less than 50 pips above the June 25 multi-year low of 1.1324). The pair has been in a sustained downtrend since the Warsaw FOMC meeting in mid-June, accelerating through the tariff announcements and war escalation of Week 20.
The fundamental case is the clearest it has been all series: the Fed is heading toward at least one hike while the ECB has paused after a single hike; the US economy is growing at 2.3% while the Eurozone composite PMI was at 49.5; and the war’s energy burden falls disproportionately on European oil importers.
Goldman Sachs has cut its EUR/USD forecast to 1.12 in both six and twelve months (now a serious near-term target rather than a distant projection). The chart is unambiguously bearish. EUR/USD is below all three MAs, with the MA in a steep downward slope.
The current bar is at the lower Bollinger Band and bearish. Stochastic is in an uptrend from deeply oversold territory with a neutral signal (a potential technical bounce from the lows). RSI is bearish.
If the FOMC is hawkish Wednesday, EUR/USD breaks below 1.1324 toward 1.1278 and 1.1215. If PCE Thursday is soft, a relief bounce toward 1.1504 is possible but unlikely to be sustained.
Eurozone preliminary GDP and flash CPI on Friday provide a domestic catalyst. Resistance at 1.1504 / 1.1578. Support at 1.1278 / 1.1215.
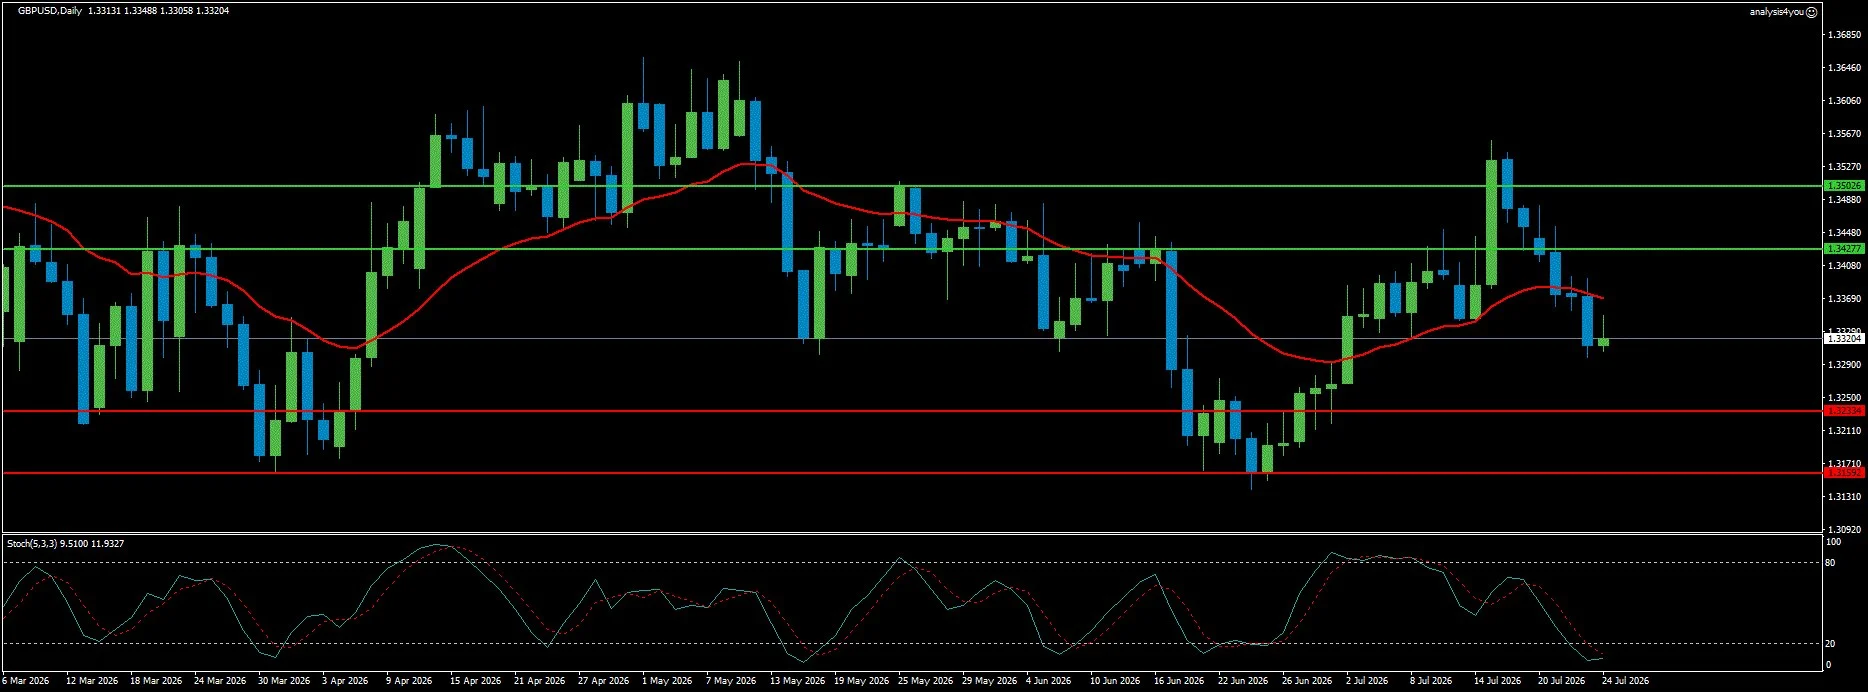
GBP/USD: Worst Week of Series, Erased Four-Week Recovery, BoE Thursday Is Pivot (1.3320)
Current Trend: Bearish
Resistance: 1.3428 | 1.3503
Support: 1.3233 | 1.3159
GBP/USD suffered one of its worst weeks of the series, falling from the 1.3480 high to close at 1.3320 (erasing the entire four-week recovery rally in a single week). The pair has now broken back below all three moving averages, reversing the bullish structural position it held just two weeks ago.
The drivers of the collapse were the oil spike (which triggered a broad Dollar safe-haven rally) and the disappointment from Alphabet and Tesla earnings (which weighed on risk sentiment broadly, hurting Sterling’s risk-sensitive characteristics).
The BoE Thursday meeting now becomes a make-or-break event. The market enters the week pricing a 75% probability of a September BoE hike. A hawkish BoE statement (more dissenters than June’s 7-2 vote, or language that explicitly signals September) is the only near-term catalyst capable of reversing the breakdown.
The chart shows GBP/USD below all three MAs with the MA now turning lower. The current bar is at the middle Bollinger Band and bullish (a partial recovery attempt from the week’s lows). Stochastic is in an uptrend from oversold territory with a neutral signal. RSI is neutral.
If the BoE Thursday delivers a hawkish vote split or explicit September language, GBP/USD recovers toward 1.3428. A neutral or dovish hold (the same 7-2 vote as June) confirms the bearish breakdown and exposes 1.3233 and 1.3159.
Resistance at 1.3428 / 1.3503. Support at 1.3233 / 1.3159.
Stocks
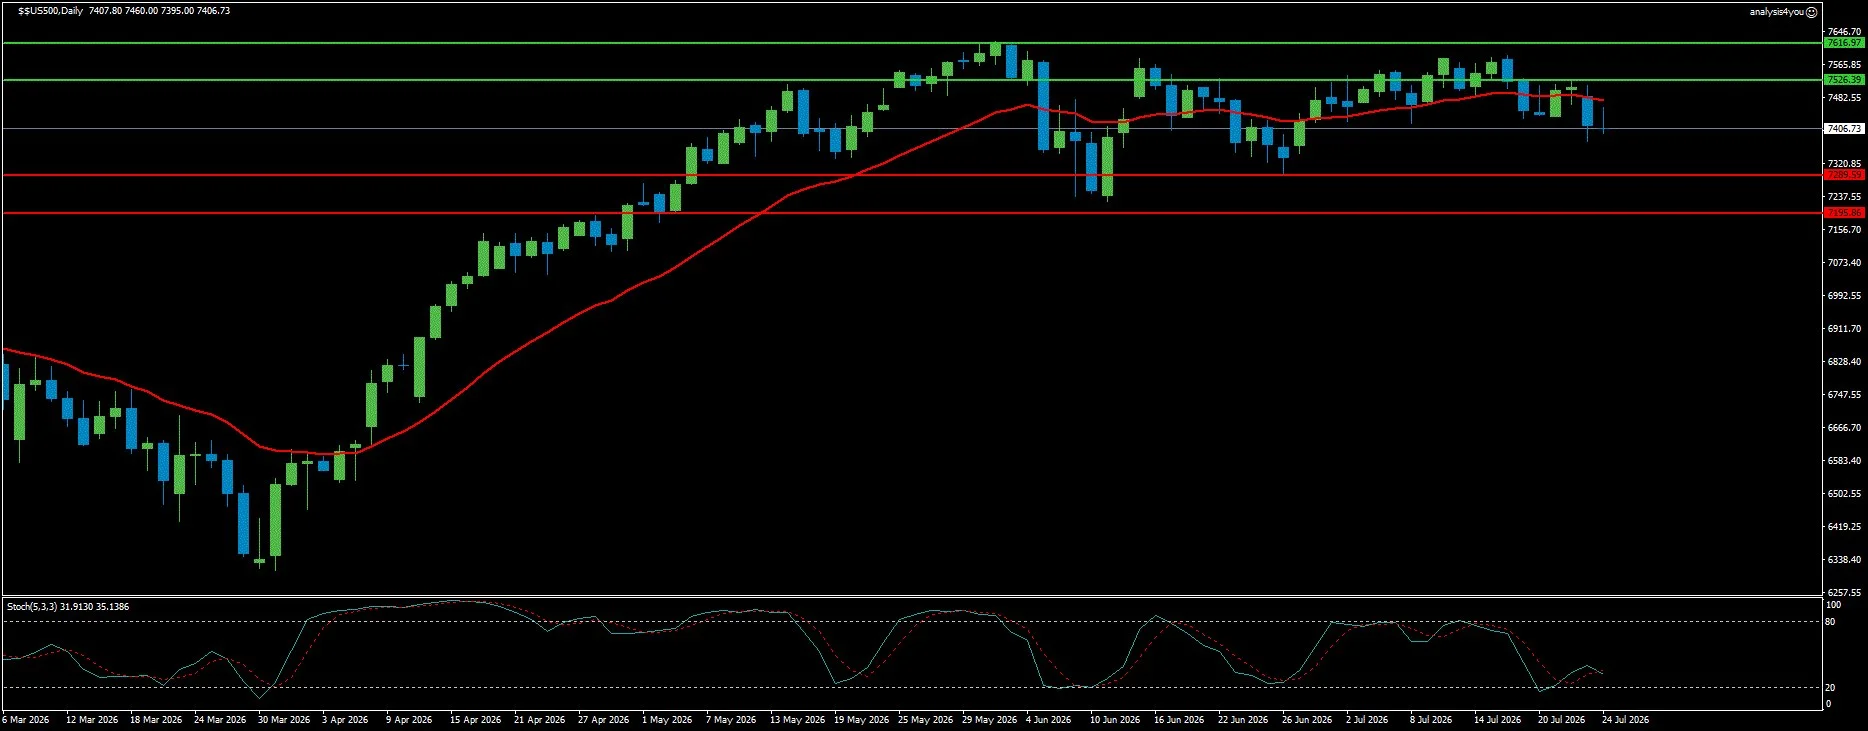
S&P 500: Below MA20 and MA50, Big Tech Earnings Are the Decisive Catalyst (7,407)
Current Trend: Cautious/Bearish
Resistance: 7,526 | 7,617
Support: 7,290 | 7,196
The S&P 500 closed at 7,406 (now below both its MA20 and MA50, with only the MA200 providing structural support below). This is a meaningful two-level breakdown from the near-record-high position of three weeks ago. The Nasdaq 100 has fared worse, touching a two-month low on Friday.
The drivers of the equity weakness are clear: Alphabet disappointed on high AI spending with muted revenue returns relative to the investment, Tesla fell more than 10% on profitability miss, and the oil spike from the Houthi Red Sea strikes revived stagflation fears that compress valuation multiples.
The chart shows the S&P 500 below MA20 and MA50 but still above MA200. The current bar is at the lower Bollinger Band and bearish. Stochastic is in a downtrend with a neutral signal. RSI is bearish (for the second consecutive week, suggesting the selling pressure has conviction).
Week 21 could be the decisive turning point in either direction. The FOMC decision Wednesday is the macro anchor. The mega-cap tech earnings are the sector-specific catalyst: Microsoft, Meta, Amazon, and Apple all report this week.
If these four collectively deliver strong results with reassuring AI spending commentary showing improving ROI, the Nasdaq could stage a sharp recovery and pull the broader index back above 7,526. If any of the four replicates the Alphabet pattern, the breakdown deepens toward 7,196.
Resistance at 7,526 / 7,617. Support at 7,290 / 7,196.
Commodities
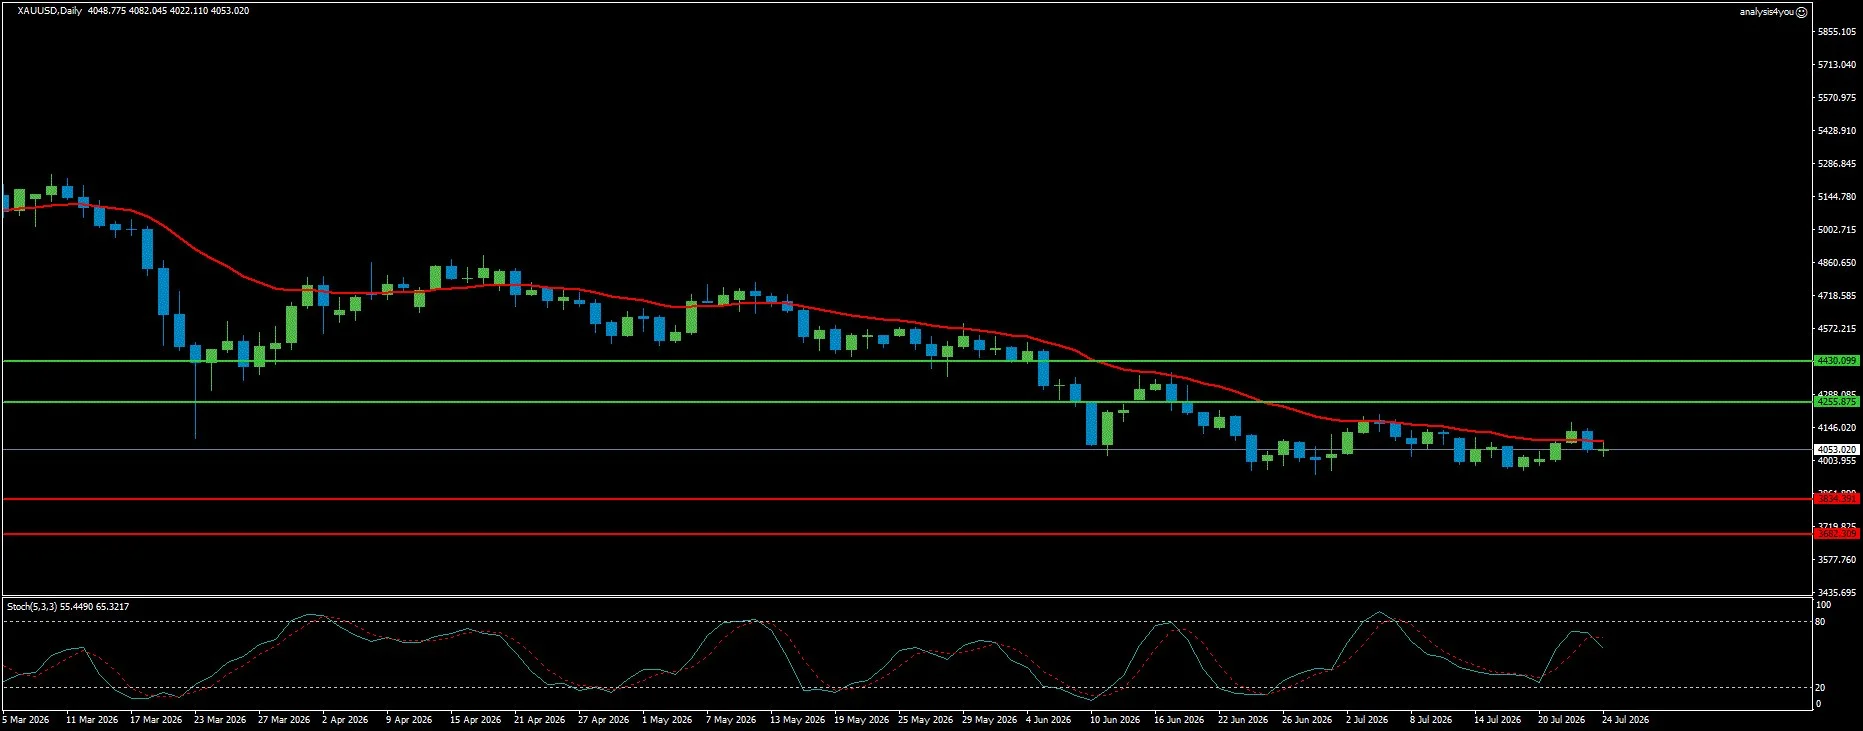
Gold: Bear Cross Confirmed, $4,000 Floor Holding, FOMC-PCE Sequence Determines Direction (4,053)
Current Trend: Bearish
Resistance: 4,256 | 4,430
Support: 3,834 | 3,682
Gold remains in a prolonged and painful bear market from the January highs above 5,300 (a decline of more than 23% in six months). The metal briefly surged toward 4,166 two-week high midweek on the safe-haven bid from the Red Sea disruption, then fell 2% Thursday as the rate hike repricing overwhelmed the geopolitical bid.
This is the defining pattern of Gold in this conflict: war escalation provides a temporary safe-haven bid, but the simultaneous Dollar strength and rising rate expectations from war-driven oil inflation cancel and exceed the Gold bid. TD Securities has explicitly stated that the macro backdrop is not supportive of building long gold positions in the near term.
The chart confirms the bear cross on the daily chart (the 20-day SMA has crossed below the 50-day SMA for the first time since the downtrend began, a technically significant bearish confirmation). Gold is below all three MAs with the MA in a steep and sustained downward slope.
The current bar is at the middle Bollinger Band and bullish (minor recovery from the 4,000 floor). Stochastic is in a downtrend and overbought with a neutral signal. RSI is neutral.
The Asian buying pattern documented by the World Gold Council (Gold rises in Asian sessions and falls in US sessions) provides the structural demand that keeps 4,000 defended.
For Week 21, a hawkish hold at the FOMC would press Gold back toward 4,000 and potentially below. A July hike would push Gold toward 3,834. Conversely, a soft PCE Thursday at 0.1% monthly would allow Gold to recover toward 4,256.
Resistance at 4,256 / 4,430. Support at 3,834 / 3,682.
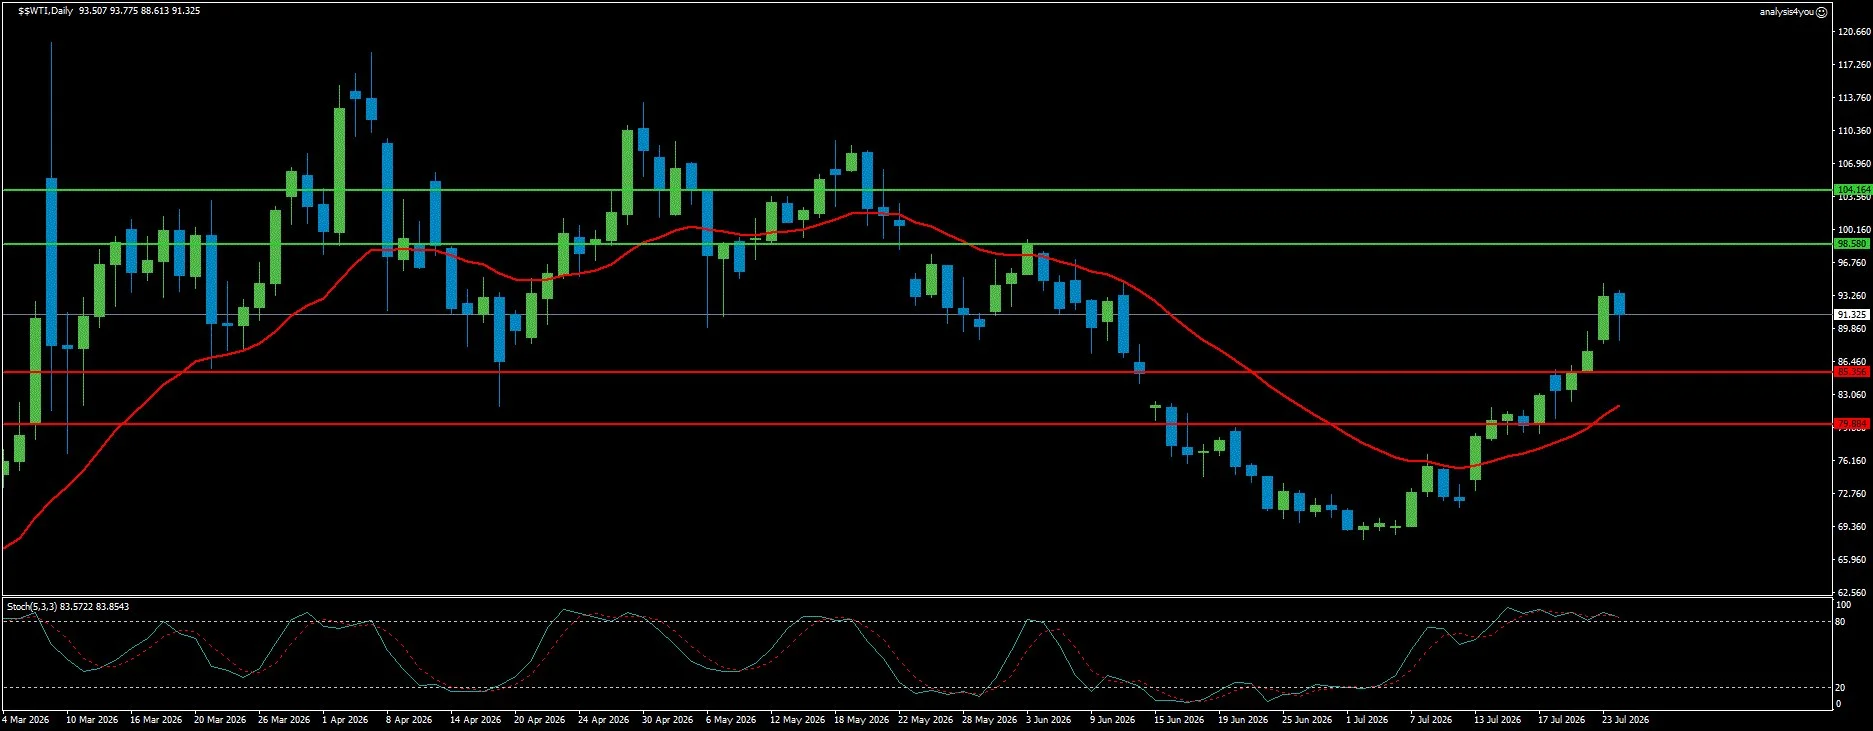
WTI Crude Oil: Dual Chokepoint Premium, Up 30% from July Low, Diplomacy Is Downside Risk (91.33)
Current Trend: Bullish
Resistance: 98.58 | 104.16
Support: 85.36 | 79.88
WTI Crude Oil closed the week at 91.33 (up approximately 9% for the week and up more than 30% from its early July low near 69 dollars). The Houthi Red Sea strikes on Thursday (which hit two Saudi oil tankers) were the trigger for the 6% single-session spike.
The dual chokepoint disruption (Hormuz and Bab al-Mandab) represents an unprecedented simultaneous supply shock affecting approximately one-third of global seaborne oil trade. The chart shows WTI above all three moving averages with the current bar at the upper Bollinger Band, RSI neutral, and stochastic turning down from overbought after the spike.
The 98.58 resistance is the next major target (a 50% Fibonacci retracement of the entire war-to-MOU-peace collapse from 115 to 69). The 100-day SMA near 88.31 acts as immediate support. The MACD remains positive.
The market structure is one of sustained premium from supply disruption rather than speculative positioning (which means the price will only come down when supply actually normalizes). The week’s primary wildcard is the Pakistan-China diplomatic initiative.
If Iran agrees to a new ceasefire or de-escalation framework, WTI would sell off sharply (potentially back toward 85, mirroring the June 15 MOU selloff of 10% in a week). If no framework emerges by midweek and Trump orders the massive strike that was paused on Saturday, WTI would spike toward 98.58 and then the 100 level.
Resistance at 98.58 / 104.16. Support at 85.36 / 79.88.
Crypto
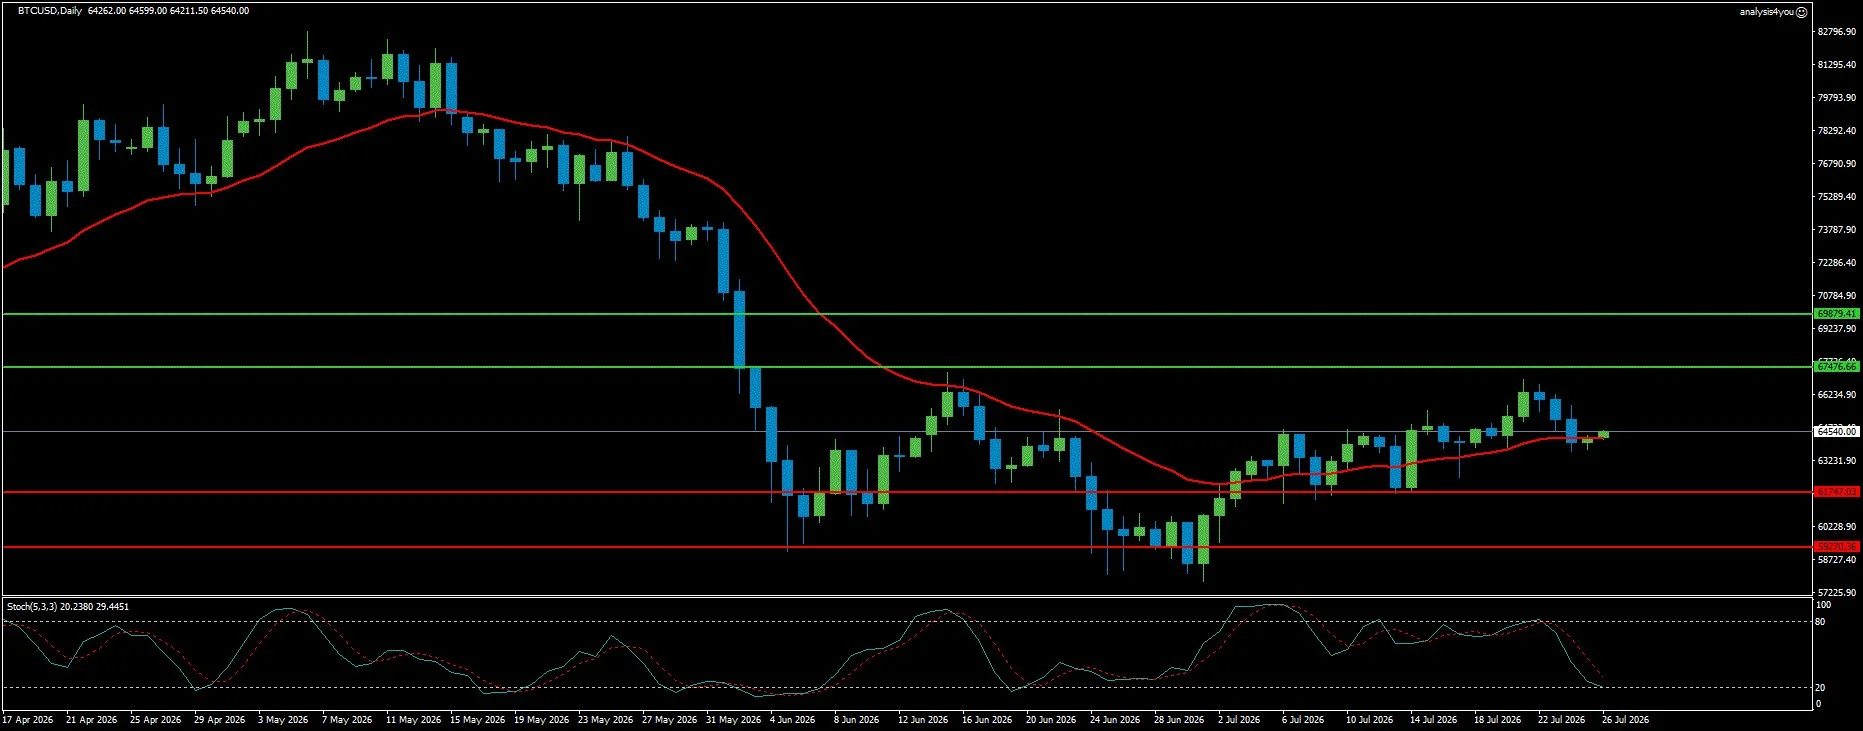
Bitcoin: Fourth Consecutive Weekly Gain, Third Positive ETF Inflow Week, CLARITY Act Window (64,540)
Current Trend: Neutral
Resistance: 67,476 | 69,879
Support: 61,747 | 59,270
Bitcoin closed the week at 64,540, delivering a fourth consecutive week of gains and the third consecutive week of positive ETF inflows at 273.87 million dollars through Thursday. The MACD flipped to a bullish crossover on the weekly chart (a technical confirmation that the downward momentum from the May-July correction is moderating).
The RSI on the weekly chart is trending toward the neutral 50 level from the oversold zone. Bitcoin is showing resilience against a macro backdrop that remains hostile. The CLARITY Act near-final draft with ethics provisions released last week is the most important regulatory development of the year (its Senate passage window closes with the August recess).
The chart shows Bitcoin above its MA20 but still below MA50 and MA200. The current bar is at the middle Bollinger Band and bullish. Stochastic is in a downtrend and overbought with a bearish signal (the recovery is losing momentum at resistance). RSI is neutral.
The 200-week SMA at approximately 63,330 continues to hold as the critical structural support. For Week 21, Bitcoin has two primary catalysts. First, the CLARITY Act Senate floor window closes with the August recess (any vote or advancement this week would be the most significant crypto regulatory event of 2026 and could drive BTC toward 67,476 and beyond).
Second, the big tech earnings (particularly Meta and Microsoft) will influence risk sentiment broadly. The most important single indicator remains whether ETF inflows continue for a fourth consecutive week (sustained institutional re-engagement is the only force capable of driving a sustained recovery toward 70,000 and above).
Resistance at 67,476 / 69,879. Support at 61,747 / 59,270.
Key Events (July 27-31, 2026)
Monday, July 27: Markets open processing the weekend Pakistan-China diplomatic initiative. WTI direction Monday is the leading indicator for the week. Any confirmation or denial of a new ceasefire framework reshapes all positions immediately.
Tuesday, July 28: US Consumer Confidence. JOLTS Job Openings. Final positioning ahead of the FOMC decision Wednesday.
Wednesday, July 29: FOMC Rate Decision (THE WEEK’S DEFINING MARKET EVENT). Warsh chairs the meeting. Rate expected unchanged at 3.50% to 3.75% but a 35% probability of a July hike. The meeting carries no updated dot plot, making Warsh’s press conference the only forward guidance market participants will receive. Microsoft and Meta report Q2 earnings after the US close.
Thursday, July 30: BoE Rate Decision (expected 7-2 hold at 3.75% with hawkish statement; 75% probability of September BoE hike). US Advance Q2 GDP (consensus 2.3% annualized). Core PCE for June (expected 0.1% monthly, the smallest gain of the year). US Initial Jobless Claims. German CPI. Amazon reports Q2 earnings.
Friday, July 31: BoJ Rate Decision (expected hold at 1.00%; quarterly Outlook Report watched for USD/JPY implications). Eurozone Flash CPI (expected to rise to 2.9% from 2.8%). Apple Q2 earnings. Section 301 tariff follow-through. CLARITY Act Senate window final days.
Week Ahead Outlook
Week 21 is the most consequential scheduled macro week of the entire 21-week series. The Wednesday-Thursday-Friday sequence of FOMC, BoE, and BoJ decisions create a unique trading environment where each announcement resets the context for the next.
Base Case (approximately 40%): Hawkish Fed hold Wednesday confirms September as the base case, combined with a soft core PCE at 0.1% that creates a brief but limited Dollar pullback. The DXY consolidates between 100.40 and 102.40. EUR/USD attempts a bounce from 1.1324 but remains below 1.1504. GBP/USD holds near 1.3233 to 1.3428 depending on BoE tone Thursday. Gold oscillates between 4,000 and 4,100. WTI consolidates between 87 and 95 as diplomacy news is absorbed. The S&P 500 stabilizes near 7,290 to 7,526 with the outcome depending on Microsoft and Meta earnings.
Bull Case: Diplomacy Breaks the War Premium (approximately 25%): The Pakistan-China diplomatic initiative produces a genuine de-escalation framework. WTI falls toward 82 to 85. Inflation expectations drop sharply. September hike bets are pushed back. EUR/USD recovers toward 1.1504 to 1.1578. GBP/USD pushes back above 1.3428. Gold surges toward 4,256 as simultaneous Dollar weakness and inflation relief converge bullishly. The S&P 500 breaks back above 7,526. Bitcoin rallies toward 67,476.
Bear Case: FOMC Hikes in July (approximately 35%): The FOMC delivers a 25bp rate hike on Wednesday. The Dollar rallies toward 103.17 and potentially beyond. EUR/USD breaks decisively below 1.1278 toward the Goldman Sachs 1.12 target. GBP/USD falls toward 1.3159. Gold is crushed toward 3,834. The S&P 500 sells off sharply toward 7,196. Bitcoin follows equities lower toward 61,747.
Bottom line: Twenty-one weeks into the Iran war, the market faces the highest-stakes single week of the entire conflict. The FOMC may or may not hike rates for the first time since the war began. Three central banks meet in three consecutive days. The dual chokepoint disruption of Hormuz and the Red Sea represents an unprecedented simultaneous supply shock. And Pakistan’s China-facilitated diplomatic initiative may be the last realistic opportunity to prevent the conflict from spiraling beyond the MOU framework before the August 14 expiry. The big tech earnings this week will answer whether the AI bull market can survive the macro headwinds. Whatever happens between Wednesday and Friday will set the market’s trajectory for the remainder of 2026.


