ECB Holds Thursday, Big Tech Earnings Wed, Burnham Takes Off
Market Sentiment Overview
The week of July 20 to 24 opens after Week 19 was defined by two competing forces that ultimately cancelled each other out for most instruments. The June CPI report delivered the largest monthly price decline since April 2020, with headline inflation falling 0.4% month-on-month and the annual rate dropping to 3.5% from 4.2% (well below the 3.8% consensus). Core CPI was flat on the month and fell to 2.6% annually from 2.9%. The energy component alone fell 5.7% as the Hormuz reopening in June translated directly into lower gasoline prices. This was the clearest validation yet of the peace dividend thesis. The dovish CPI reaction (July hike probability fell to 10%, September to 50%) was immediately contested by the war escalating for a sixth consecutive day on Thursday. The US conducted airstrikes against Iranian civilian infrastructure including power facilities and a train station in southern Iran. Iran threatened to activate Yemen’s Houthi militia to close the Red Sea shipping route (a threat that would add an entirely new dimension to the global supply disruption, as the Red Sea handles approximately 12% of global trade). WTI crossed back above 80 dollars by Friday (up 13% in July to date). The net result: the Dollar ended the week slightly in the red near 100.80 as the dovish CPI outweighed the safe-haven war bid. Gold suffered a second consecutive weekly loss, closing near 4,018, unable to benefit from either the soft CPI or the escalation. EUR/USD remained trapped below 1.1450. GBP/USD posted a fourth consecutive weekly gain, closing near 1.3451. The S&P 500 sold off Thursday as profit-taking hit after the AI-driven rally, closing at 7,451 (below its MA20 for the first time since late April). The conflict has now entered its most dangerous phase since the initial strikes of February 28. Six consecutive days of US-Iran military exchanges represent a qualitative shift. The MOU signed June 15 is effectively dead. The 60-day negotiation window expires approximately August 14 (less than four weeks from now). There is no functioning diplomatic framework and no scheduled negotiations. The most significant variable for Week 20 is whether the Red Sea threat materializes. The FOMC blackout period begins Monday ahead of the July 28 to 29 meeting, meaning Fed speakers go silent for the rest of this week and all of next week. Week 20 is the most important domestic UK calendar week in months. Andy Burnham takes office as UK Prime Minister Monday and delivers his first speech and cabinet announcement.
Currencies
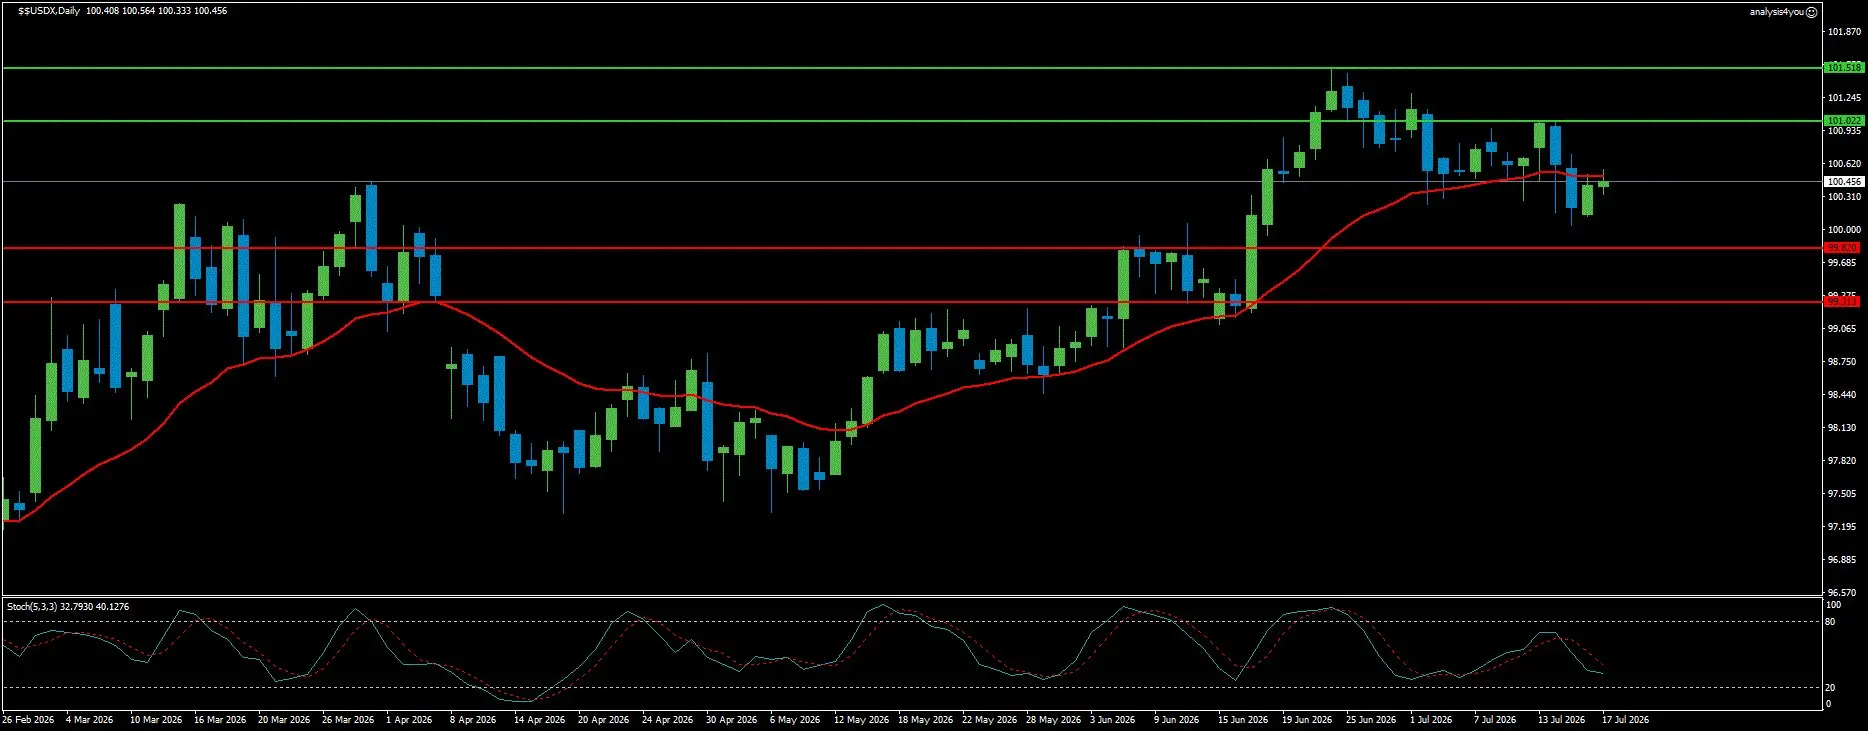
USD Index: Broken Below MA20, CPI Peace Dividend vs War Safe-Haven in Balance (100.46)
Current Trend: Bearish Short-Term
Resistance: 101.02 | 101.52
Support: 99.82 | 99.31
The Dollar Index has broken below its MA20 for the first time since the mid-June hawkish repricing rally began, closing the week at 100.46. The breakdown was driven by the dramatically soft June CPI print (the largest monthly decline since COVID lockdowns), which pushed September hike expectations to 50% from over 70%. The Dollar’s decline was partially cushioned by safe-haven demand from the Iran re-escalation. Speculative positioning according to CFTC data remained constructive at approximately 13,000 net long contracts (suggesting the broader market is not yet abandoning its Dollar bullish thesis). Wells Fargo’s base case of no hike this year but acknowledging the bar is lower than a few months ago is the clearest articulation of the Dollar’s current dilemma: fundamentally supported but with the near-term catalyst in doubt.
The MA20 has now turned from support to resistance (a meaningful shift). The current bar is at the lower Bollinger Band and bullish (suggesting a short-term bounce attempt). Stochastic is in a downtrend with a bearish signal despite being in overbought territory. RSI is neutral.
For Week 20, the Dollar enters FOMC blackout with limited Fed communication support. The primary catalysts are geopolitical (Hormuz developments and the Red Sea threat) and economic through the Flash PMIs Friday. Any Houthi activation in the Red Sea would provide an acute safe-haven Dollar bid. The ECB decision Thursday could temporarily affect the Dollar through the EUR/USD channel. The Section 301 tariff deadline Friday introduces another potential catalyst. Resistance at 101.02 / 101.52. Support at 99.82 / 99.31.
EUR/USD: Five Consecutive Weeks Trapped in Range, ECB Thursday Is the Binary Trigger (1.1437)
Current Trend: Neutral
Resistance: 1.1504 | 1.1561
Support: 1.1376 | 1.1322
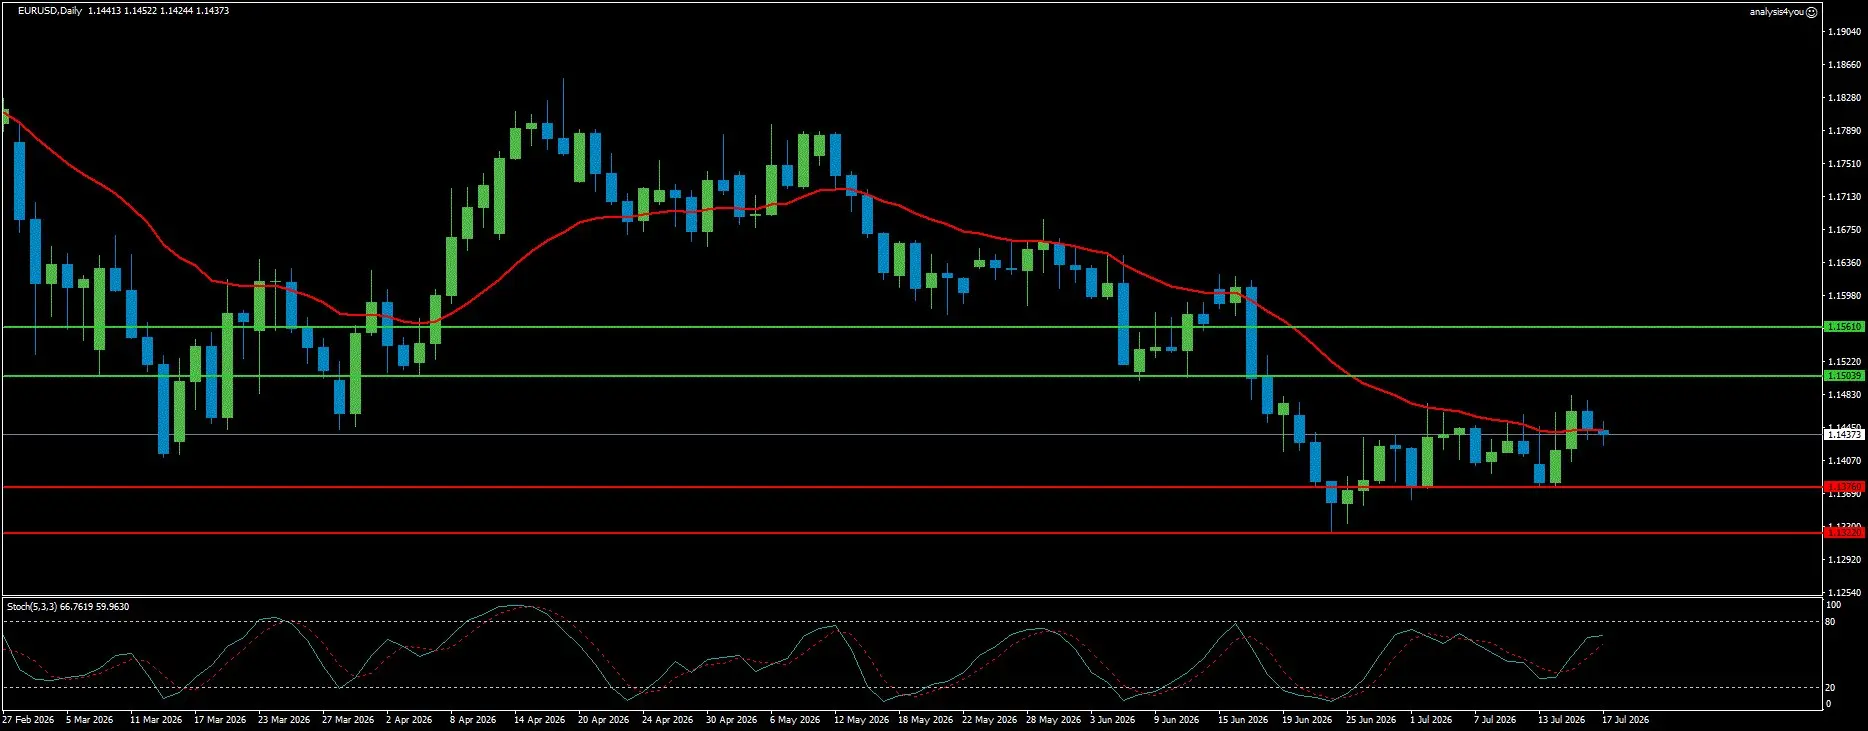
EUR/USD has now spent five consecutive weeks trapped between 1.1324 and 1.1504, unable to generate sustained directional momentum in either direction. The soft US CPI provided a brief tailwind but was immediately offset by the war escalation safe-haven Dollar bid. The ECB meeting Thursday July 23 is the most important scheduled catalyst the Euro has had since the June rate hike. While the hold itself is expected and already priced, Lagarde’s press conference is the variable. If Lagarde delivers a hawkish press conference that confirms September as more likely than not, EUR/USD could break above 1.1504 toward 1.1530 to 1.1561 for the first time in weeks. Goldman Sachs has cut its EUR/USD forecast to 1.12 in both six and twelve months, reflecting the structural bearish case (the ECB rate advantage over the Fed has shrunk, Eurozone growth is sluggish, and the Iran war’s energy burden falls disproportionately on European importers).
The chart shows EUR/USD still below all three MAs. The current bar is at the middle Bollinger Band and bearish. Stochastic is in an uptrend with a bullish signal but in overbought territory. RSI is neutral. The chart confirms five weeks of compression (a coiling pattern that typically precedes a directional break).
A hawkish Lagarde breaks EUR/USD above 1.1504 toward 1.1561. A neutral to dovish ECB pushes EUR/USD back toward 1.1376 and the 1.1322 floor. Resistance at 1.1504 / 1.1561. Support at 1.1376 / 1.1322.
GBP/USD: Fourth Consecutive Weekly Gain, Above All Three MAs, UK Data Week (1.3455)
Current Trend: Bullish
Resistance: 1.3536 | 1.3632
Support: 1.3379 | 1.3284
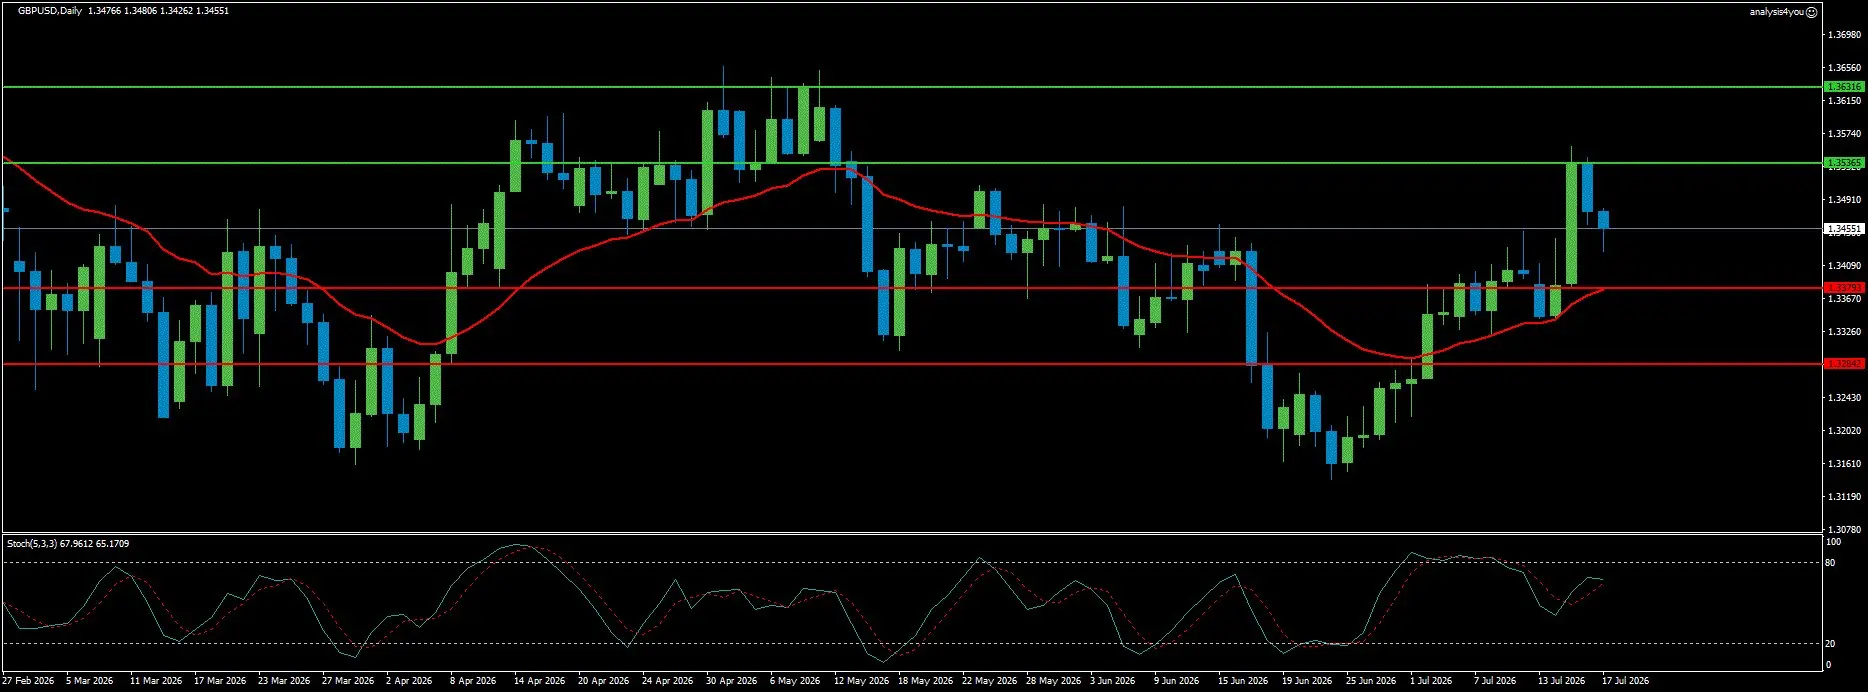
GBP/USD delivered a fourth consecutive weekly gain, closing near 1.3451 to 1.3455 and remaining above all three moving averages (the clearest bullish structure of any currency pair in the portfolio). Sterling’s outperformance over this period is driven by three aligned factors: the BoE-Fed rate differential moving in Sterling’s favor as Fed hike expectations get pushed back, the Burnham government’s commitment to fiscal prudence reducing the political risk premium, and UK-specific data surprises. Money markets now price 61% probability of a Fed hike at October’s meeting versus 70% for the BoE by year-end (a meaningful differential that underpins the bullish GBP/USD structure).
The chart shows GBP/USD above all three MAs with the MA20 rising steeply. The current bar is at the upper Bollinger Band and bearish (a natural overbought pause). Stochastic is in a downtrend and overbought with a neutral signal. RSI is neutral. The 1.3536 resistance is the next target (a level not visited since early May). The 1.3379 support is the MA20 floor.
Week 20 is the most important domestic UK calendar week in months. Andy Burnham takes office Monday (confirmation of Mahmood as Chancellor is expected to be received positively by gilt markets). Tuesday’s employment data, Wednesday’s CPI, and Friday’s retail sales and Flash PMI will collectively determine whether Sterling’s bullish momentum extends or consolidates. A hot UK CPI on Wednesday reinforces the BoE hike case and supports a Sterling push toward 1.3536. Any fiscal surprise from Burnham would generate immediate Sterling volatility. Resistance at 1.3536 / 1.3632. Support at 1.3379 / 1.3284.
Stocks
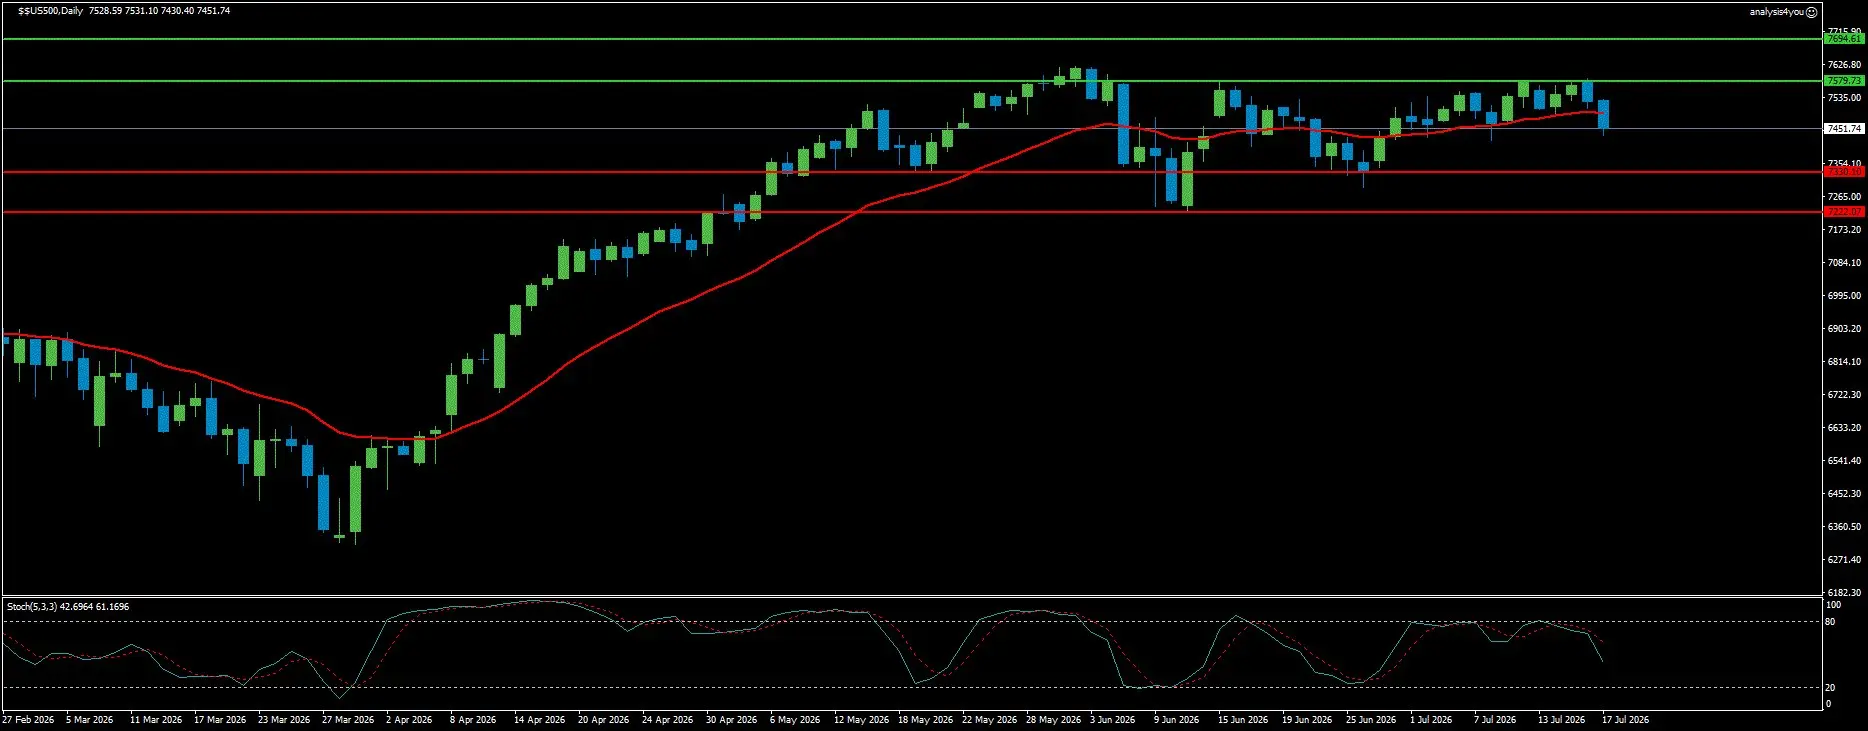
S&P 500: Broken Below MA20 for First Time Since April, Big Tech Earnings Are Pivot (7,452)
Current Trend: Cautious
Resistance: 7,580 | 7,695
Support: 7,330 | 7,222
The S&P 500 closed the week at 7,451 (below its MA20 for the first time since the index’s strong run began in late April). The drivers of the pullback are threefold: the war re-escalation and oil price spike reignited stagflation fears, profit-taking in mega-cap tech stocks hit after the Meta and SK Hynix-driven rally, and market nervousness around AI valuations returned as Netflix’s strong Q2 results were offset by disappointing forward guidance. The Nasdaq 100 bore the brunt of the selling.
The chart shows the S&P 500 breaking below its MA20 while still holding above MA50 and MA200. The current bar is at the middle Bollinger Band and bearish. Stochastic is in a downtrend with a bearish signal. RSI is bearish (the only instrument on the panel where RSI is explicitly bearish, suggesting selling pressure has more conviction). Resistance at 7,580 is where the MA20 now sits as a ceiling. The 7,330 support is a meaningful floor.
Week 20 is the pivotal week for the Q2 earnings season. Alphabet and Tesla report Wednesday after the US close (the market needs both to deliver strong AI-related commentary to restore confidence in the tech premium). Intel reports Thursday. If these results disappoint, the Nasdaq selloff could deepen and drag the broader index toward the 7,330 support. Conversely, strong results with bullish AI guidance would likely restore the uptrend and push the index back above 7,580. Resistance at 7,580 / 7,695. Support at 7,330 / 7,222.
Commodities
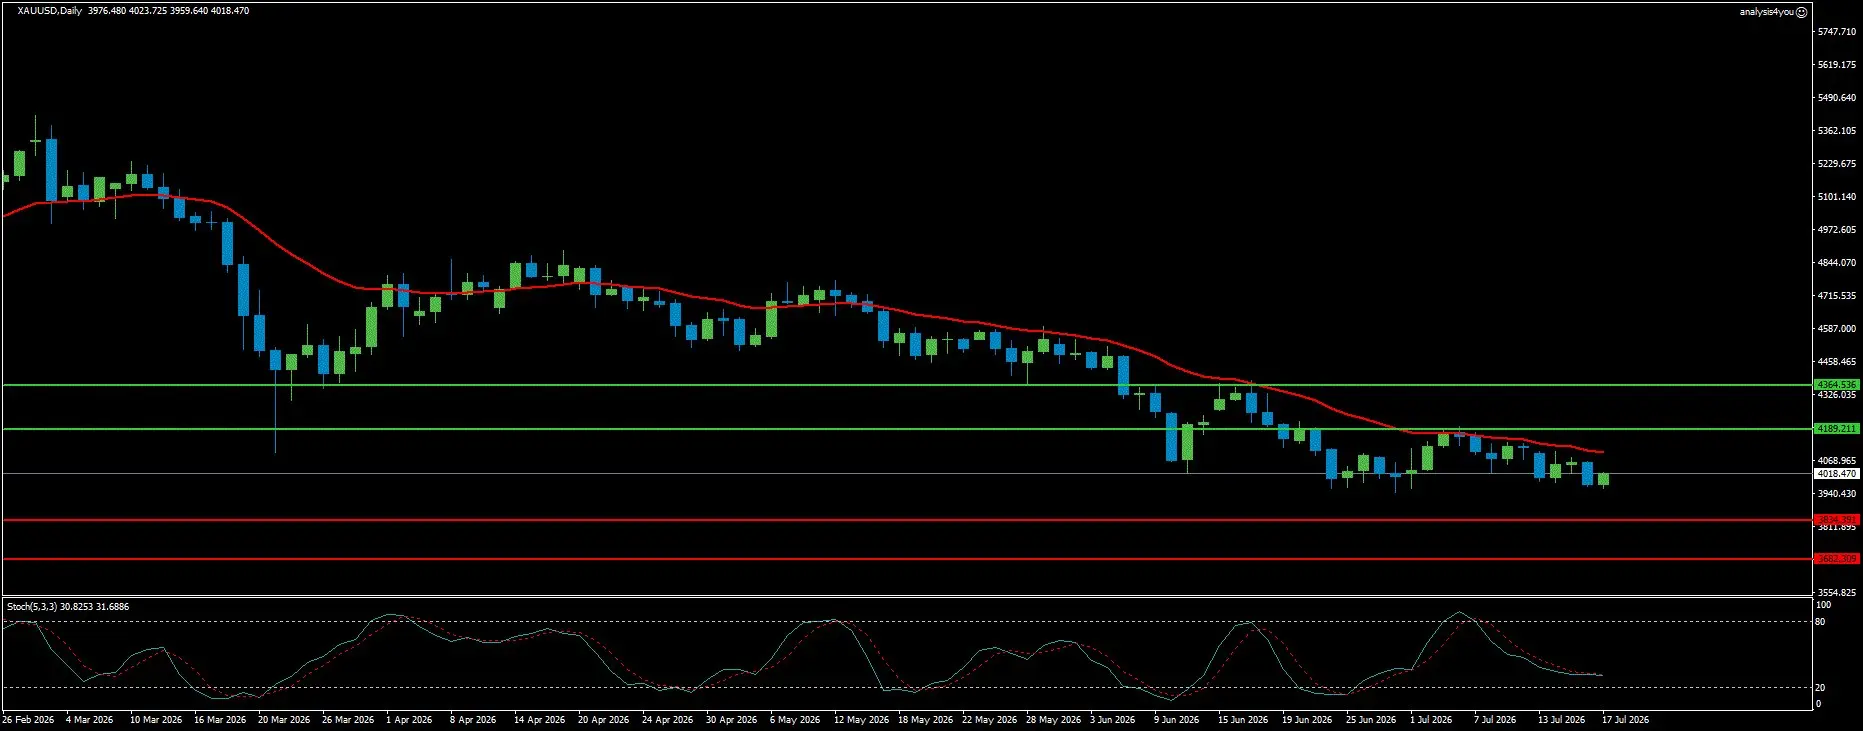
Gold: Testing $4,000 Psychological Floor, War Premium Absent, Bear Market Intact (4,018)
Current Trend: Bearish
Resistance: 4,189 | 4,365
Support: 3,834 | 3,682
Gold closed the week at 4,018 (dangerously close to the 4,000 level that has been the floor of the entire correction from the January highs above 5,300). The metal has now lost value for two consecutive weeks despite what should have been a goldilocks environment: a dramatic CPI decline reducing rate pressure, and a war re-escalation that should theoretically drive safe-haven demand. The paradox is the same one that has characterized this conflict throughout: when the war drives oil prices higher, markets price renewed inflation, the Dollar strengthens on safe-haven and rate-hawkishness grounds simultaneously, and Gold is unable to sustain a safe-haven bid.
The chart is a striking document of the bear market. Gold is below all three moving averages in a steep, sustained downtrend from the January record high near 5,300. The current bar is at the middle Bollinger Band and bullish (a minor bounce from the July lows near 3,950 to 3,960). Stochastic is in a downtrend with a bearish signal despite being in overbought territory. RSI is neutral. The 4,189 resistance is the immediate ceiling (where the 20-day SMA and descending trend line converge). A sustained close above 4,189 would be the first technical signal of a genuine recovery attempt.
For Week 20, Gold faces three competing influences. The ECB meeting Thursday affects the Dollar direction indirectly. The Flash PMIs Friday will influence rate expectations. Most critically, the war escalation trajectory (specifically whether the Red Sea threat materializes) is the wildcard. If Houthi forces begin attacking Red Sea shipping, Gold could finally re-emerge as a safe-haven bid alongside the Dollar. The World Gold Council’s observation that Asian buyers have been responsible for all of Gold’s year-to-date gains provides the structural floor (those buyers typically intensify on dips toward 4,000). Resistance at 4,189 / 4,365. Support at 3,834 / 3,682.
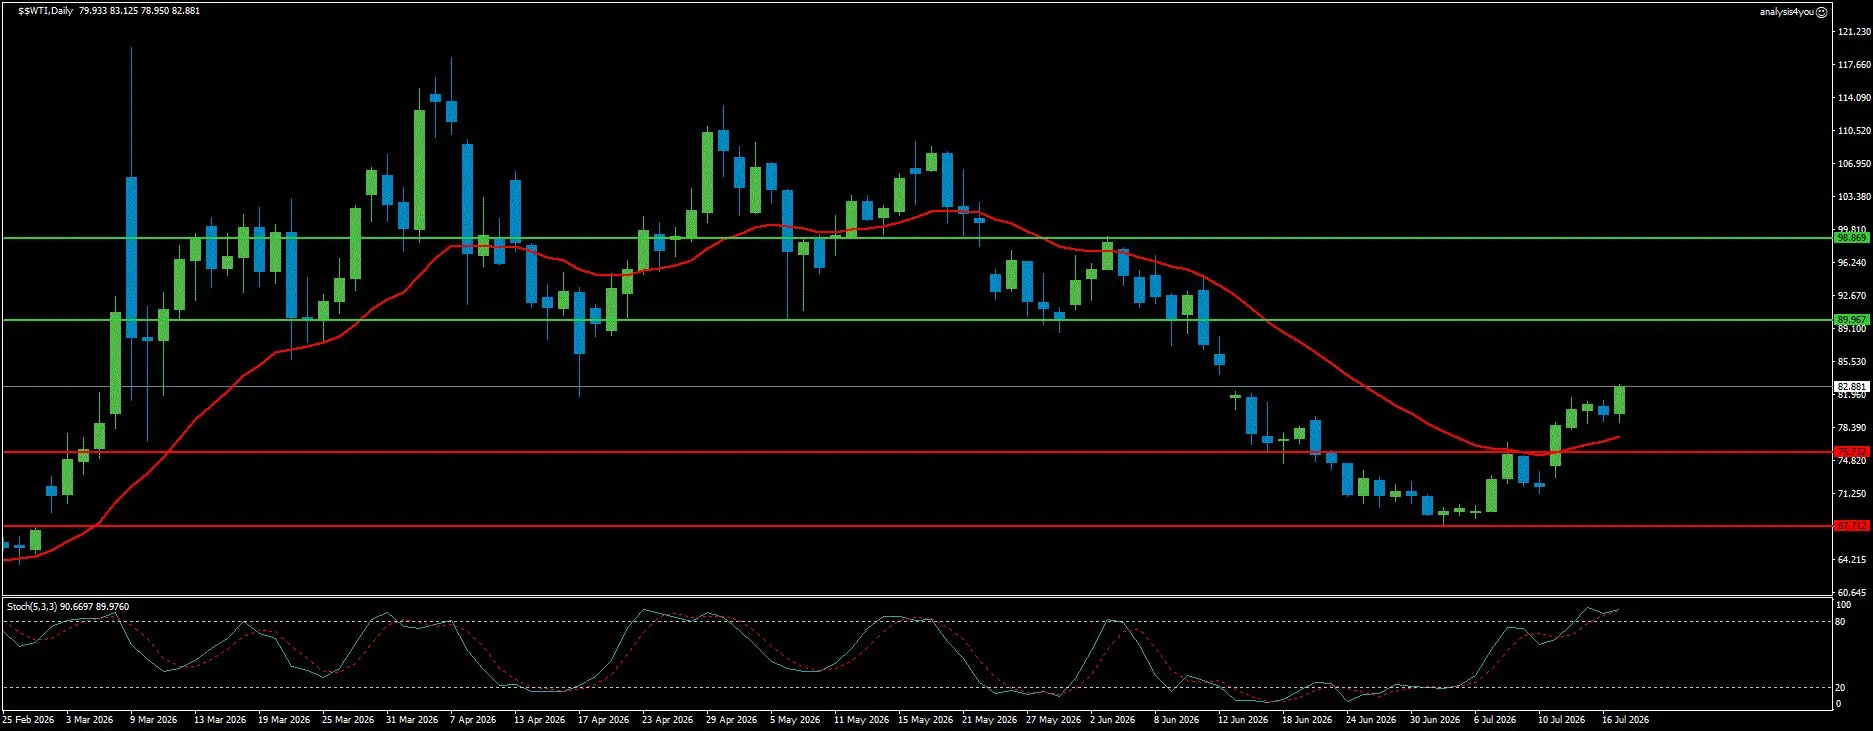
WTI Crude Oil: Breakout Above All Three MAs, 13% July Gain, Red Sea Threat (82.88)
Current Trend: Bullish
Resistance: 89.97 | 98.87
Support: 75.73 | 67.71
WTI Crude Oil delivered the most dramatic chart development of Week 19: a clean breakout above all three moving averages (MA20, MA50, and MA200) simultaneously (the first time WTI has been above all three MAs since the initial war outbreak drove the spike to 115 in March). The current price of 82.88 represents a 13% gain in July alone, reversing much of the June-early July collapse that had been driven by MOU optimism. The drivers are unambiguous: the MOU is dead, the Strait of Hormuz is effectively closed again, US strikes have expanded to civilian Iranian infrastructure, and Iran has threatened to close the Red Sea via Houthi activation.
The chart confirms the breakout in full. WTI is above all three MAs, with the current bar above the upper Bollinger Band and bullish. Stochastic is in an uptrend and overbought with a neutral signal. RSI is bullish. The 89.97 resistance is the next major level. A sustained break above 90 would target the 98.87 area and the psychological 100 level. Below current prices, 75.73 support is a significant distance below current prices (confirming the technical setup favors bulls near-term).
For Week 20, WTI is the most geopolitically sensitive instrument. The Red Sea threat from Iran via Houthi forces is the primary tail risk (if activated, oil would spike toward 95 to 100 rapidly). The Section 301 tariff deadline Friday adds a secondary supply-side input. Ukrainian attacks on Russian oil refineries add another layer of supply disruption. Resistance at 89.97 / 98.87. Support at 75.73 / 67.71.
Crypto
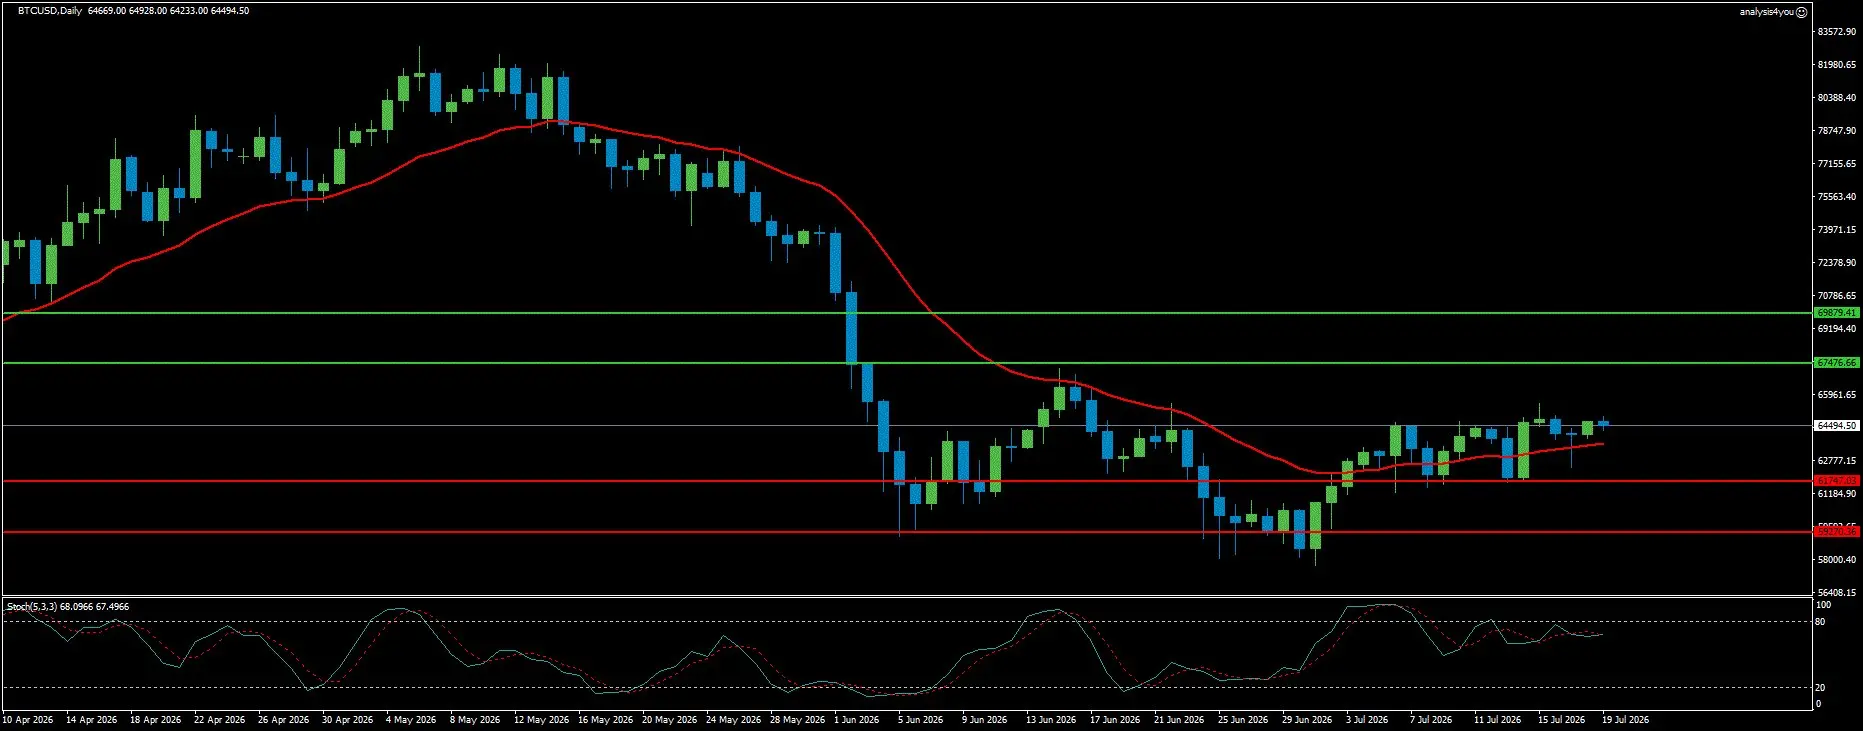
Bitcoin: Consolidating Above MA20, CLARITY Act Window Closing, ETF Flows Key (64,494)
Current Trend: Neutral
Resistance: 67,476 | 69,879
Support: 61,747 | 59,270
Bitcoin closed the week at 64,494, maintaining its position above the MA20 and the 200-week SMA at approximately 62,874. The recovery from the 57,800 all-time 2026 low has been gradual and lacks the conviction of genuine institutional re-engagement. ETF flows turned slightly positive for the first time in eight weeks at approximately 107 million dollars net, but this remains far below the levels needed to signal a trend reversal. The broader market context for Bitcoin in H1 2026 is stark: a 34% decline from the January 1 open while Nasdaq gained 20% and S&P 500 gained 10% (confirming this was a Bitcoin-specific correction rather than a broad risk-off event). The four H2 catalysts identified by analysts (CLARITY Act passage, ETF flows returning, Digital Asset Treasury behavior normalizing, and macro conditions improving) are all in progress but none has yet reached the threshold of confirmation.
The chart shows Bitcoin above its MA20 but clearly below the declining MA50 and MA200 (creating significant overhead supply). The current bar is at the middle Bollinger Band and bearish (the recovery bounce is losing momentum as it approaches the 67,476 resistance). Stochastic is in an uptrend with a neutral signal. RSI is neutral.
Week 20 has two specific Bitcoin catalysts. First, the CLARITY Act faces its narrow Senate floor window from July 13 to August 7 (any vote or procedural development this week would move the crypto market). Second, the broader tech earnings from Alphabet and Tesla on Wednesday will influence risk sentiment across the technology and innovation asset class including Bitcoin. The most important single indicator to watch remains weekly ETF flows (a second positive week would be the first genuine confirmation that institutional demand is returning). Resistance at 67,476 / 69,879. Support at 61,747 / 59,270.
Key Events (July 20–24, 2026)
Monday, July 20: Andy Burnham takes office as UK Prime Minister and delivers his first speech and cabinet announcement (confirmation of Mahmood as Chancellor expected). FOMC blackout period begins (Fed speakers go silent for the rest of this week and all of next week).
Tuesday, July 21: UK employment data (claimant count, earnings including and excluding bonuses, unemployment rate forecast 4.9%).
Wednesday, July 22: UK CPI (most important domestic UK data point of the week; core CPI expected to ease to 2.5% from 2.6%). Alphabet and Tesla Q2 earnings after the US close (most watched earnings of the week given the AI valuation debate).
Thursday, July 23: ECB interest rate decision (THE WEEK’S HEADLINE EVENT). Main Refinancing Rate expected to hold at 2.40%. Lagarde’s press conference scrutinized for signals on September. Intel reports after the close. Section 301 tariff investigation deadline.
Friday, July 24: Preliminary Flash PMIs for major economies (July reading: first gauge of business activity under renewed Hormuz disruption). UK retail sales.
Week Ahead Outlook
The base case for Week 20 is continued elevated volatility driven by geopolitical headlines, with markets broadly rangebound in the absence of Fed communication during the blackout period.
Base Case (approximately 40%)
WTI holds above 80 dollars and continues grinding toward 89.97 as the war premium is fully re-embedded. EUR/USD remains between 1.1376 and 1.1504 until the ECB press conference Thursday. GBP/USD consolidates near 1.3400 to 1.3536 ahead of UK CPI Wednesday. Gold bounces between 3,990 and 4,189 without direction. The S&P 500 consolidates near 7,330 to 7,580 as big tech earnings provide the directional catalyst. Bitcoin holds above 61,747.
Bull Case: Strong Tech Earnings (approximately 30%)
If Alphabet and Tesla deliver earnings with strong AI revenue growth, robust capital expenditure commitments, and positive AI infrastructure demand commentary, equities recover sharply. The Nasdaq 100 pushes back toward prior highs, dragging the S&P 500 through the 7,580 MA20 resistance toward 7,695. Bitcoin follows equities higher toward 67,476. A hawkish ECB surprise on Thursday adds EUR/USD upside toward 1.1561, further weakening the Dollar and providing a mild tailwind to all risk assets.
Bear Case: Red Sea Closure Activated (approximately 30%)
If Iran’s threat to activate Houthi forces in the Red Sea materializes, WTI spikes toward 95 to 100 dollars, Brent crosses 100. The safe-haven Dollar rallies sharply, pushing EUR/USD below 1.1376 toward the 1.1322 prior low and potentially the 1.12 Goldman Sachs target. GBP/USD breaks below 1.3379. Gold faces the unusual dynamic of both Dollar and Gold rising simultaneously. The S&P 500 sells off toward the 7,222 support as stagflation fears return with force. The Eurozone would be disproportionately affected as European energy import costs through the Suez Canal route would surge.
Bottom line: Twenty weeks into the Iran war, the market faces its most complex configuration yet. The peace dividend from the MOU was real and visible in June CPI data (the largest monthly decline since COVID). But the MOU is now effectively dead, the Strait remains disrupted, and Iran has introduced the Red Sea as a new potential chokepoint. Gold testing $4,000, the S&P 500 broken below its MA20, WTI above all three MAs for the first time since March, and GBP/USD at its strongest structure since before the war began: the market is not telling one coherent story, it is telling seven different stories simultaneously. The ECB Thursday and big tech earnings Wednesday are the scheduled resolution catalysts. The Red Sea is the unscheduled override that could make everything else irrelevant.


